
Live pyqtgraph plot
Pglive package adds support for thread-safe live plotting based on pyqtgraph.
It supports PyQt5, PyQt6 and PySide6.
Description
Pyqtgraph doesn't offer easy way to implement live plotting out of the box. The aim of PgLive module is to provide easy way of thread-safe live plotting. To do this, PgLive provides DataConnector object, which consumes data and manages data plotting. DataConnector interface provides Pause and Resume method, update rate and maximum number of plotted points. All that needs to be done is to connect plots and data sources with DataConnector. Once data is collected, DataConnector is sending signals to the GUI main loop.
Focus on data handling - leave plotting to pglive.
You can find many examples for PyQt5, PyQt6 or PySide6.
Code example
import sys
from math import sin
from threading import Thread
from time import sleep

from PyQt6.QtWidgets import QApplication

from pglive.sources.data_connector import DataConnector
from pglive.sources.live_plot import LiveLinePlot
from pglive.sources.live_plot_widget import LivePlotWidget

"""
Line plot is displayed in this example.
"""
app = QApplication(sys.argv)
running = True

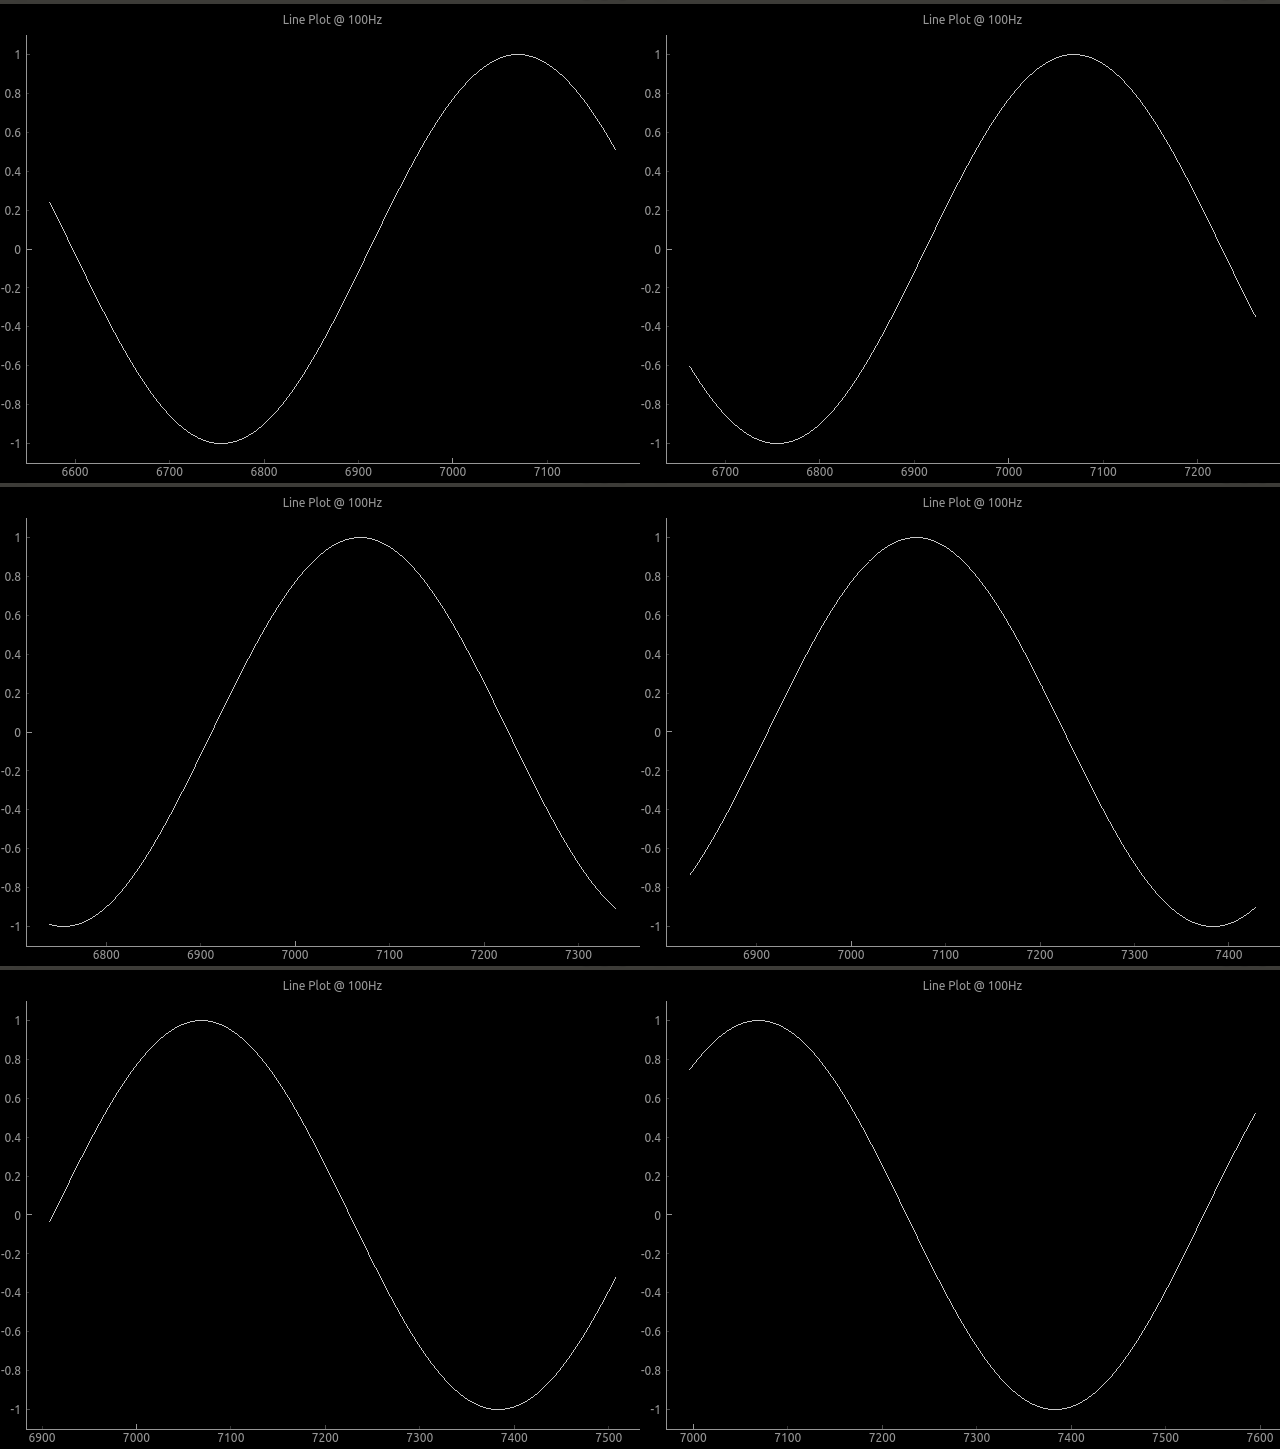
plot_widget = LivePlotWidget(title="Line Plot @ 100Hz")
plot_curve = LiveLinePlot()
plot_widget.addItem(plot_curve)
# DataConnector holding 600 points and plots @ 100Hz
data_connector = DataConnector(plot_curve, max_points=600, update_rate=100)


def sin_wave_generator(connector):
    """Sine wave generator"""
    x = 0
    while running:
        x += 1
        data_point = sin(x * 0.01)
        # Callback to plot new data point
        connector.cb_append_data_point(data_point, x)
        sleep(0.01)


plot_widget.show()
# Start sin_wave_generator in new Thread and send data to data_connector
Thread(target=sin_wave_generator, args=(data_connector,)).start()
app.exec()
running = False
Output:
To run built-in examples, use python3 -m parameter like:
python3 -m pglive.examples_pyqt6.all_plot_types
python3 -m pglive.examples_pyqt6.crosshair
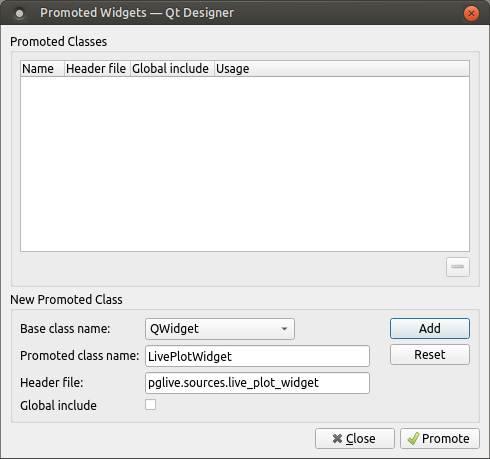
Using PyQt5/6 designer
- Add QWidget to Your layout
- Promote QWidget to
LivePlotWidgetand set header file topglive.sources.live_plot_widget - Click
AddandPromotebutton
Available plot types
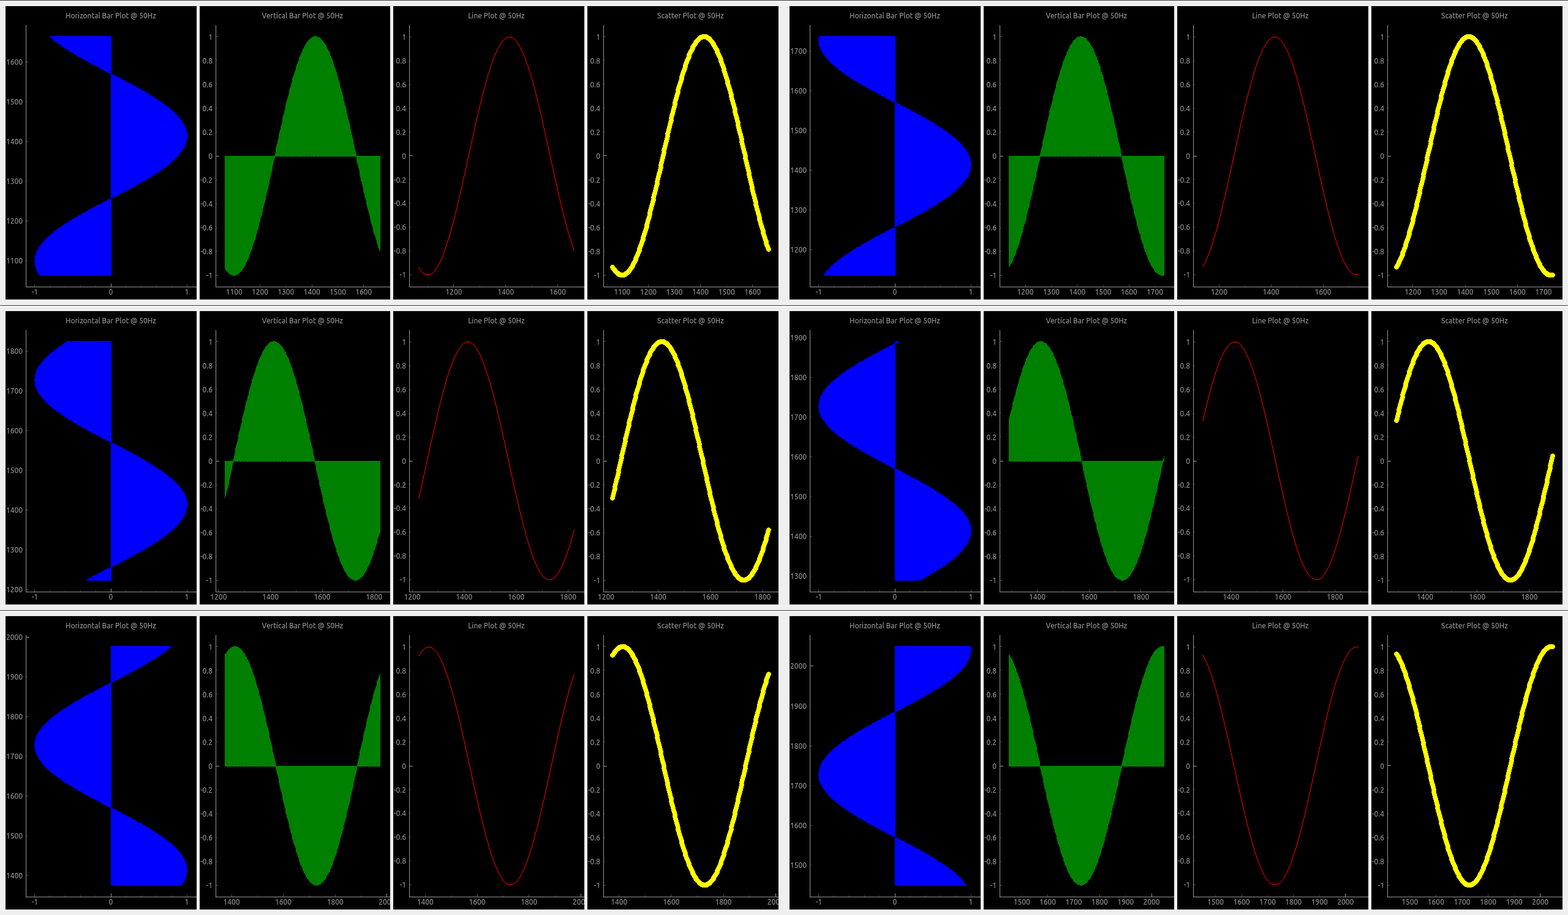
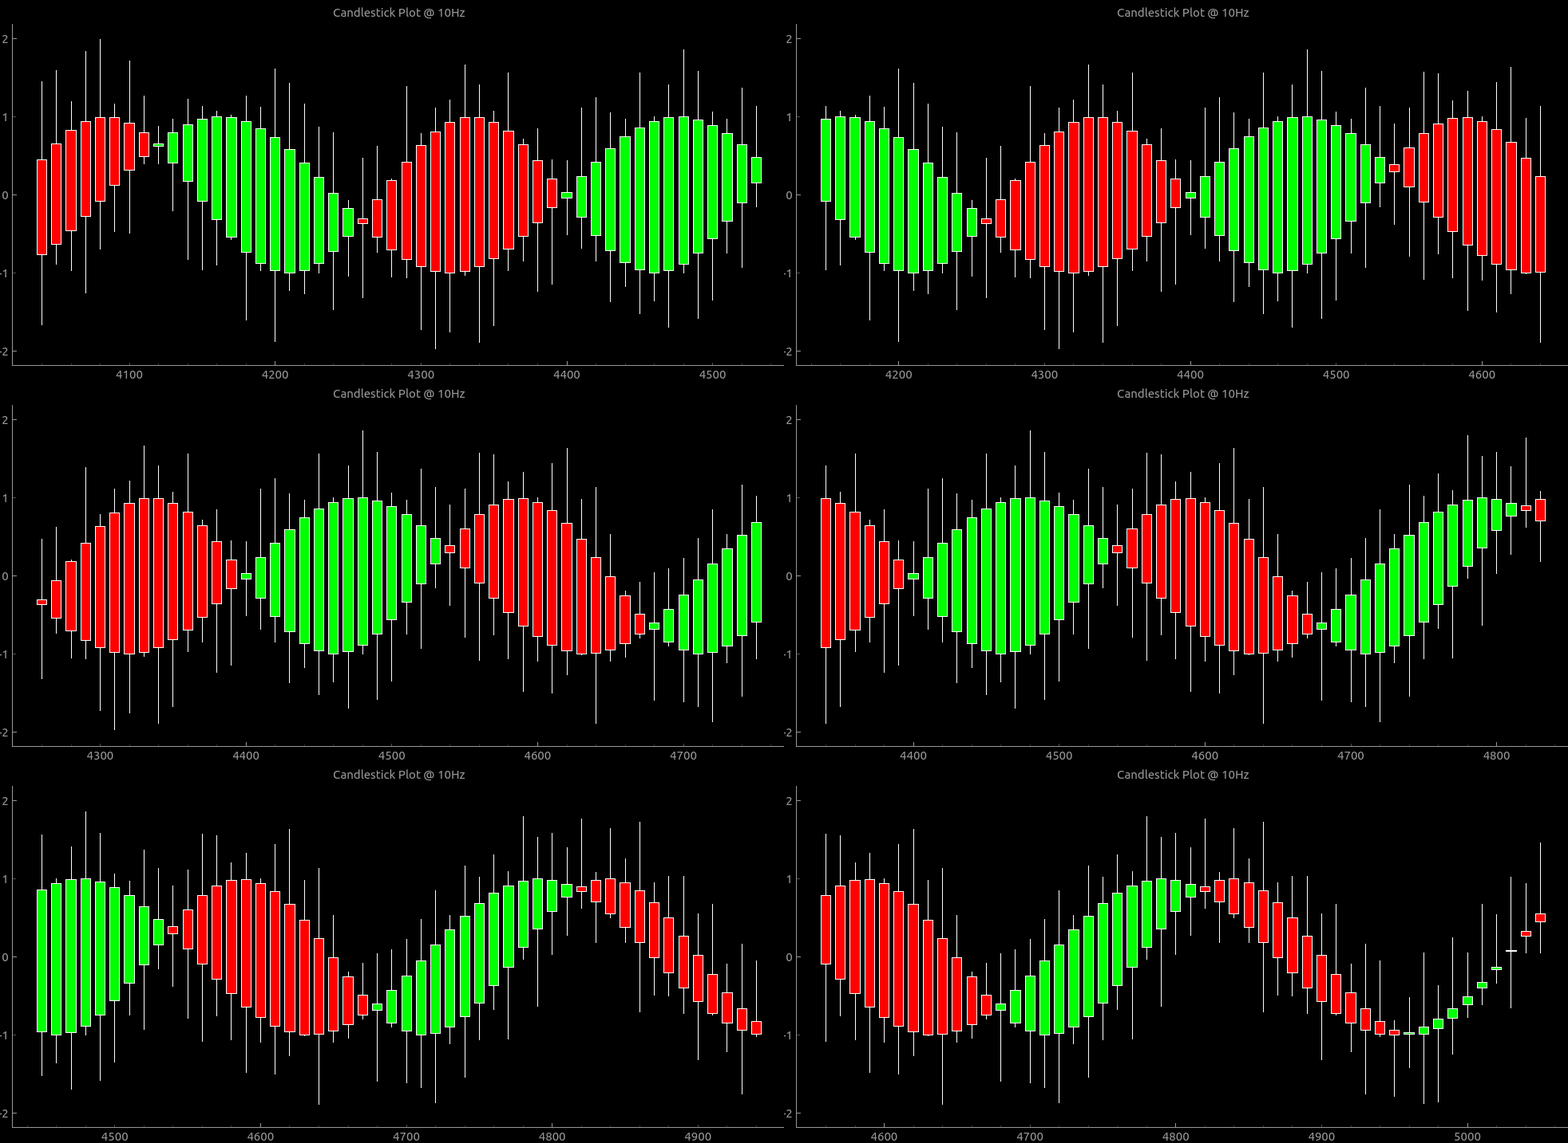
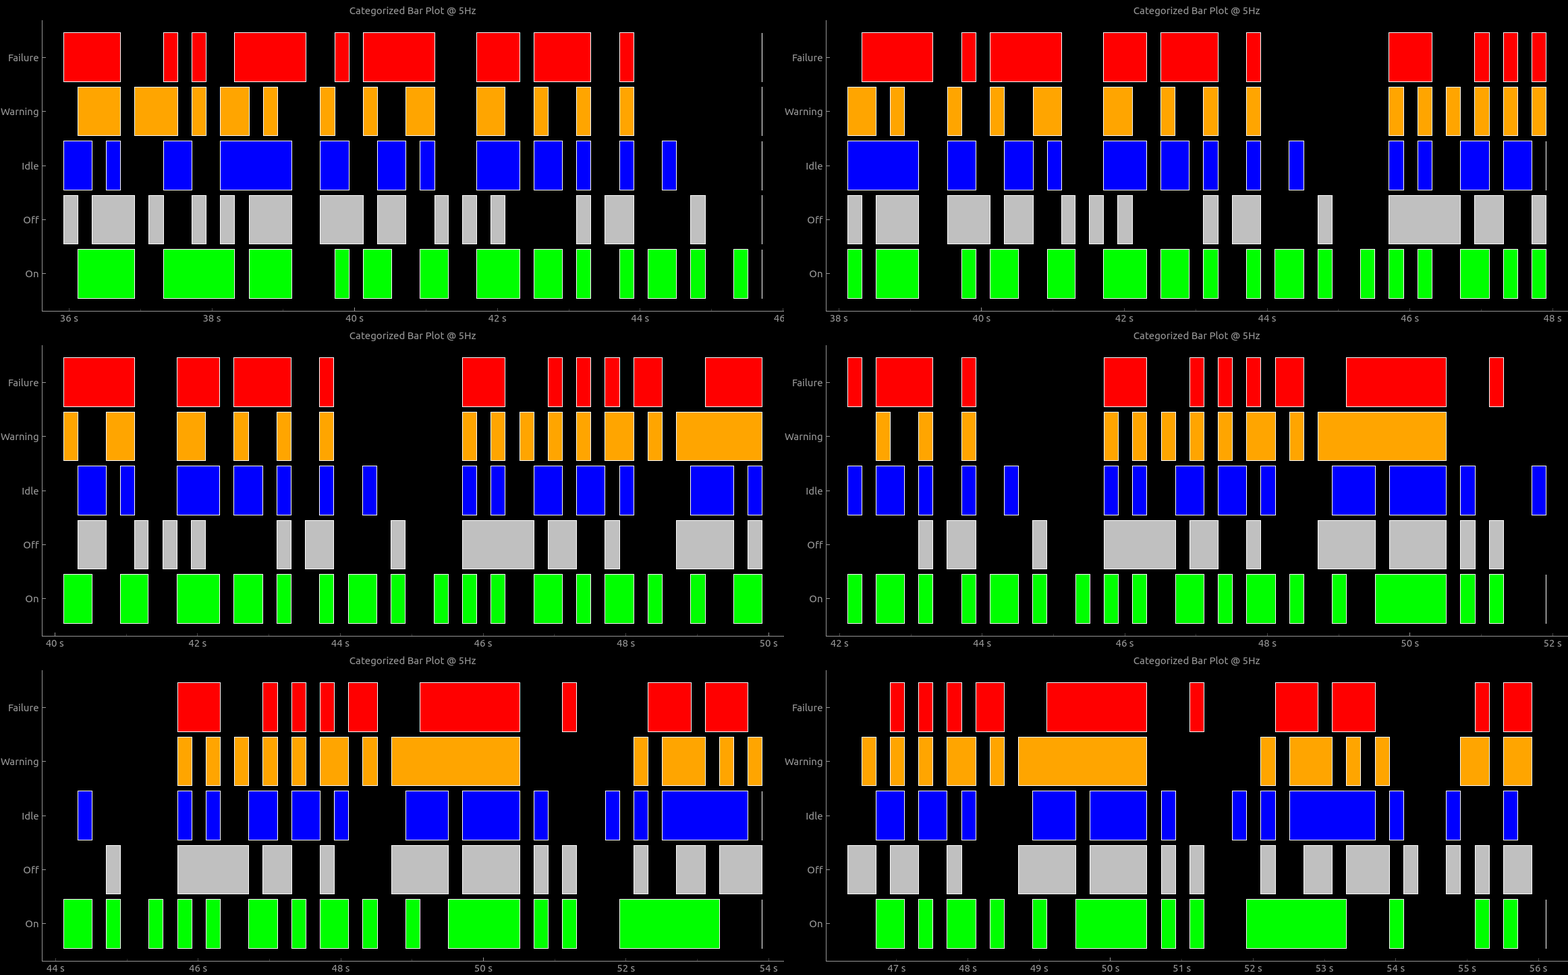
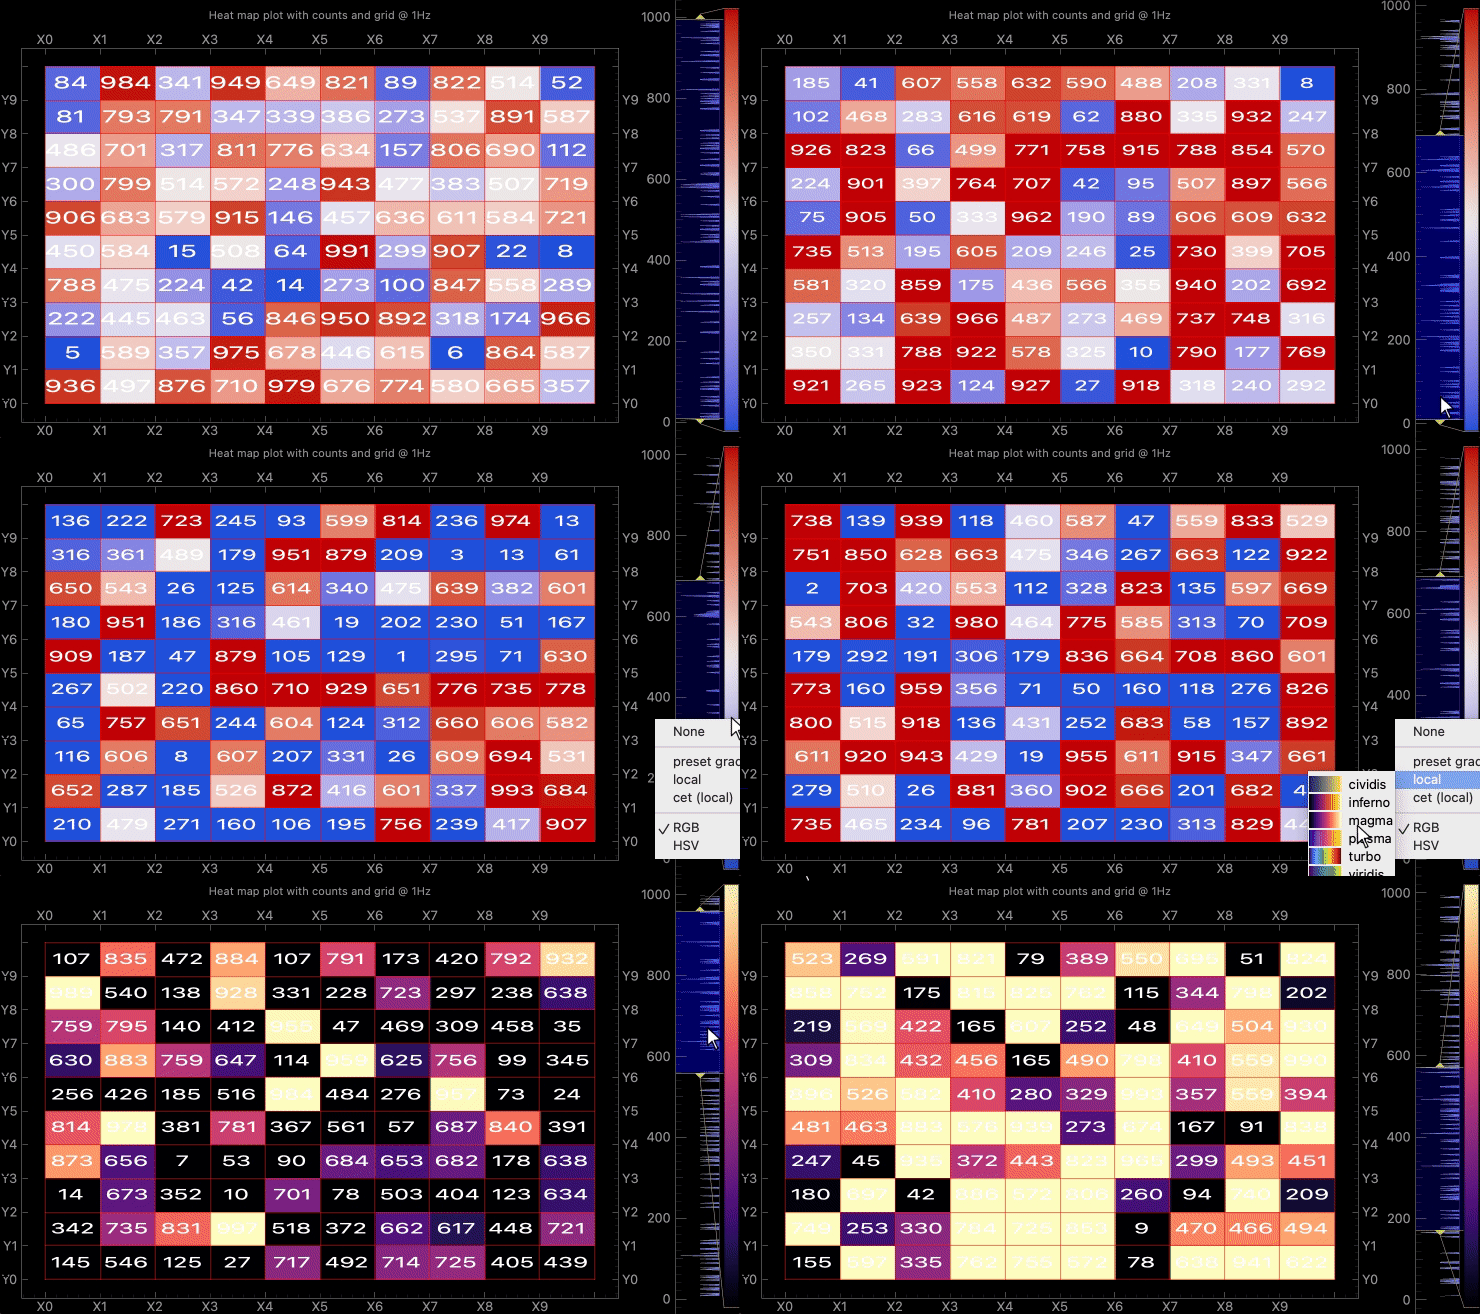
Pglive supports four plot types: LiveLinePlot, LiveScatterPlot, LiveHBarPlot (horizontal bar plot),
LiveVBarPlot (vertical bar plot) and LiveCandleStickPlot.
Plot speed optimizations
Scaling plot view to plotted data has a huge impact on plotting performance.
Re-plotting might be laggy when using high update frequencies and multiple plots.
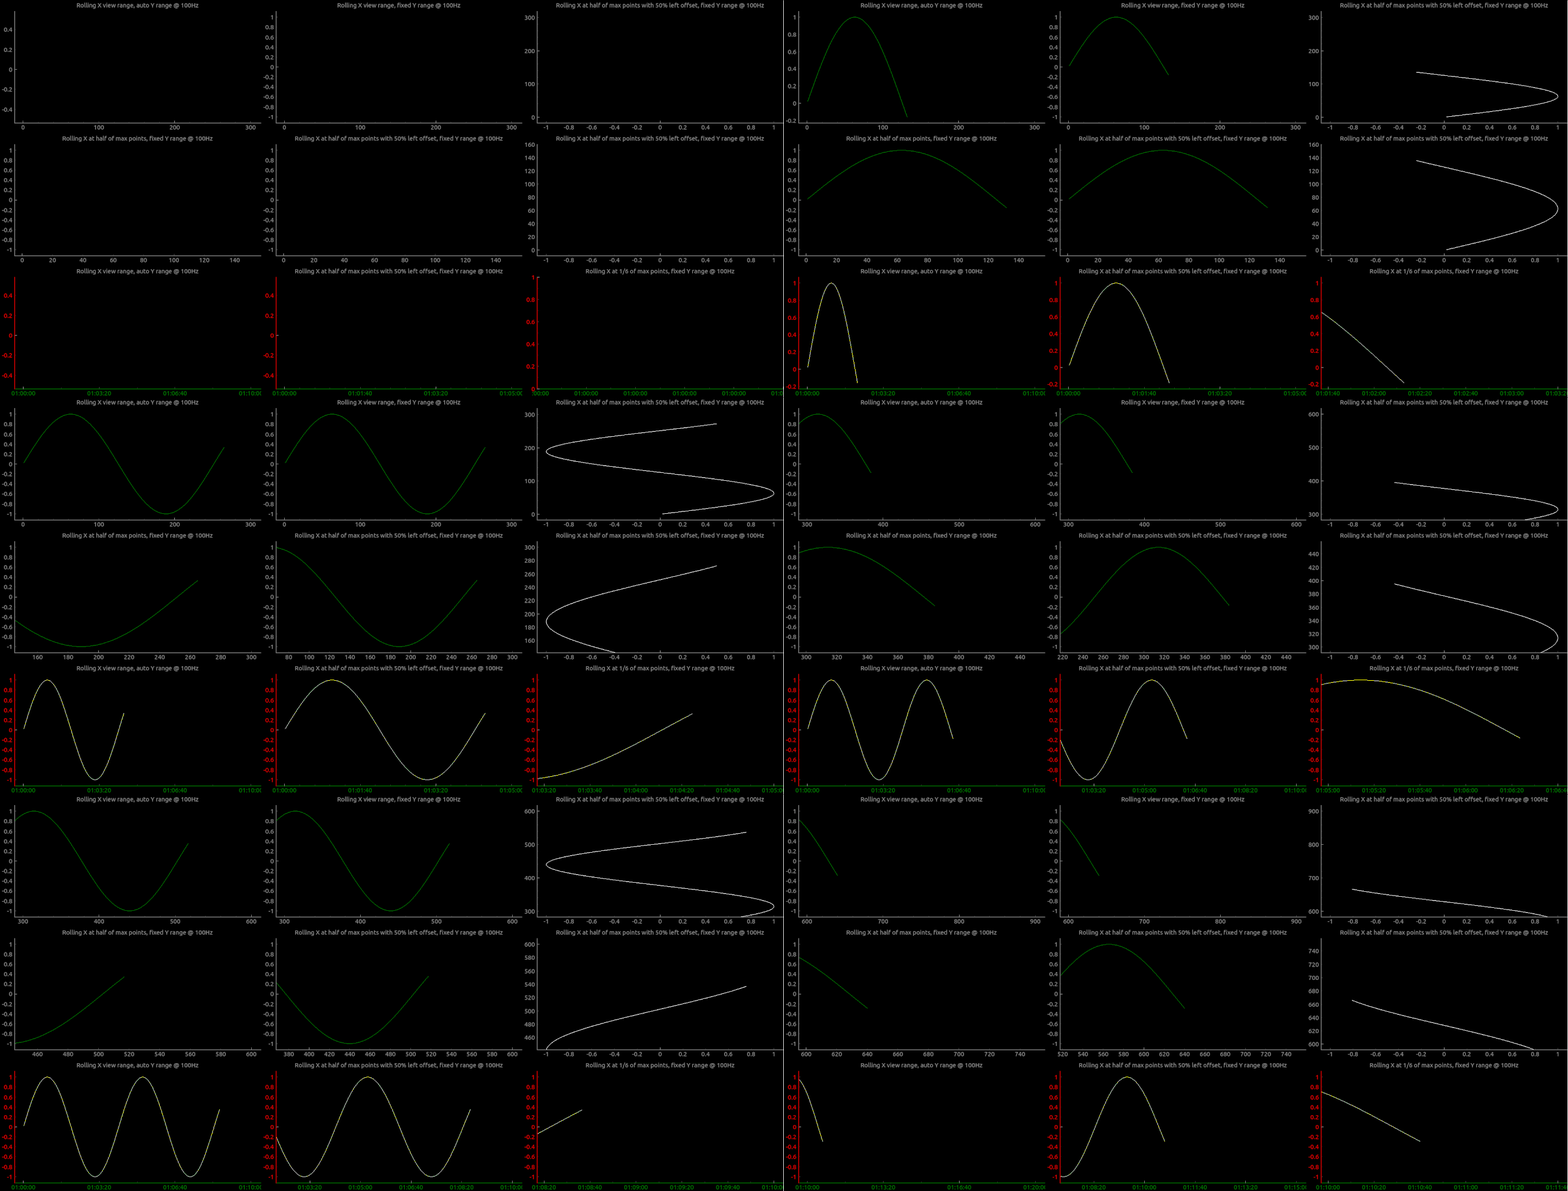
To increase plotting performance, pglive introduces LiveAxisRange, that can be used in LivePlotWidget.
User can specify when and how is a new view of plotted data calculated.
Have a look in the live_plot_range.py example.
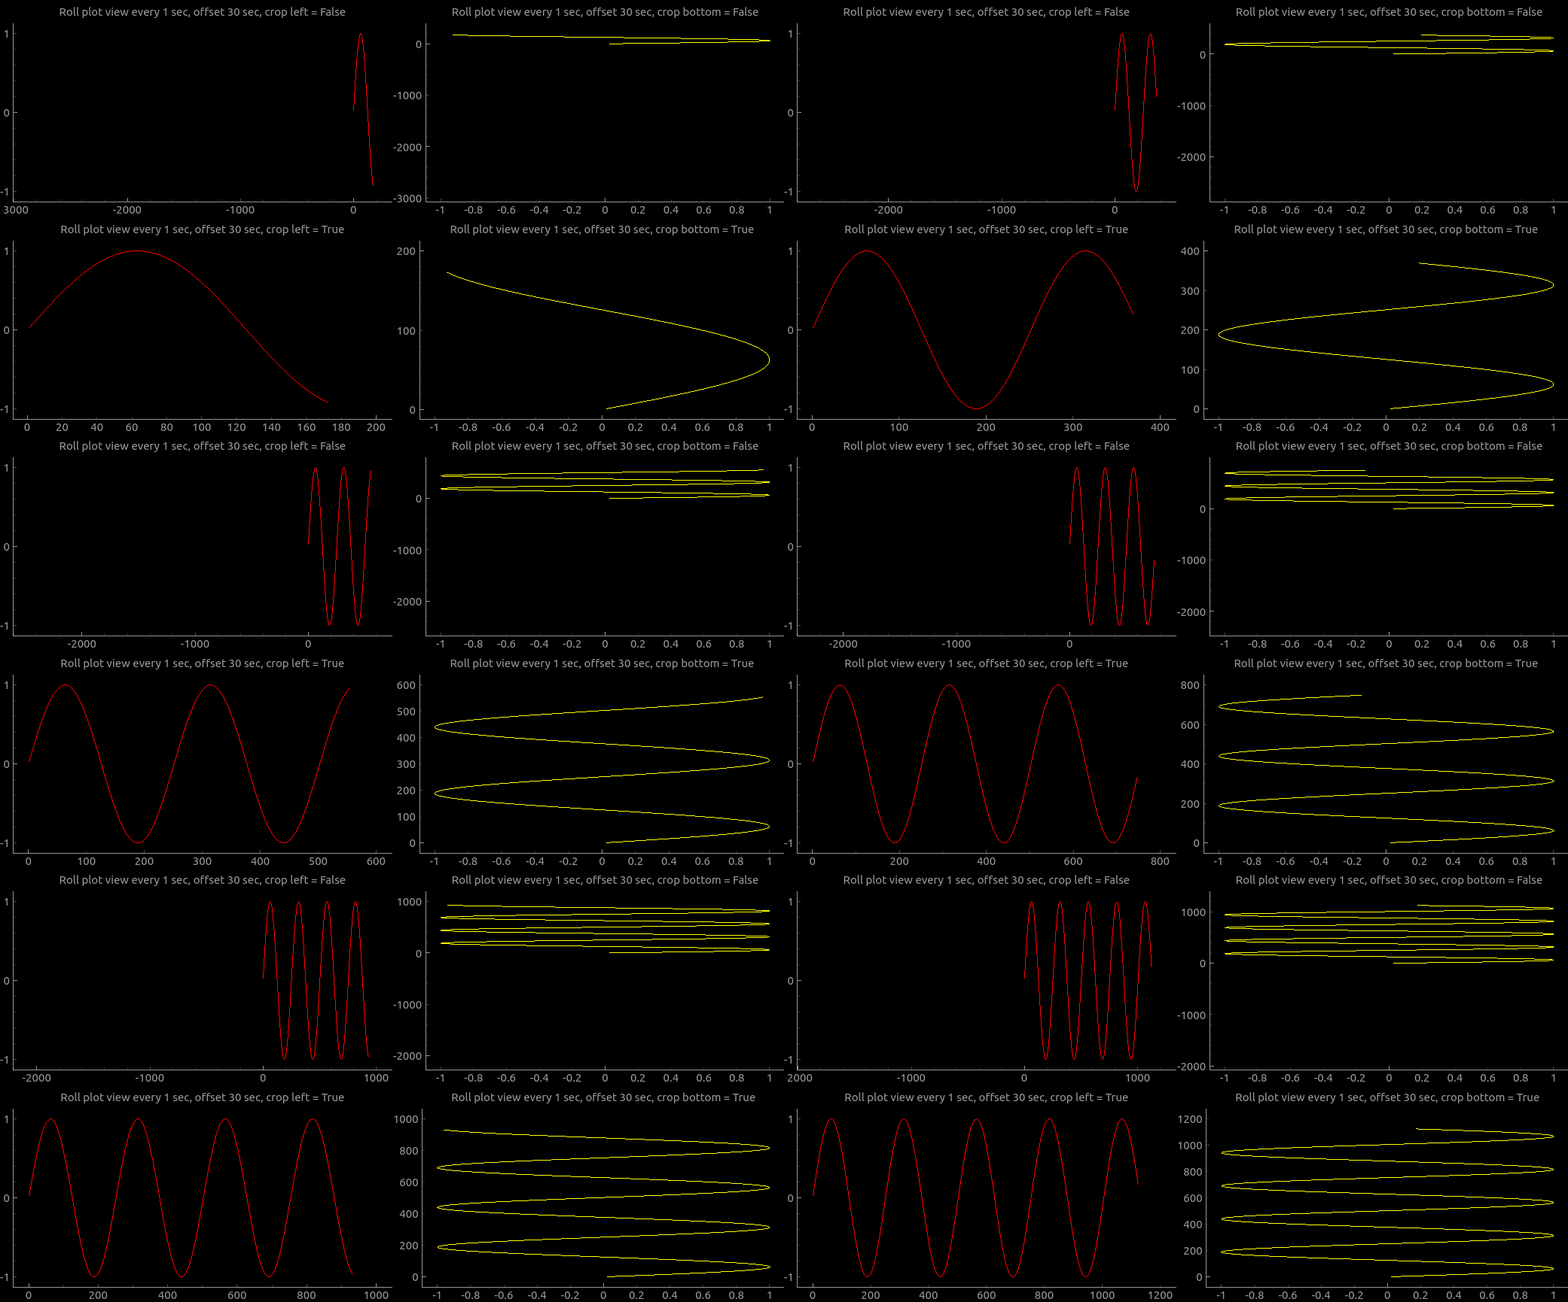
In case you want to plot wider area with LiveAxisRange you can use crop_offset_to_data flag.
For example, you want to store 60 seconds, display 30 seconds in a view and move view every 1 second.
You will end up with big empty space to the left if crop_offset_to_data = False.
Take a look into crop_offset_to_data.py example.
Introduced in v0.4.0
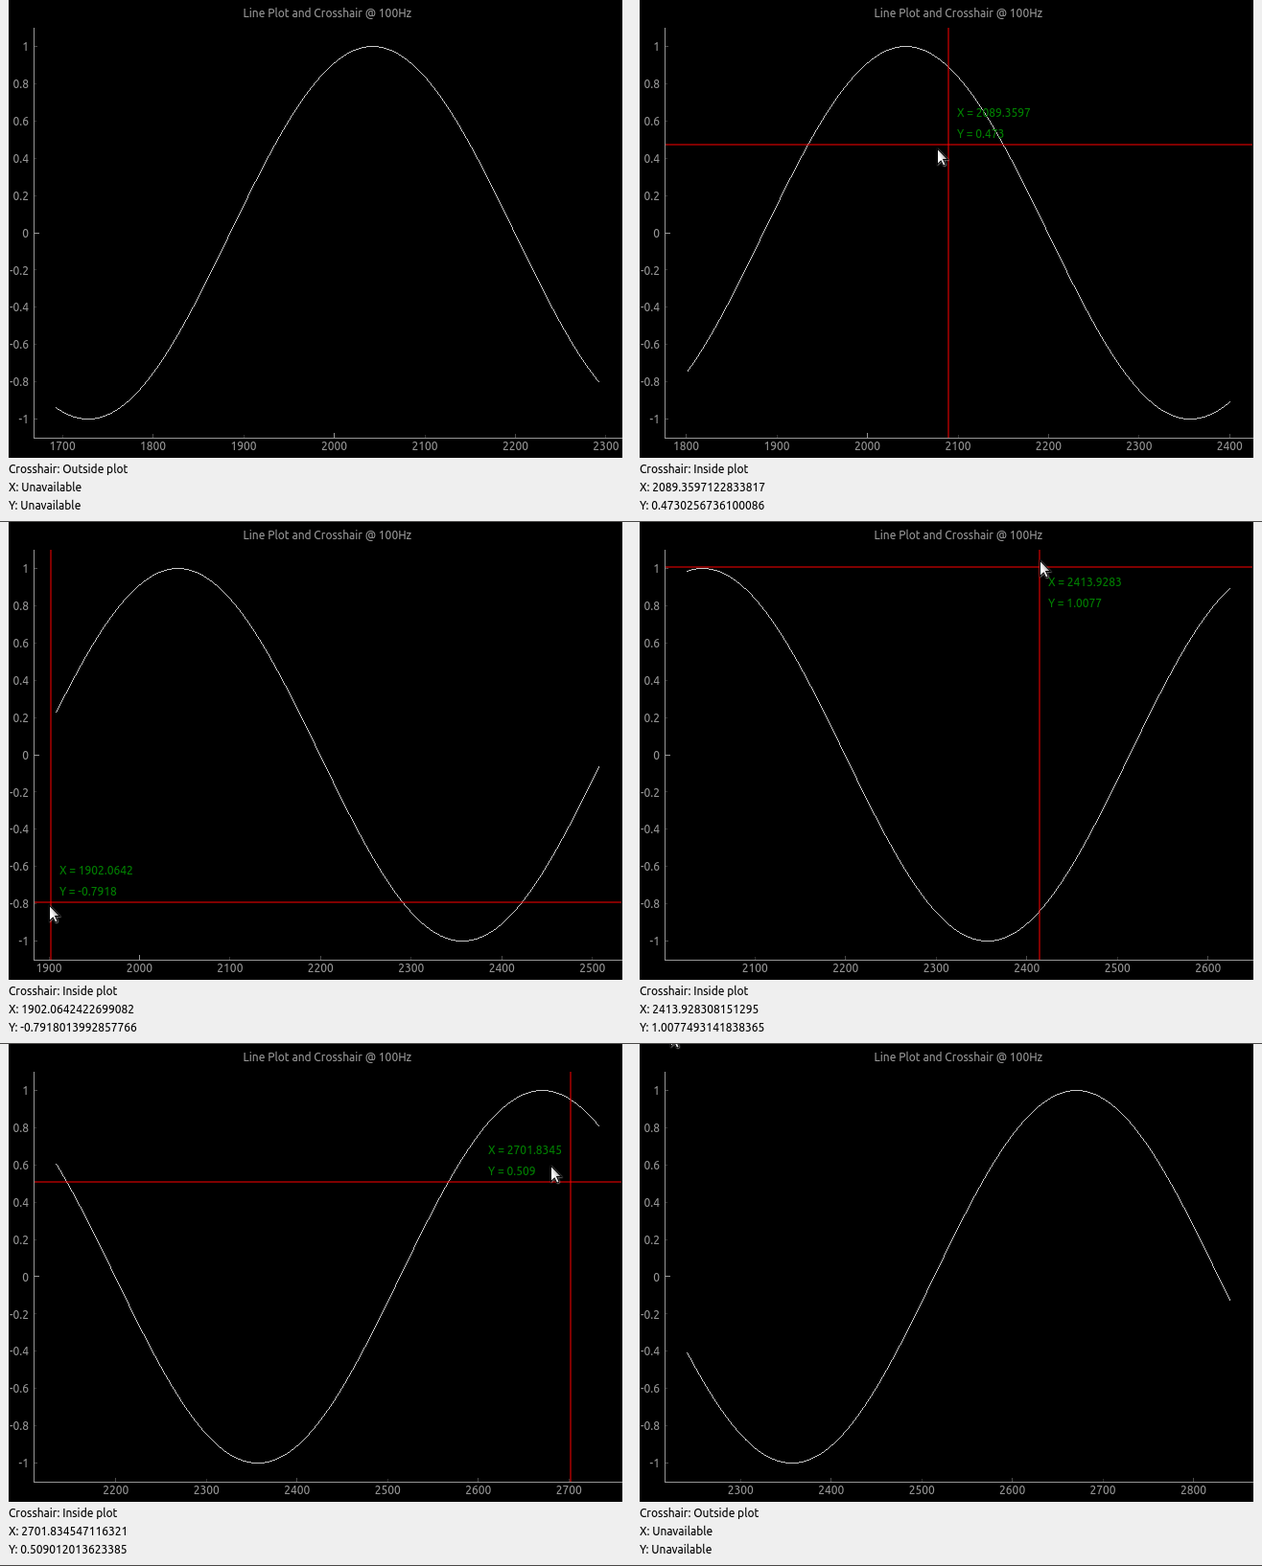
Crosshair
Pglive comes with built-in Crosshair as well. Take a look at crosshair.py example.
Leading lines
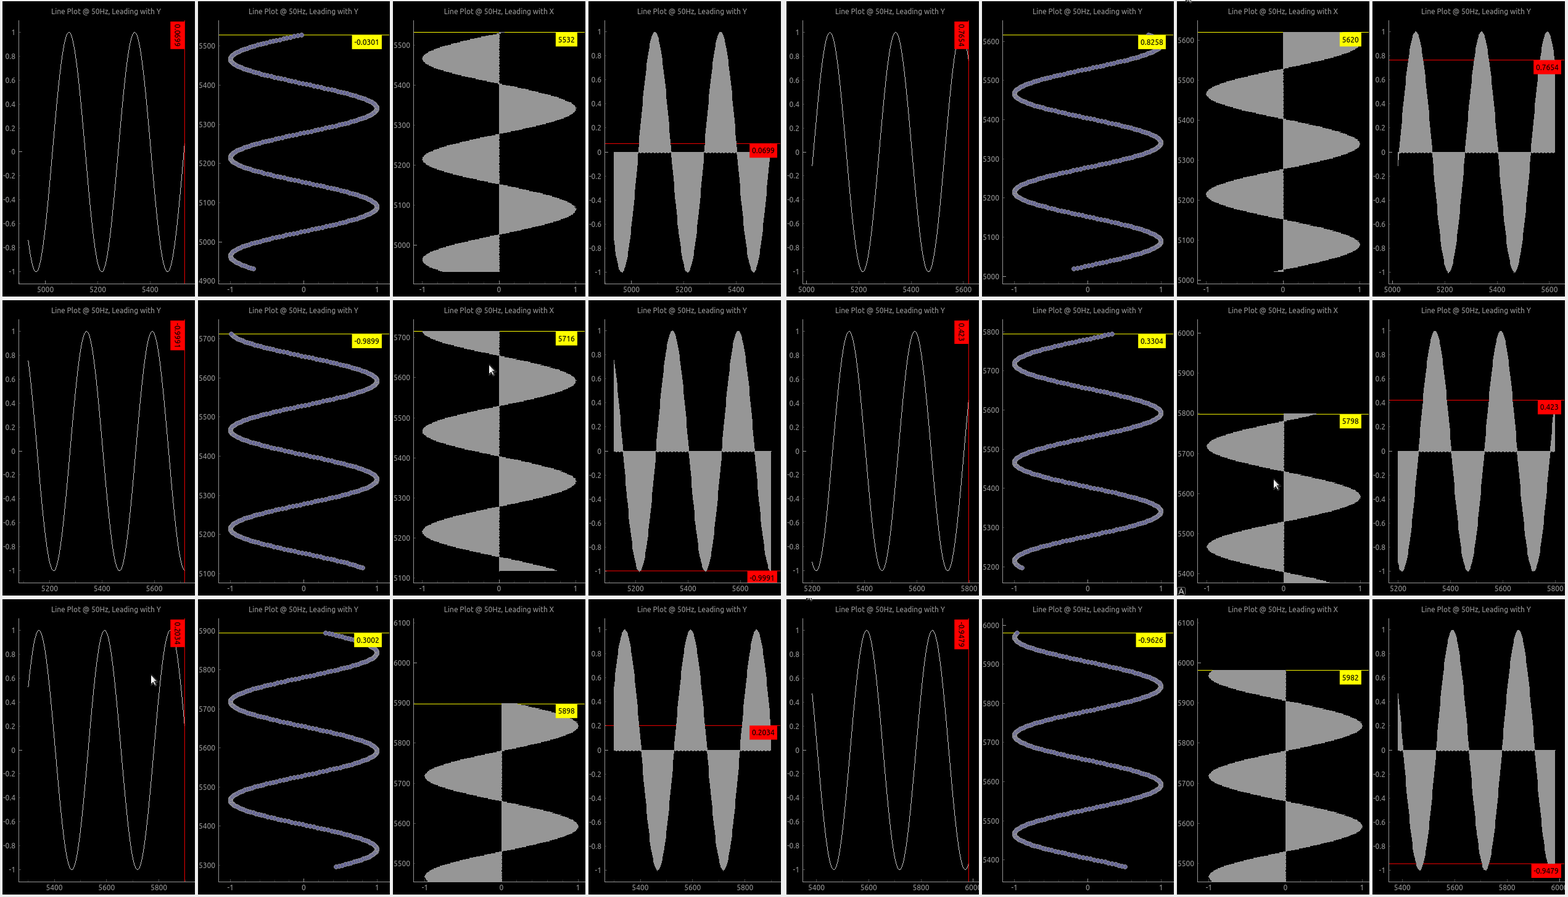
Leading line displays horizontal or vertical line (or both) at the last plotted point.
You can choose its color and which axis value is displayed along with it.
Example at leading_line.py
Axis
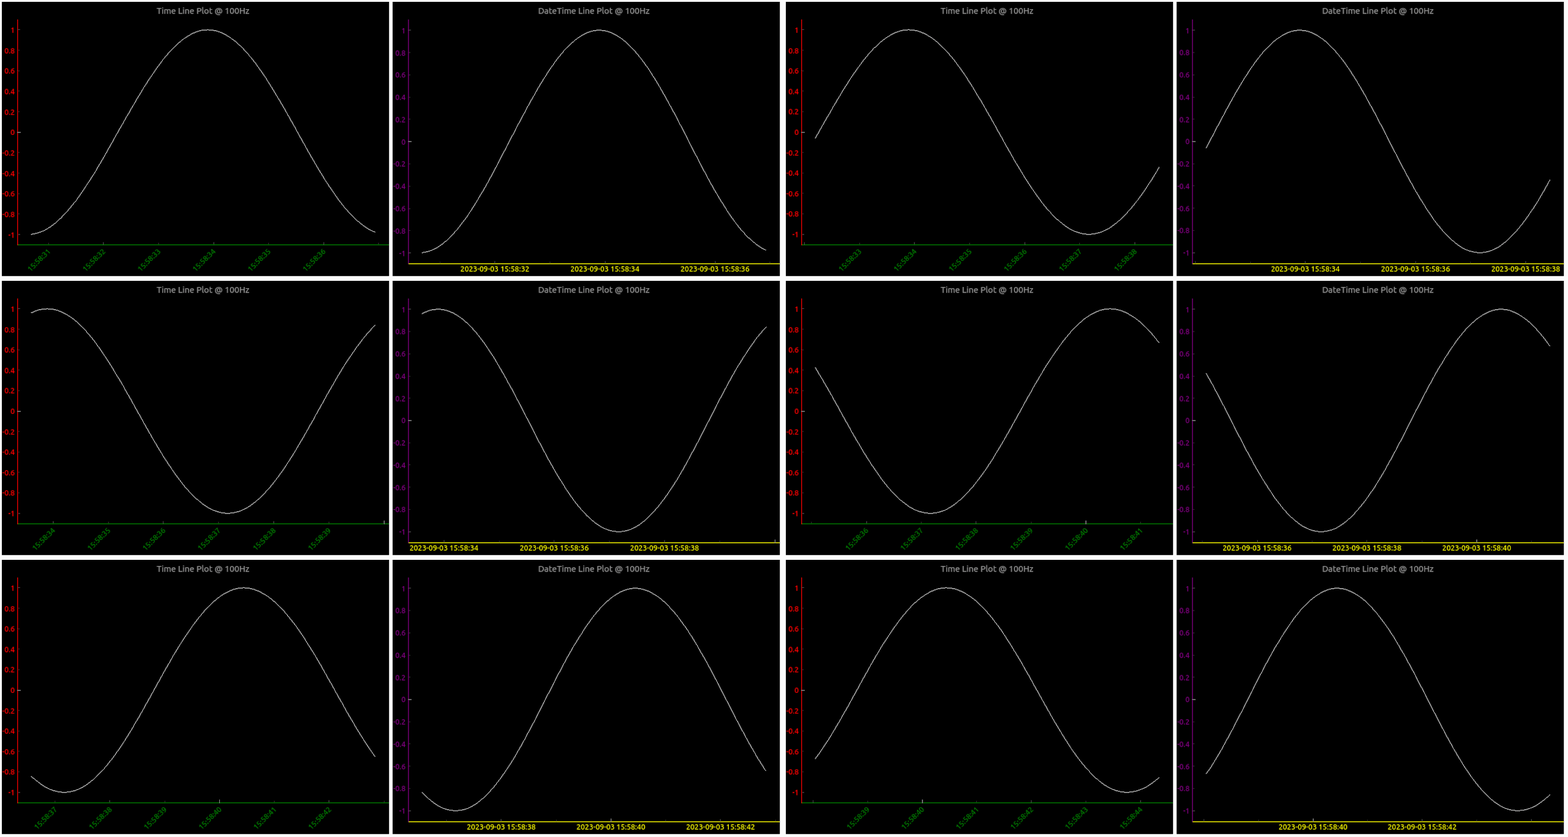
To make life easier, pglive includes a few axis improvements:
- Colored axis line using new
axisPenattribute - Time and DateTime tick format, converting timestamp into human-readable format
- Use
tick_angleattribute to change tick angle from 0 default degree
Example at axis.py
Summary
- With Pglive You've got an easy Thread-safe live plot implementation in Pyqt5, Pyqt6 or PySide6
- You can use all
kwargsthat works in pyqtgraph - Use your plots with
DataConnectordirectly - It works with Python3.9, 3.10, 3.11 and 3.12 as well
- Multiple optimized plot types
- Many examples for easy start
If you find PgLive helpful, please consider supporting me, it helps a lot!
Thanks to all contributors, feel free to suggest missing feature or any bug on GitHub.
1 maintainer

Metadata
1 maintainer
Release files for pglive 0.9.1
For a detailed explanation of source distributions (sdists) and built distributions (wheels), please see the package formats documentation.
Source distribution (sdist)
| File | Size | Uploaded | |
|---|---|---|---|
| pglive-0.9.1.tar.gz | 41.6 kB | Details |
Built distribution (wheel)
| File | Interpreter | ABI | Platform | Reset |
|---|---|---|---|---|
| pglive-0.9.1-py3-none-any.whl | Python 3 | none | any | Details |
Total release size: 120.3 kB
Release files / pglive-0.9.1.tar.gz
| Download URL | pglive-0.9.1.tar.gz |
|---|---|
| Size | 41.6 kB |
| Tags | Source |
|
SHA-256 checksum How to use checksums |
df24b350703469be8f9cf931acec6b72b6572f7aaea43cc7966c290ea955118d
|
|
BLAKE2b-256 checksum How to use checksums |
6cbaf43da9c6a58ddec06b7d9f27e0fdb44e2345aa8e195fe308cf8898ca6fa5
|
| Upload date | |
|
Uploaded using Trusted Publishing? What is trusted publishing? |
No |
| Uploaded via |
poetry/2.4.1 CPython/3.13.9 Darwin/25.6.0
|
Release files / pglive-0.9.1-py3-none-any.whl
| Download URL | pglive-0.9.1-py3-none-any.whl |
|---|---|
| Size | 78.7 kB |
| Tags | Python 3 |
|
SHA-256 checksum How to use checksums |
740be01e23910ed51779089f3d67637e695618698570c6b212418edaf2550859
|
|
BLAKE2b-256 checksum How to use checksums |
7319b3a1904df6bfdb215b0e126fc510f27172723d201c63453ea74efe4d9035
|
| Upload date | |
|
Uploaded using Trusted Publishing? What is trusted publishing? |
No |
| Uploaded via |
poetry/2.4.1 CPython/3.13.9 Darwin/25.6.0
|














