Intuitive evaluation of out-of-distribution detectors using simple toy examples.

Project description
phepy 


phepy is a Python package to visually evaluate out-of-distribution detectors using simple toy examples.
Installation
pip
The phepy package is available on the Python Package Index (PyPI) and can be installed using
pip install phepy
This command can also be run inside a conda environment to install phepy with conda.
From Source
First, clone the git repository using
git clone https://github.com/juntyr/phepy.git
or
git clone git@github.com:juntyr/phepy.git
Next, enter the repository folder and use pip to install the program:
cd phepy && pip install .
Usage Example
The following code snippet only provides a minimal example to get started, please refer to the examples folder to find more extensive examples.
# Import numpy, matplotlib, and sklearn
import numpy as np
import sklearn

from matplotlib import pyplot as plt
from sklearn.neighbors import LocalOutlierFactor

# Import phepy, three toy examples, the out-of-distribution (OOD)
#  detector and scorer, and the plotting helper function
import phepy

from phepy.detector import OutOfDistributionDetector, PercentileScorer
from phepy.plot import plot_all_toy_examples
from phepy.toys import ToyExample
from phepy.toys.line import LineToyExample
from phepy.toys.circle import CircleToyExample
from phepy.toys.haystack import HaystackToyExample


# Generate three toy test cases
line = LineToyExample(np.random.default_rng(42))
circle = CircleToyExample(np.random.default_rng(42))
haystack = HaystackToyExample(np.random.default_rng(42))


# Use the Local Outlier Factor (LOF) [^1] as an OOD detector
class LocalOutlierFactorDetector(OutOfDistributionDetector):
    @staticmethod
    def low_score_is_low_confidence() -> bool:
        return True

    def fit(
        self, X_train: np.ndarray, Y_train: np.ndarray
    ):
        self.__X_lof = LocalOutlierFactor(novelty=True).fit(X_train)

        return self

    def predict(self, X_test: np.ndarray) -> np.ndarray:
        return self.__X_lof.score_samples(X_test)


# Generate the plot for the LOF detector and the three test cases
fig = plot_all_toy_examples(
    scorers = {
        "Local Outlier Factor": PercentileScorer(LocalOutlierFactorDetector()),
    },
    toys = [line, circle, haystack],
    cmap = "coolwarm", # use e.g. "viridis" to be colour-blind safe
)

plt.show()
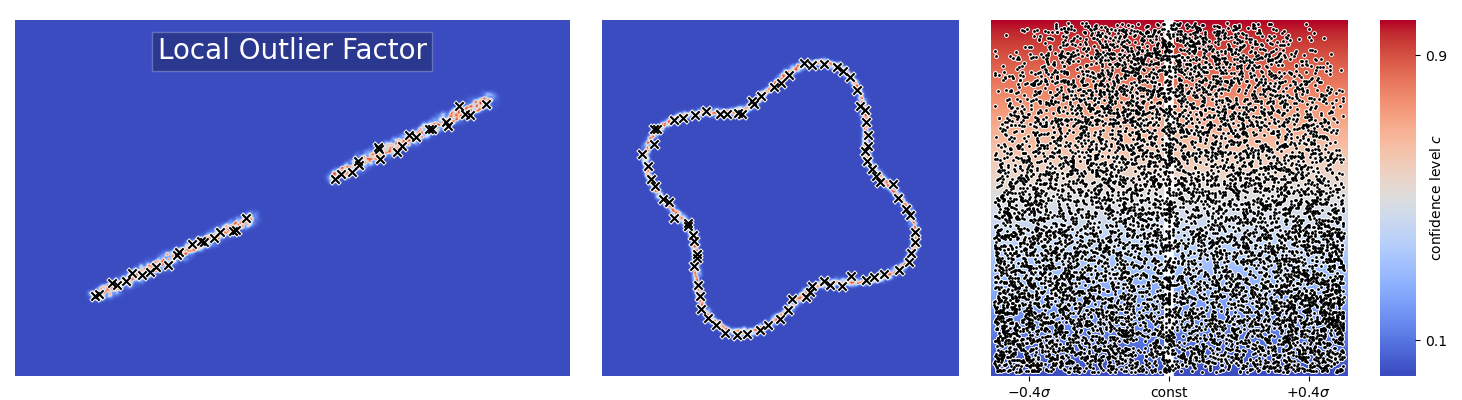
In the above figure, the single row showcases the Local Outlier Factor (LOF, [^1]) method, while the three columns contain the following three test cases:
- Two groups of training points are scattered along a line in the 2D feature space. The target variable only depends on the location along the line. In this example, points off the line are OOD.
- The training points are scattered around the sine-displaced boundary of a circle, but none are inside it. The target variable only depends on the location along the boundary. Again, points off the line are OOD.
- The training points are sampled from a 10-dimensional multivariate normal distribution, where one of the features is set to a constant. This example tests whether an OOD detection method can find a needle in a high-dimensional haystack, i.e. identify that points which do not share the constant are OOD.
The first two panels depict a subset of the training points using black x markers. Note that the first two plots do not have axis labels since the two axes map directly to the 2D feature space axes. The third plot differs and shows the distribution of confidence values on the y-axis for different x-axis values for the constant-in-training feature. The constant value is highlighted as a white line.
The Local Outlier Factor (LOF, [^1]) estimates the training data density around unseen data. Thus, it performs quite well on the line and circle examples where the data points are closely scattered. The LOF classifies the gap between the two groups of training inputs on the line as out-of-distribution (OOD), which may be too conservative if we assume that a machine-learning model can interpolate between the two groups. While LOF produces slightly lower confidence for the OOD inputs in the haystack, it does not clearly identify test data that do not have the constant feature seen in training as out-of-distribution.
License
Licensed under either of
- Apache License, Version 2.0 (
LICENSE-APACHEor http://www.apache.org/licenses/LICENSE-2.0) - MIT license (
LICENSE-MITor http://opensource.org/licenses/MIT)
at your option.
Contribution
Unless you explicitly state otherwise, any contribution intentionally submitted for inclusion in the work by you, as defined in the Apache-2.0 license, shall be dual licensed as above, without any additional terms or conditions.
Citation
Please refer to the CITATION.cff file and refer to https://citation-file-format.github.io to extract the citation in a format of your choice.
[^1]: M. M. Breunig et al. LOF: Identifying Density-Based Local Outliers. Proceedings of the 2000 ACM SIGMOD International Conference on Management of Data. SIGMOD '00. Dallas, Texas, USA: Associ- ation for Computing Machinery, 2000, 93–104. Available from: doi:10.1145/342009.335388.
Release history Release notifications | RSS feed


Download files
Download the file for your platform. If you're not sure which to choose, learn more about installing packages.
Source Distribution
Built Distribution
Filter files by name, interpreter, ABI, and platform.
If you're not sure about the file name format, learn more about wheel file names.
Copy a direct link to the current filters
File details
Details for the file phepy-0.1.0.tar.gz.
File metadata
- Download URL: phepy-0.1.0.tar.gz
- Upload date:
- Size: 20.1 kB
- Tags: Source
- Uploaded using Trusted Publishing? Yes
- Uploaded via: twine/4.0.1 CPython/3.11.4
File hashes
| Algorithm | Hash digest | |
|---|---|---|
| SHA256 |
2d07ed2f77d298e338faa4e005dc690f6f44404e0025e424a79b467075e44a8f
|
|
| MD5 |
cc63cece8735567da2c0ac968172f49b
|
|
| BLAKE2b-256 |
7ef65c39481dd71d895caa2f62f068ebed1012b7900a533a96322f0b92f65a72
|
File details
Details for the file phepy-0.1.0-py3-none-any.whl.
File metadata
- Download URL: phepy-0.1.0-py3-none-any.whl
- Upload date:
- Size: 20.1 kB
- Tags: Python 3
- Uploaded using Trusted Publishing? Yes
- Uploaded via: twine/4.0.1 CPython/3.11.4
File hashes
| Algorithm | Hash digest | |
|---|---|---|
| SHA256 |
83cd7927a736a87935cdc27511d70bf1409b6b327dfea4c3934f686d0d00693c
|
|
| MD5 |
754ffd0d722b3bf299a0b10083f4b1be
|
|
| BLAKE2b-256 |
f44941baa826fd42a38bd3d2035d4fc4c947a00f8ae359d90147959ad9244924
|


