universal biomarker prediction tool

Project description
patient
This is under review.
Patients need to know effects of medication and exercise for alleviating diseases. Biomarkers are used to monitor the status of individual diseases.
phope.py (Patient for Hospital Observation and Predicting Effects of medication and exercise) with five determinants such as "day" (tested date), "hgb" of hbA1c value (biomarker for diabetes), "ntbnp" of NT-proBNP value (biomarker for heart failure), "degree1" (polynomial regression for hbA1c), and "degree2" (polynomial regression for NT-proBNP) is a universal biomarker prediction tool that can be used for evaluating the performance and predicting values of biomarkers for the next hospital visit.
To run phope.py after creating a data.csv, type python phope.py in the terminal. The following table is an example of data.csv. 2023/4/10 is the date of the next hospital visit.
An example of data.csv for phope.py

In phope.py, you can change Python codes for your use.
phope was developed based on phope.py which is a PyPI universal biomarker prediction tool with data.csv. PyPI allows phope to run on Windows, MacOS, and Linux operating systems as long as Python is installed on the system. phope can set left vertical axis and right vertical axis of two biomakers with data.csv.
data.csv for phope is a data file composed of seven determinants such as "day" (tested date), "hbA1c" value (biomarker for diabetes), "NT-proBNP" value (biomarker for heart failure), "degree1" (polynomial regression for hbA1c), "degree2" (polynomial regression for NT-proBNP), the left vertical-axis range (low and high), and the right vertical-axis range (low and high).
The data.csv file must be created by the patient or physician before running the program as shown in the following table.
An example of data.csv for phope
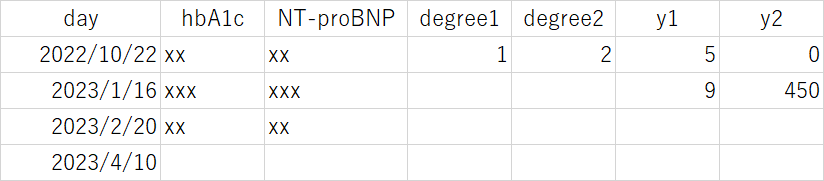
phope allows users to modify two biomarker's names such as hbA1c and NT-proBNP in data.csv.
The next hospital visit date is automatically recognized by phope with the end of "day" in data.csv.
Five determinant names such as "day", "degree1", "degree2", "y1" and "y2" should not be changed in data.csv.
This example shows two biomarkers such as hbA1c and NT-proBNP.
phope can predict any two biomakers simultaneously with the second and third columns in data.csv.
Columns 4 (degree1) and 5 (degree2) show the degree of polynomial regression for the first and second biomarkers, respectively.
Columns 6 (y1) and 7 (y2) set the range of vertical axis for the first and second biomarkers, respectively. The range of y1 is from 5 to 9 and that of y2 is from 0 to 450.
Based on data.csv with state-of-the-art technology using linear polynomial regressions, phope or phope.py can calculate and predict values of biomarkers for the next hospital visit.
R2-squared value can identify the best polynomial regression model. The higher the R2-squared, the better the prediction accuracy.
Predicting biomarker values allows patients to know the progress and trends of improvement in their diseases.
Predictive values are hopes of patients.
An image png file will be automatically generated by phope or phope.py
How to install phope
If you receive an error message in installation, Python may not be installed properly.
$ pip install phope
How to run phope
Make sure that data.csv file is the same directory for running phope.
$ phope
The result will be displayed on your screen and the png image file will be also generated.
Release history Release notifications | RSS feed


Download files
Download the file for your platform. If you're not sure which to choose, learn more about installing packages.
Source Distribution
Built Distribution
Filter files by name, interpreter, ABI, and platform.
If you're not sure about the file name format, learn more about wheel file names.
Copy a direct link to the current filters
File details
Details for the file phope-0.0.10.tar.gz.
File metadata
- Download URL: phope-0.0.10.tar.gz
- Upload date:
- Size: 3.7 kB
- Tags: Source
- Uploaded using Trusted Publishing? No
- Uploaded via: twine/5.1.0 CPython/3.8.12
File hashes
| Algorithm | Hash digest | |
|---|---|---|
| SHA256 |
fe00c346e4ff03985441a9c2f85bb1380bdeb0c75f28dd70d7d6755ba58e4f8b
|
|
| MD5 |
e4c9a49f8995c3705a44fe9e12fe3aa7
|
|
| BLAKE2b-256 |
3474cc924ef13a9a080e4b5990f1ab17717b43f167658039e87ecccb6b38489d
|
File details
Details for the file phope-0.0.10-py3-none-any.whl.
File metadata
- Download URL: phope-0.0.10-py3-none-any.whl
- Upload date:
- Size: 3.8 kB
- Tags: Python 3
- Uploaded using Trusted Publishing? No
- Uploaded via: twine/5.1.0 CPython/3.8.12
File hashes
| Algorithm | Hash digest | |
|---|---|---|
| SHA256 |
5bb6d407348e9bc299982b234fb65de114dadb1483313b69960fc10e483684d2
|
|
| MD5 |
4f02bd1bb781a2e4a8e7b7474499bd75
|
|
| BLAKE2b-256 |
74ca9fd224de5e2419b73f41e16b200d590fc6c71bdeac709e148931e436a530
|


