

Kinase activity inference from phosphosproteomics data based on substrate sequence specificity


Research paper: https://doi.org/10.1093/bioinformatics/btae697 (NOTE: outdated; the current method is vastly improved and includes new features)
Benchmark: https://github.com/alussana/phosx-benchmark
Overview
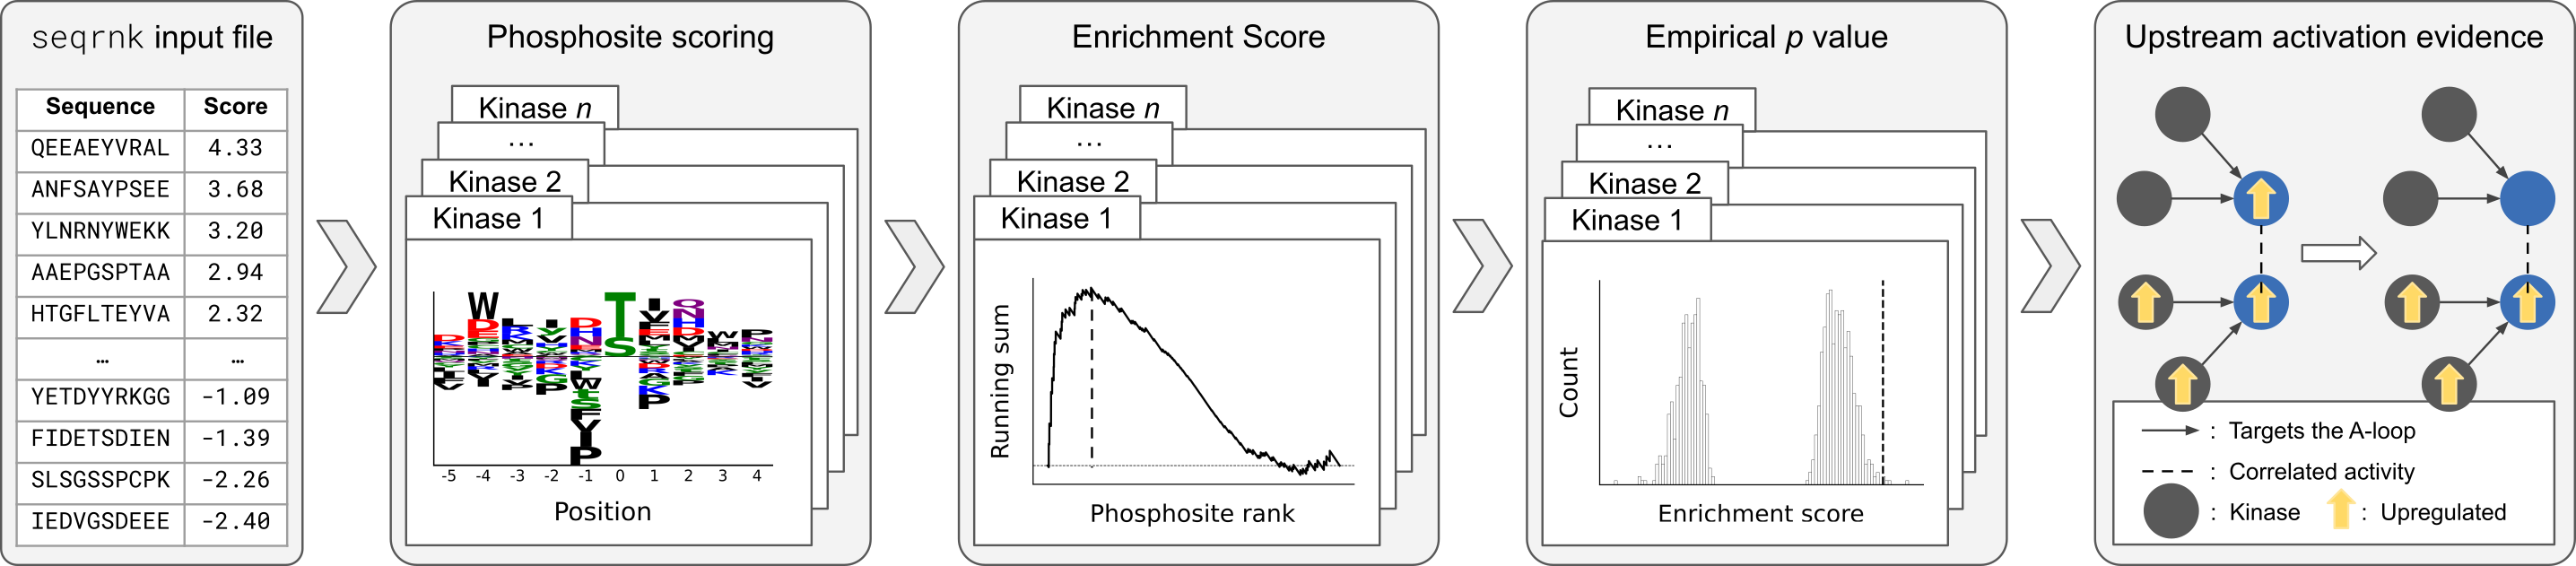
PhosX infers differential kinase activities from phosphoproteomics data without requiring any prior knowledge database of kinase-phosphosite associations. PhosX assigns the detected phosphopeptides to potential upstream kinases based on experimentally determined substrate sequence specificities, and it tests the enrichment of a kinase's potential substrates in the extremes of a ranked list of phosphopeptides using a Kolmogorov-Smirnov-like statistic. A p value for this statistic is extracted empirically by random permutations of the phosphosite ranks. By considering the A-loop sequence of kinase domains, PhosX refines the inferred kinase activity changes by computing the upstream activation evidence, further improving accuracy.
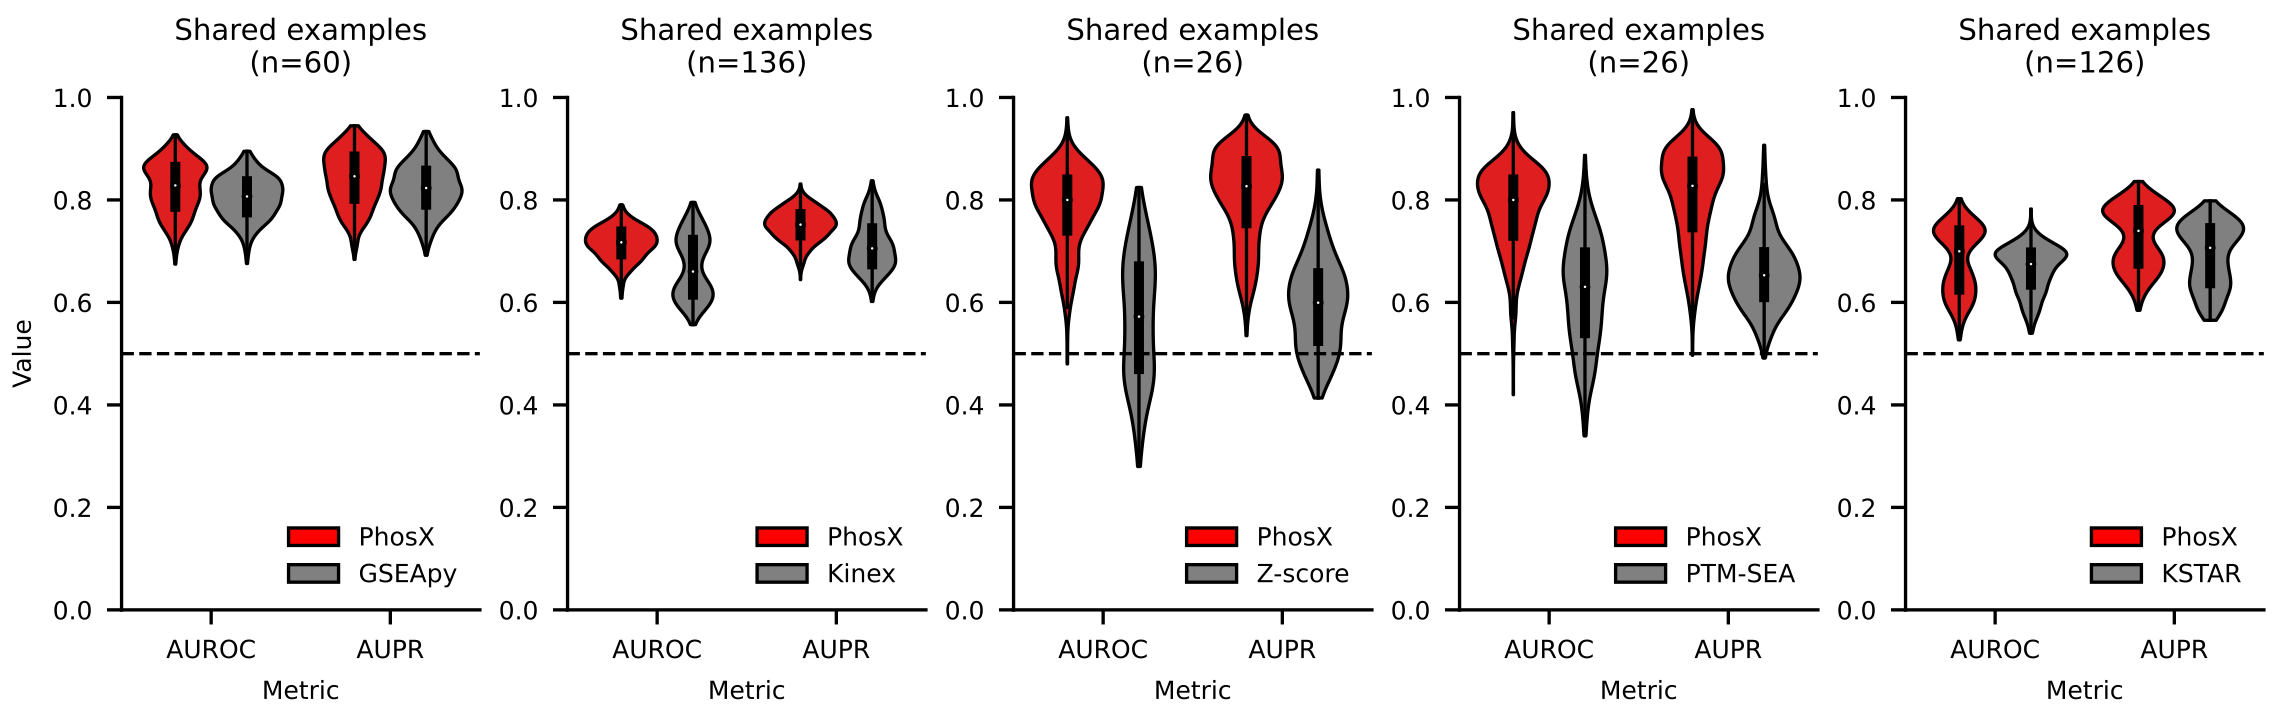
In the benchmark PhosX consistently outperformed popular alternative methods, including KSTAR, KSEA, Z-score, Kinex, and PTM-SEA, in identifying expected regulated kinases in over a hundred phosphoproteomics perturbation experiments. The performance gain was expecially remarkable in identifying upregulated kinases, potentially making PhosX an ideal tool to discover therapeutic targets for kinase inhibitors. All evaluated methods except Kinex and PhosX are based on prior knowledge of kinase-substrate associations.
Installation
From PyPI
pip install phosx
From source (requires Poetry)
poetry build
pip install dist/*.whl
Usage
PhosX can be used as a command line tool (phosx) with minimal effort. Its output is redirected by default in STDOUT, making it easy to use in bioinformatics pipelines. Alternatively, the user can specify an output filename (option -o).
Example: run PhosX with default parameters on an example dataset, using up to 4 cores, and redirecting the output table to kinase_activities.tsv:
phosx -c 4 tests/seqrnk/koksal2018_log2.fold.change.8min.seqrnk > kinase_activities.tmp
A brief description of the command line options can be viewed with `phosx -h`:
██████╗░██╗░░██╗░█████╗░░██████╗██╗░░██╗
██╔══██╗██║░░██║██╔══██╗██╔════╝╚██╗██╔╝
██████╔╝███████║██║░░██║╚█████╗░░╚███╔╝░
██╔═══╝░██╔══██║██║░░██║░╚═══██╗░██╔██╗░
██║░░░░░██║░░██║╚█████╔╝██████╔╝██╔╝╚██╗
╚═╝░░░░░╚═╝░░╚═╝░╚════╝░╚═════╝░╚═╝░░╚═╝

Version 0.21.0
Copyright (C) 2025 Alessandro Lussana
Licence Apache 2.0

Command: /home/alussana/Xiv_local/venvs/phosx/bin/phosx -h

usage: phosx [-h] [-yp Y_PSSM] [-stp S_T_PSSM] [-yq Y_PSSM_QUANTILES] [-stq S_T_PSSM_QUANTILES] [-no-uae] [-meta KINASE_METADATA] [-n N_PERMUTATIONS] [-s] [-t] [-stk S_T_N_TOP_KINASES] [-yk Y_N_TOP_KINASES] [-astqth A_LOOP_S_T_QUANTILE_THRESHOLD]
           [-ayqth A_LOOP_Y_QUANTILE_THRESHOLD] [-urt UPREG_REDUNDANCY_THRESHOLD] [-drt DOWNREG_REDUNDANCY_THRESHOLD] [-mh MIN_N_HITS] [-stmq S_T_MIN_QUANTILE] [-ymq Y_MIN_QUANTILE] [-df1 DECAY_FACTOR] [-c N_PROC] [--plot-figures] [-d OUTPUT_DIR] [-nd NETWORK_PATH]
           [-o OUTPUT_PATH] [-v]
           seqrnk

Data-driven differential kinase activity inference from phosphosproteomics data

positional arguments:
seqrnk                Path to the seqrnk file.

options:
-h, --help            show this help message and exit
-yp Y_PSSM, --y-pssm Y_PSSM
                      Path to the h5 file storing custom Tyr PSSMs; defaults to built-in PSSMs
-stp S_T_PSSM, --s-t-pssm S_T_PSSM
                      Path to the h5 file storing custom Ser/Thr PSSMs; defaults to built-in PSSMs
-yq Y_PSSM_QUANTILES, --y-pssm-quantiles Y_PSSM_QUANTILES
                      Path to the h5 file storing custom Tyr kinases PSSM score quantile distributions under the key 'pssm_scores'; defaults to built-in PSSM scores quantiles
-stq S_T_PSSM_QUANTILES, --s-t-pssm-quantiles S_T_PSSM_QUANTILES
                      Path to the h5 file storing custom Ser/Thr kinases PSSM score quantile distributions under the key 'pssm_scores'; defaults to built-in PSSM scores quantiles
-no-uae, --no-upstream-activation-evidence
                      Do not compute upstream activation evidence to modify the activity scores of kinases with correlated activity; default: False
-meta KINASE_METADATA, --kinase-metadata KINASE_METADATA
                      Path to the h5 file storing kinase metadata ("aloop_seq"); defaults to built-in metadata
-n N_PERMUTATIONS, --n-permutations N_PERMUTATIONS
                      Number of random permutations; default: 20000
-s, --ser-thr-only    Only compute Ser/Thr kinases activity; default: False
-t, --tyr-only        Only compute Tyr kinases activity; default: False
-stk S_T_N_TOP_KINASES, --s-t-n-top-kinases S_T_N_TOP_KINASES
                      Number of top-scoring Ser/Thr kinases potentially associatiated to a given phosphosite; default: 5
-yk Y_N_TOP_KINASES, --y-n-top-kinases Y_N_TOP_KINASES
                      Number of top-scoring Tyr kinases potentially associatiated to a given phosphosite; default: 5
-astqth A_LOOP_S_T_QUANTILE_THRESHOLD, --a-loop-s-t-quantile-threshold A_LOOP_S_T_QUANTILE_THRESHOLD
                      Minimum Ser/Thr PSSM score quantile for an activation loop to be considered potential substrate of a kinase; default: 0.95
-ayqth A_LOOP_Y_QUANTILE_THRESHOLD, --a-loop-y-quantile-threshold A_LOOP_Y_QUANTILE_THRESHOLD
                      Minimum Tyr PSSM score quantile for an activation loop to be considered potential substrate of a kinase; default: 0.95
-urt UPREG_REDUNDANCY_THRESHOLD, --upreg-redundancy-threshold UPREG_REDUNDANCY_THRESHOLD
                      Minimum Jaccard index of target substrates to consider two upregulated kinases having potentially correlated activity; upstream activation evidence is used to prioritize the activity of individual ones; default: 0.5
-drt DOWNREG_REDUNDANCY_THRESHOLD, --downreg-redundancy-threshold DOWNREG_REDUNDANCY_THRESHOLD
                      Minimum Jaccard index of target substrates to consider two downregulated kinases having potentially correlated activity; upstream activation evidence is used to prioritize the activity of individual ones; default: 0.5
-mh MIN_N_HITS, --min-n-hits MIN_N_HITS
                      Minimum number of phosphosites associated with a kinase for the kinase to be considered in the analysis; default: 4
-stmq S_T_MIN_QUANTILE, --s-t-min-quantile S_T_MIN_QUANTILE
                      Minimum PSSM score quantile that a phosphosite has to satisfy to be potentially assigned to a Ser/Thr kinase; default: 0.95
-ymq Y_MIN_QUANTILE, --y-min-quantile Y_MIN_QUANTILE
                      Minimum PSSM score quantile that a phosphosite has to satisfy to be potentially assigned to a Tyr kinase; default: 0.90
-df1 DECAY_FACTOR, --decay-factor DECAY_FACTOR
                      Decay factor for the exponential decay of the activation evidence when competing kinases have different activation scores. See utils.decay_from_1(); default: 256
-c N_PROC, --n-proc N_PROC
                      Number of cores used for multithreading; default: 1
--plot-figures        Save figures in pdf format; see also --output_dir
-d OUTPUT_DIR, --output-dir OUTPUT_DIR
                      Output files directory; only relevant if used with --plot_figures; defaults to 'phosx_output/'
-nd NETWORK_PATH, --network-path NETWORK_PATH
                      Output file path for the inferred Kinase-->A-loop network; if not specified, the network will not be saved
-o OUTPUT_PATH, --output-path OUTPUT_PATH
                      Main output table with differential kinase activitiy scores; if not specified it will be printed in STDOUT
-v, --version         Print package version and exit
Input
seqrnk
PhosX's input format is a simple text file that we name seqrnk. It consists of 2 tab-separated columns containing phosphopeptide sequences and values, respectively. The values should be biologically relevant measures of differential phosphorylation, typically intensity log fold changes as obtained when comparing two conditions in mass spectrometry experiments. Amino acid sequences should be of length $10$, with the phosphorylated residue in position $6$ (1-based), in order to match the Position Specific Scoring Matrix (PSSM) models (see Ser/Thr PSSMs & Tyr PSSMs). Undefined amino acids are represented by the character _. Every other residue is represented by the corresponding 1-letter symbol according to the IUPAC nomenclature for amino acids and additional phosphorylated Serine, Threonine or Tyrosine residues are represented with the symbols s, t, and y, respectively. Phosphorylated residues that act as potential priming sites and are therefore not in the $6^{th}$ position of the peptide are represented with lowercase letters. An example is included in this repository:
$ head tests/seqrnk/koksal2018_log2.fold.change.8min.seqrnk

QEEAEYVRAL      5.646644
ANFSAYPSEE      4.33437
YLNRNYWEKK      4.174151
AENAEYLRVA      3.685413
STYTSYPKAE      3.491975
SFLQRYSSDP      3.295341
AAEPGSPTAA      3.202242
EPAHAYAQPQ      3.160899
RQKSTYTSYP      3.114077
ETKSLYPSSE      3.04653
Alongside the main program, this package also installs make-seqrnk. This utily can be used to help generating a seqrnk file given a list of phosphosites, each one identified by a UniProt Acession Number and residue coordinate. make-seqrnk will query the UniProt database to fetch the appropriate subsequences to build the seqrnk file.
Run an example:
cat tests/p_list/15_3.tsv | make-seqrnk > 15_3.seqrnk
See `make-seqrnk -h` for more details:
usage: make-seqrnk [-h] [-i INPUT] [-o OUTPUT]

Make a seqrnk file to be used to compute differential kinase activity with PhosX

options:
  -h, --help            show this help message and exit
  -i INPUT, --input INPUT
                        Path of the input phosphosites to be converted in seqrnk format. It should be a TSV file where the 1st column is the UniProtAC (str), the 2nd is the sequence coordinate (int), and the 3rd is the logFC (float); defaults to STDIN
  -o OUTPUT, --output OUTPUT
                        Path of the seqrnk file; if not specified it will be printed in STDOUT
PSSMs
PhosX estimates the affinity between human kinases and phosphopeptides based on the substrate sequence specificity encoded in Position Specific Scoring Matrices (PSSMs). A kinase PSSM is a $10 \times 23$ matrix containing amino acid affinity scores at each one of the $10$ positions of the substrate. The 6\textsuperscript{th} position corresponds to the modified residue and should have non-$0$ values only for Serine, Threonine (for Ser/Thr kinases), or Tyrosine (for Tyr kinases) residues.
PhosX comes with built-in, default PSSMs for human kinases, that can be found at phosx/data/*_PSSMs.h5. The user can also run PhosX using custom PSSMs, whose path can be specified with the options -yp and -stp.
Open and inspect the structure of the HDF5 files containing the PSSMs
import phosx
import pandas as pd
import h5py


AA_LIST = [
  "G","P","A","V","L","I",
  "M","C","F","Y","W","H",
  "K","R","Q","N","E","D",
  "S","T","s","t","y",
]


POSITIONS_LIST = list(range(-5, 5))


s_t_pssms_h5_file = f"{os.path.dirname(phosx.__file__)}/data/S_T_PSSMs.h5"
y_pssms_h5_file = f"{os.path.dirname(phosx.__file__)}/data/Y_PSSMs.h5"


def read_pssms(pssms_h5_file: str):

    pssms_h5 = h5py.File(pssms_h5_file, "r")
    pssm_df_dict = {}

    for kinase in pssms_h5.keys():
        pssm_df_dict[kinase] = pd.DataFrame(pssms_h5[kinase])
        pssm_df_dict[kinase].columns = AA_LIST
        pssm_df_dict[kinase].index = POSITIONS_LIST

    return pssm_df_dict


if __name__ == "__main__":
    s_t_pssms = read_pssms(s_t_pssms_h5_file)
    y_pssms = read_pssms(y_pssms_h5_file)
Background PSSM score distributions
Similarly, PhosX also has built-in kinase PSSM scores quantile distributions computed on a reference human phosphoproteome from the PhosphositePlus database. These can be found at phosx/data/*_PSSM_score_quantiles.h5. When supplying custom PSSMs, it is necessary to also specify the appropriate background distributions with the options -yq and -stq.
Open and inspect the HDF5 files containing the background PSSM scores
import phosx
import pandas as pd
import os


s_t_pssm_score_quantiles_h5_file = f"{os.path.dirname(phosx.__file__)}/data/S_T_PSSM_score_quantiles.h5"
y_pssm_score_quantiles_h5_file = f"{os.path.dirname(phosx.__file__)}/data/Y_PSSM_score_quantiles.h5"


def read_pssm_score_quantiles(pssm_score_quantiles_h5_file: str):
    pssm_bg_scores_df = pd.read_hdf(pssm_score_quantiles_h5_file, key="pssm_scores")
    return pssm_bg_scores_df


if __name__ == "__main__":
    s_t_pssm_score_quantiles = read_pssm_score_quantiles(s_t_pssm_score_quantiles_h5_file)
    y_pssm_score_quantiles = read_pssm_score_quantiles(y_pssm_score_quantiles_h5_file)
Kinases metadata
While keeping a fully data-driven inference, PhosX can benefit from kinase sequence information. For each kinase, the activation loop (A-loop) sequence of the kinase domain, if present, is used to enable the assessment of the upstream activation evidence associated to that kinase, and consequently compute the final differential activity scores. This step can substantially improve the inference accuracy, as observed in the benchmark.
Built-in A-loop sequences are supplied in a dictionary saved under the key "aloop_seq" of the metadata HDF5 file, found at phosx/data/kinase_metadata.h5. This file could be expanded to also contain different types of metadata in future versions.
It is possible to pass custom A-loop sequences by specifying a suitable .h5 metadata file with the command line option -meta.
Open and inspect the HDF5 file containing the A-loop sequences
import phosx
import pandas as pd
import os


metadata_h5_file = f"{os.path.dirname(phosx.__file__)}/data/kinase_metadata.h5"


def read_aloops(metadata_h5_file):
    kinase_metadata_dict = phosx.utils.hdf5_to_dict(metadata_h5_file)
    aloop_df = pd.DataFrame.from_dict(
        kinase_metadata_dict["aloop_seq"], orient="index", columns=["Sequence"]
    )
    return aloop_df


if __name__ == "__main__":
    aloop_df = read_aloops(metadata_h5_file)
Output
Differential kinase activity score
PhosX's main output is a text file reporting the computed kinase activities with associated statistics as described in the Method section. For each kinase, the KS statistics, the p value, the FDR q value, and the Activity Score are reported. Kinases for which a differential activity could not be computed due to a low number of assigned phosphosites (see option -mh MIN_HITS) are reported as having Activity Score = NA. See an output example from the command executed above:
head kinase_activities.tmp
        KS      p value FDR q value     Legacy Activity Score   Activity Score
ACVR2A  0.23331 0.42765 0.46032 0.36891 0.36891
ACVR2B  0.45501 0.0234  0.13606 1.63078 1.63078
ALK2    0.25047 0.37085 0.44217 0.4308  0.4308
ALK4    -0.35766        0.1498  0.27011 -0.82449        -0.82449
ALPHAK3 -0.2778 0.3989  0.45131 -0.39914        -0.39914
AMPKA2  0.44011 0.28485 0.39076 0.54538 0.54538
ATM     -0.51674        0.10205 0.22279 -0.99119        -0.99119
ATR     -0.49195        0.13305 0.25339 -0.87599        -0.87599
AURA    0.64746 0.09635 0.22279 1.01615 1.01615
Statistics plots
Additionally, PhosX can also save plots of the weighted running sum and of the KS statistic compared to its empirical null distribution, similarly to the ones shown above, for each kinase. To enable this behavior the option --plot-figures must be specified. A custom directory to save the plots can be passed with -d.
Kinase $\rightarrow$ A-loop network
A kinase-kinase network, where directed edges represent the potential of a source node to phosphorylate the A-loop of a target node, is inferred as part of evauating the upstream activation evidence. After a PhosX run, such network can be saved on disk by specifying path with the commad line argument --network-path. See an output example generated by running:
phosx -c 4 --network-path aloop_network.tsv tests/seqrnk/koksal2018_log2.fold.change.8min.seqrnk > kinase_activities.tmp`
head aloop_network.tsv
source  target  complementarity source_activity_score   target_activity_score
ACVR2A  LATS1   1.0     0.35694 0.56543
ACVR2A  LATS2   1.0     0.35694 0.66474
ACVR2A  MARK1   1.0     0.35694 -1.43415
ACVR2A  MARK2   1.0     0.35694 -1.22475
ACVR2A  MARK3   1.0     0.35694 -0.91593177
ACVR2A  MARK4   1.0     0.35694 -1.19382
ACVR2A  NLK     1.0     0.35694 1.79588
ACVR2A  PINK1   1.0     0.35694 0.62051
ACVR2A  BLK     0.98    0.35694 -2.4437
Method
Phosphopeptide scoring
For each kinase PSSM, a score is assigned to each phosphopeptide sequence $S$ that quantifies its similarity to the PSSM. First, a "raw PSSM score" is computed as:
\texttt{score}(S,k) := \prod_{i=-5}^{4}
\begin{cases}
    M^{k}_{i,S_i}, & \text{if } S_i \neq \texttt{'\_'} \\
    1, & \text{if } S_i = \texttt{'\_'}
\end{cases}
where $S_i$ is the amino acid residue at position $i$ of the phosphopeptide sequence $S$; $M^k_{i,j}$ is the value of the PSSM for kinase $k$ at position $i$ for residue $j$. Raw PSSM scores for each kinase are then transformed between $0$ and $1$ based on the quantile they fall in, considering a background distribution of proteome-wide raw PSSM scores. For each kinase, phosphopeptides with raw PSSM score equal to $0$ are discarded, and the remaining are used to determine the values of the $10,000$-quantiles of the raw PSSM score distribution. The background $10,000$-quantiles raw PSSM scores for each kinase PSSM are used to derive the final PSSM scores for each phosphopeptide.
Weighted running sum statistics
PhosX uses the PSSM scores to link kinases to their potential substrates. Each phosphopeptide is assigned as potential target to its $n$ top-scoring kinases, with default value of $10$. With the method has little sensitivity to this parameter in the range $[5,15]$. The activity change of a given kinase is estimated by calculating a running sum statistic over the ranked list of phosphosites, and by estimating its significance based on an empirical distribution generated by random permutations of the ranks. Let $C$ be the set of indexes corresponding to the ranked phosphosites associated with kinase $k$; $N$ the total number of phosphosites; $N_h$ the size of $C$; $r_i$ the value of the ranking metric of the phosphosite at rank $i$, where $r_0$ is the highest value. Then, the running sum ($RS$) up to the phosphosite rank $n$ is given by
RS(k,n) := \sum_{i=0}^{n}
\begin{cases}
    \frac{|r_i|}{N_R}, & \text{if } i \in C \\
    -\frac{1}{N - N_h}, & \text{if } i \not\in C
\end{cases}
where
N_R = \sum_{i \in C} |r_i|
The kinase enrichment score ($ES$) corresponds to the maximum deviation from $0$ of $RS$.
Empirical p values
For each kinase, PhosX computes an empirical p value of the $ES$ by generating a null distribution of the $ES$ through random permutations of the phosphosite ranks. A False Discovery Rate (FDR) q value is also calculated by applying the Benjamini-Hochberg procedure considering the number of kinases independently tested. The number of permutations is a tunable parameter but we recommend performing at least $10^4$ random permutations to be able to compute FDR values $< 0.05$.
Differential activity scores
The activity score (before correction based on the upstream activation evidence) for a given kinase $i$ is defined as:
a_i = -\log_{10}{\left(p_i\right)} \cdot \texttt{sign}\left(ES_i\right)
where $\texttt{sign}$ is the sign function, and $p_i$ is the p value associated with kinase $i$, capped at the smallest computable p value different from $0$, i.e. the inverse of the number of random permutations. Activity scores greater than $0$ denote kinase activation, while the opposite corresponds to kinase inhibition.
Upstream activation evidence
Kinases that are more closely evolutionarily related tend to have more similar PSSMs, leading to a correlation in their inferred differential activities which might not be biologically real. PhosX attempts to find these instances in any given experiment and discriminate the truly differentially active kinases from the ones whose activity is falsely correlated with them.
In doing so, PhosX first builds a directed network of kinases to represent the potential of each kinase to phosphorylate the activation loop (A-loop) of any other except itself. Edges are inferred based on the same PSSM score logic used to link the phosphosites to the putative upstream kinases, except that the maximum score is taken by sliding a PSSM over each possible position along an A-loop.
If kinases have highly overlapping sets of assigned phosphosites in the experiment, and also a similar differential activity score, then their activity changes are considered to be potentially correlated mostly because of PSSM similarity. In order to prioritize a putative "true" regulated kinase between those candidates, we look for other kinases that target the A-loops of the candidates. The inferred differential activity of such upstream kinases is treated as evidence for the regulation of their downstream targets. If such evidence supports the activity of a specific kinase, then the activity change of the other candidates is dampened down, reducing the false positive rate of identifying differentially regulated kinases.
The logic above is implemented in PhosX using the following procedure, which is applied separately to kinases that are inferred to be upregulated ($a_i > 0$) or downregulated ($a_i < 0$). For the downregulated kinases we take the absolute value of their activity score and then negate the final modified score.
Let $a$ be the activity vector of the kinases. If we are considering upregulated kinases, each $a_i$ is the Activity Score of kinase $i$ if $a_i > 0$, otherwise we assign a "pseudo-null" activity, setting $a_i=0.01$. If we are considering downregulated kinases, we first take the opposite of the Activity Scores and then modify $a$ analogously. Let $a'$ be the vector where each element $a' i$ is the reciprocal of $a_i$; $A$ the diagonal matrix of $a$; $D^T$ the transposed adjacency matrix of the directed kinase network, i.e. a Boolean matrix indicating for each kinase which other kinases may target its A-loop; $C$ the redundancy matrix, a Boolean matrix indicating for each kinase which other kinases have an extensive overlap of substrates and therefore a potentially correlated activity. By default $C{ij}=1$ if the phosphosites assigned to kinases $i$ and $j$ in the experiment have a Jaccard Index $J > 0.5$.
We compute $E = D^T \cdot A$, which is the activation evidence matrix, indicating for each kinase the activation coming from every other kinase.
We then obtain $e$, the evidence vector, as the row-wise maximum of $E$, containing the upstream activation evidence of each kinase. Let $e'$ be a vector where each element $e'_i$ is the reciprocal of $e_i$.
Eventually, we want to modify $a_i$ (the activity of a kinase $i$) proportionally to:
m_{ij} = 1 - \left\{ C_{ij} \cdot \left(1 - \frac{e_i}{e_j} \right) \cdot \exp\left[ -d \left( \frac{a_i}{a_j} \right)^2 \right] \right\}
for whatever kinase $j$ gives the minimum $m_{ij}$, and where $d \in \N$ is the decay factor. $d=64$ by default, and controls how fast $\exp [ -d ( a_i/a_j)^2 ]$ decays from 1 to 0 as $a_i / a_j$ becomes different from $1$.
Namely, we want to disregard the differential activity of kinase $i$ only if kinase $j$ is potentially correlated ($C_{ij} = 1$), and if kinase $i$ and $j$ have similar inferred activities (i.e. $a_i/a_j$ is close to $1$), by a degree that is greater when the upstream activation evidence of the kinase $i$ is smaller than the one of kinase $j$ (i.e. $e_i/e_j$ is small).
Before applying this formula, we need to consider some cases regarding the value of $e_i / e_j$:
- $0 > e_i/e_j < 1$, no change is needed;
- $e_j=0 \implies e_i/e_j = inf$, the competing kinase has no upstream activation evidence, we set $e_i / e_j= 1$ (leading to $m_{ij} = 1$ );
- $e_i=0 \land e_j=0 \implies e_i/e_j$ is undefined, both kinases have no upstream activation evidence, we set $e_i / e_j= 1$ (leading to $m_{ij} = 1$ );
- $e_i/e_j \ge 1$, the upstream activation evidence of kinase $i$ is greater than kinase $j$, therefore we don't want to correct $a_i$ and we set $e_i / e_j= 1$ (leading to $m_{ij} = 1$ ).
We can then obtain $F = ee'^T$, the outer product of the evidence vector and its reciprocal, containing the ratio of upstream evidences for each kinase pair. To the elements of $F$ the conditional transformations above have been applied.
Let also be $B = aa'^T$, the outer product of the activity vector and its reciprocal, containing the ratio of inferred activities for each kinase pair; and $X = \exp ( -d B^2 )$, a matrix of values between $0$ and $1$ indicating how similar the inferred activity changes of any two kinases are.
We can then rewrite the equation for $m_{ij}$ more simply as:
m_{ij} = 1 - \left\{ C_{ij} \cdot \left(1 - F_{ij} \right) \cdot X_{ij} \right\}
Therefore to find all possible $m_{ij}$ and then, for each $i$, select for the minimum, we first compute the matrix $M$:
M = 1 - \left\{ C \circ \left(1 - F \right) \circ X \right\}
and then get $z$, the activity modifier vector indicating the modifier factor for each kinase, by taking the row-wise minimum of $M$.
Lastly, we set $z_i=1$ for each kinase $i$ that doesn't have a regulatory A-loop. Only the differential activity of kinases that have an A-loop reported in the metadata will be modified, as only their activities are assumed to depend on such a regulatory feature.
The final kinase differential activity scores are given by $a \circ z$.
Cite
Please cite one of the following references if you use PhosX in your work.
Bioinformatics
BibTeX:
@article{10.1093/bioinformatics/btae697,
    author = {Lussana, Alessandro and Müller-Dott, Sophia and Saez-Rodriguez, Julio and Petsalaki, Evangelia},
    title = {PhosX: data-driven kinase activity inference from phosphoproteomics experiments},
    journal = {Bioinformatics},
    volume = {40},
    number = {12},
    pages = {btae697},
    year = {2024},
    month = {11},
    issn = {1367-4811},
    doi = {10.1093/bioinformatics/btae697},
    url = {https://doi.org/10.1093/bioinformatics/btae697},
    eprint = {https://academic.oup.com/bioinformatics/article-pdf/40/12/btae697/60972735/btae697.pdf},
}
BioRxiv
BibTeX:
@article{Lussana2024,
  title = {PhosX: data-driven kinase activity inference from phosphoproteomics experiments},
  url = {http://dx.doi.org/10.1101/2024.03.22.586304},
  DOI = {10.1101/2024.03.22.586304},
  publisher = {Cold Spring Harbor Laboratory},
  author = {Lussana,  Alessandro and Petsalaki,  Evangelia},
  year = {2024},
  month = mar
}
1 maintainer

Metadata
1 maintainer
Release files for phosx 0.21.0
For a detailed explanation of source distributions (sdists) and built distributions (wheels), please see the package formats documentation.
Source distribution (sdist)
| File | Size | Uploaded | |
|---|---|---|---|
| phosx-0.21.0.tar.gz | 31.9 MB | Details |
Built distribution (wheel)
| File | Interpreter | ABI | Platform | Reset |
|---|---|---|---|---|
| phosx-0.21.0-py3-none-any.whl | Python 3 | none | any | Details |
Total release size: 63.7 MB
Release files / phosx-0.21.0.tar.gz
| Download URL | phosx-0.21.0.tar.gz |
|---|---|
| Size | 31.9 MB |
| Tags | Source |
|
SHA-256 checksum How to use checksums |
acc24e6039f7ae1e65f0104aad406a433879fe974ea4789fb3356d5e7b301fe8
|
|
BLAKE2b-256 checksum How to use checksums |
4084301ca13ff46a3a4be7052fb48e06b761bed7056e64c7561327948152b799
|
| Upload date | |
|
Uploaded using Trusted Publishing? What is trusted publishing? |
No |
| Uploaded via |
twine/6.1.0 CPython/3.13.12
|
Release files / phosx-0.21.0-py3-none-any.whl
| Download URL | phosx-0.21.0-py3-none-any.whl |
|---|---|
| Size | 31.9 MB |
| Tags | Python 3 |
|
SHA-256 checksum How to use checksums |
4ccf19fc1c4ea30e6bc253580172a6114a7ad534acc799f5a07dfe2f3be2e384
|
|
BLAKE2b-256 checksum How to use checksums |
5e52ed345927b3238617753340e65e97e32c57df649e37098c3f81e51eb5ca05
|
| Upload date | |
|
Uploaded using Trusted Publishing? What is trusted publishing? |
No |
| Uploaded via |
twine/6.1.0 CPython/3.13.12
|














