
PhyloCartoPlot
PhyloCartoPlot is a Python package for linked visualization of phylogenetic trees and geographic occurrence data. It connects taxa displayed in a phylogenetic tree to their geographic locations on a map and can optionally incorporate raster environmental data.
The package is intended for reproducible phylogeographic and biodiversity visualization workflows using standard formats such as Newick trees, CSV occurrence data, and GeoTIFF rasters.
Features
PhyloCartoPlot provides tools to:
- format GBIF occurrence data for downstream analysis;
- attach trait or environmental metadata to occurrence records;
- construct phylogenetic trees from aligned sequence data;
- display phylogenetic trees alongside geographic occurrence maps;
- link tree tips to mapped occurrence points;
- apply consistent trait-based color encoding across tree and map components;
- optionally display environmental raster data;
- export publication-quality figures in multiple formats.
Installation
PhyloCartoPlot is available from PyPI:
pip install phylocartoplot
PhyloCartoPlot requires Python 3.10 or later.
Main dependencies include:
- Biopython
- Cartopy
- Rasterio
- Matplotlib
- Pandas
- NumPy
- scikit-image
These dependencies are installed automatically by pip.
Basic workflow
A typical workflow consists of preparing occurrence data, optionally adding metadata, building or loading a phylogenetic tree, and generating the linked tree-map visualization.
1 – Format GBIF occurrence data
python -m phylocartoplot.preprocessing.format_gbif_data \
    gbif_occurrences.csv \
    node_names.csv
2 – Add trait metadata
python -m phylocartoplot.preprocessing.add_metadata \
    gbif_occurrences_formatted.csv \
    trait_metadata.csv
3 – Build a phylogenetic tree
python -m phylocartoplot.preprocessing.build_phylogenetic_tree \
    sequences.fasta
4 – Visualize the phylogeny and geographic data
from phylocartoplot.visualisation.tree_to_map_raster import PhyloCartoPlotter

plotter = PhyloCartoPlotter(
    nwk_file="sequences_tree.nwk",
    gps_file="coordinates.csv",
    offset_file="offsets.csv",
    raster_file="enviro.tif",
    raster_band=1,
)

plotter.plot()
plotter.save(output_dir="output")
Raster input is optional. PhyloCartoPlot can also generate linked phylogenetic and geographic visualizations without an environmental raster.
Input data
PhyloCartoPlot works with standard biological and geospatial data formats.
Phylogenetic tree
Phylogenetic trees are supplied in Newick (.nwk) format.
Trees may be generated externally or created from aligned sequence data using:
python -m phylocartoplot.preprocessing.build_phylogenetic_tree sequences.fasta
Geographic occurrence data
Geographic occurrence data are supplied as CSV files containing taxon or specimen identifiers and geographic coordinates.
GBIF occurrence exports can be reformatted using:
python -m phylocartoplot.preprocessing.format_gbif_data
Trait metadata
Additional quantitative traits can be associated with occurrence records and represented using a continuous color scale in the visualization.
Examples include:
- caffeine concentration;
- environmental measurements;
- morphological traits;
- ecological measurements.
Raster data
Environmental raster data can be supplied as GeoTIFF files.
Examples include:
- elevation;
- precipitation;
- temperature;
- vegetation indices;
- other continuous environmental variables.
Raster support is provided through Rasterio.
Trait-based visualization
PhyloCartoPlot can apply the same trait-based color encoding to phylogenetic elements, mapped occurrences, and connecting lines.
This allows phylogenetic relationships, geographic distributions, and quantitative traits to be examined together within a single figure.
Example datasets and walkthroughs
Complete walkthrough notebooks and sample datasets are available in the GitHub repository:
PhyloCartoPlot GitHub repository
The repository currently includes two principal use cases.
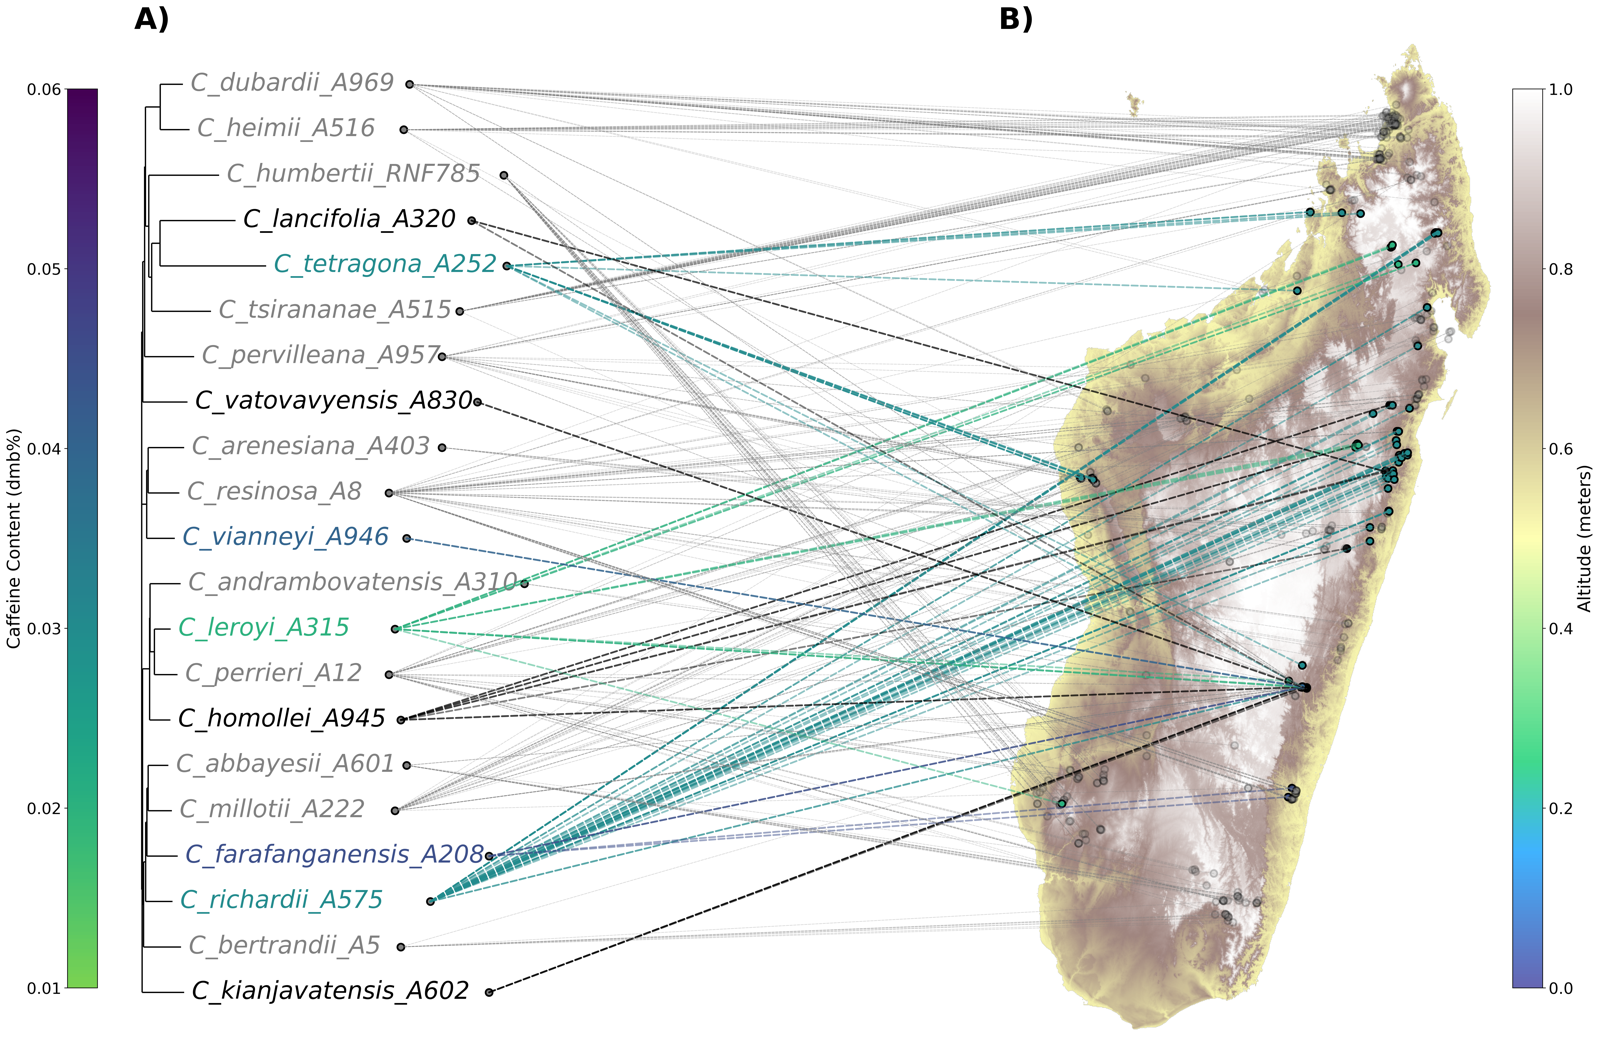
Use case 1 – Malagasy Coffea
This example links a phylogenetic tree of Malagasy Coffea taxa to specimen occurrence records in Madagascar.
Trait values such as caffeine concentration can be represented using a continuous color scale, and environmental raster layers can be included in the geographic panel.
Example notebooks:
Sample data are available under:
examples/sample_data/use_case_1/
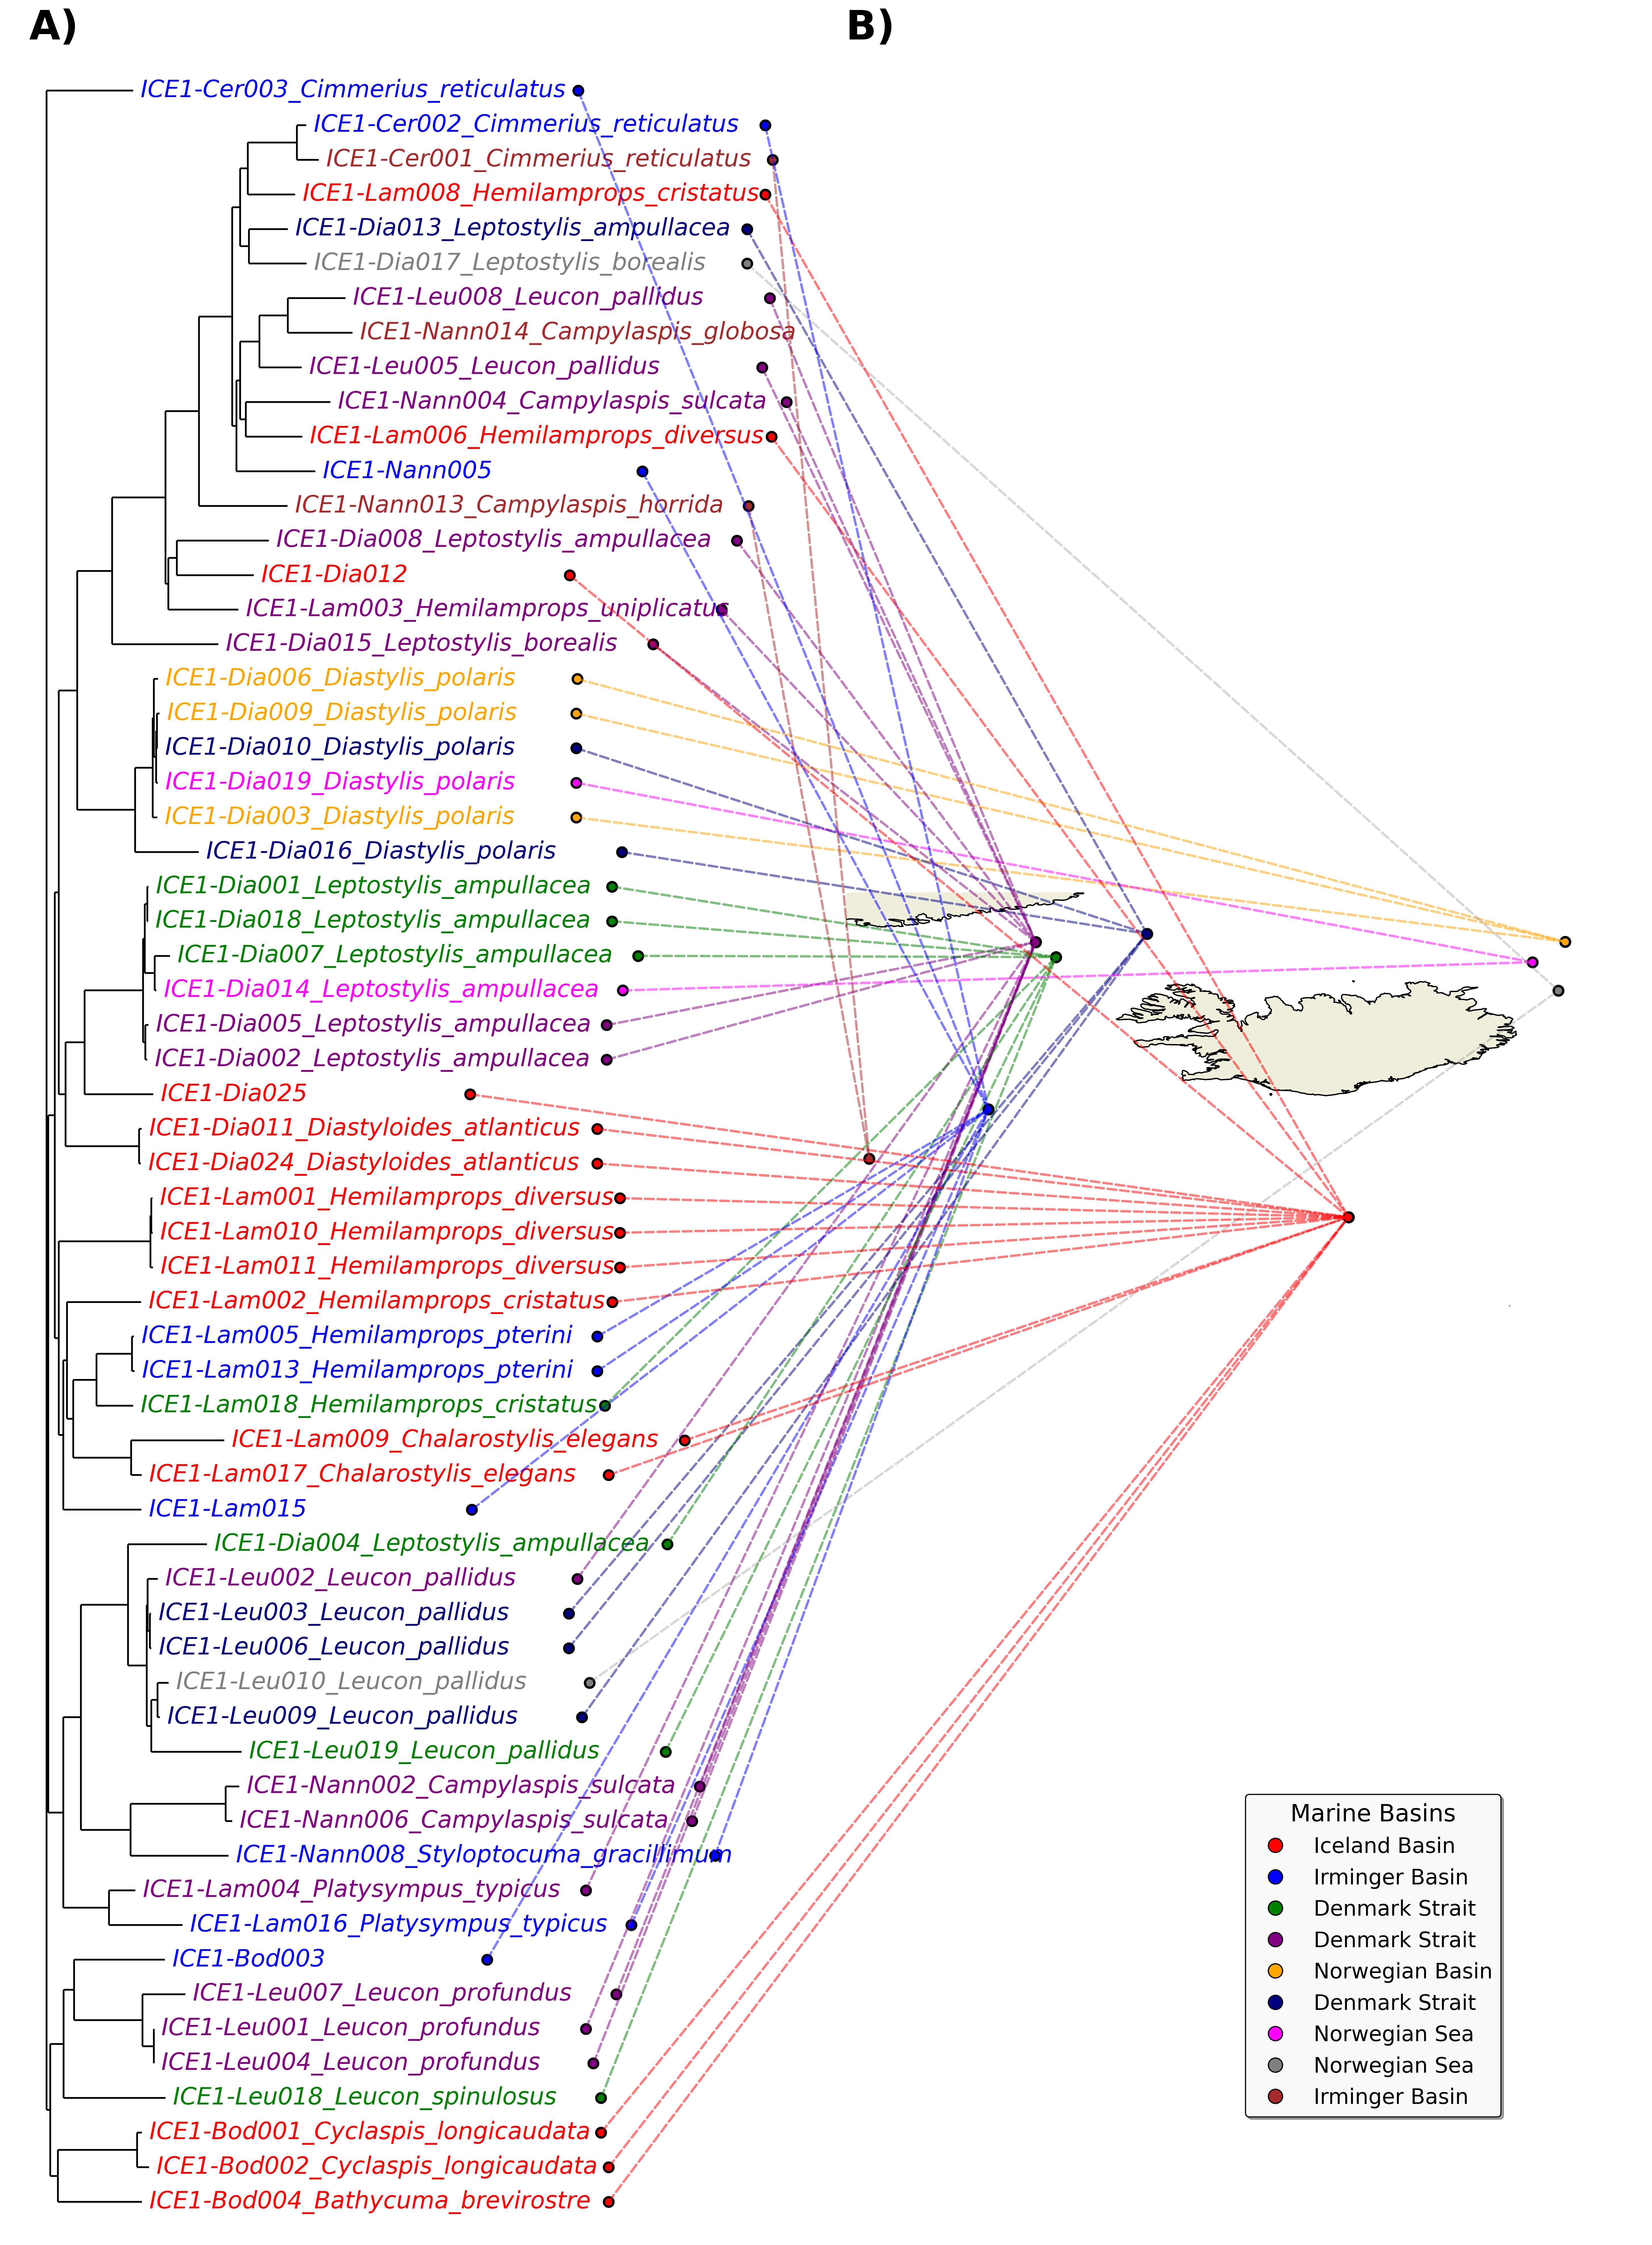
Use case 2 – North Atlantic Cumacea
This example illustrates linked phylogenetic and geographic visualization for Cumacea taxa distributed across North Atlantic regions.
Example notebook:
Sample data are available under:
examples/sample_data/use_case_2/
Running the repository examples
The example datasets and notebooks are maintained in the GitHub repository and are not bundled into the PyPI installation.
To reproduce the examples, clone the repository:
git clone https://github.com/tahiri-lab/PhyloCartoPlot.git
cd PhyloCartoPlot
Install the package in editable mode with the development dependencies:
pip install -e ".[dev]"
The example files can then be accessed under:
examples/
├── sample_data/
│   ├── use_case_1/
│   └── use_case_2/
├── use_case_1/
└── use_case_2/
For example:
python -m phylocartoplot.preprocessing.format_gbif_data \
    examples/sample_data/use_case_1/gbif_coffea_ex3.csv \
    examples/sample_data/use_case_1/node_names.csv
Output
PhyloCartoPlot can generate linked phylogeny-map figures in formats suitable for exploratory analysis and publication.
Depending on the selected options, output may include:
- SVG;
- PNG;
- PDF.
Output files can be written to a user-specified directory:
plotter.save(output_dir="output")
Development installation
For development or contribution, clone the repository:
git clone https://github.com/tahiri-lab/PhyloCartoPlot.git
cd PhyloCartoPlot
Install the package with development dependencies:
pip install -e ".[dev]"
Development dependencies currently include:
- pytest
- Jupyter
Tests
The project includes automated tests for preprocessing and visualization components.
Run the test suite with:
python -m pytest -v
The current test suite covers:
- metadata integration;
- GBIF data formatting;
- phylogenetic tree construction;
- visualization initialization;
- trait color mapping;
- raster configuration;
- plotting;
- figure export.
Project structure
The main Python package is organized as:
phylocartoplot/
├── preprocessing/
│   ├── add_metadata.py
│   ├── build_phylogenetic_tree.py
│   ├── format_gbif_data.py
│   └── prepare_data.py
│
└── visualisation/
    └── tree_to_map_raster.py
Example data, notebooks, workflow documentation, and figures are maintained separately in the GitHub repository.
Repository resources
Additional project resources are available on GitHub:
Citation
If you use PhyloCartoPlot in a scientific publication, please cite the associated software publication when available.
Citation information will be added here following publication.
License
PhyloCartoPlot is distributed under the MIT License.
See the LICENSE file for details.
Author
Caroline Fortier
Repository
Source code, examples, issues, and development history are available at:
https://github.com/tahiri-lab/PhyloCartoPlot
Contributing
Bug reports, feature requests, and contributions are welcome through the GitHub repository.
1 maintainer

Download files
Download the file for your platform. If you're not sure which to choose, learn more about installing packages.
Source Distribution
Built Distribution
Filter files by name, interpreter, ABI, and platform.
If you're not sure about the file name format, learn more about wheel file names.
Copy a direct link to the current filters
File details
Details for the file phylocartoplot-0.1.5.tar.gz.
File metadata
- Download URL: phylocartoplot-0.1.5.tar.gz
- Upload date:
- Size: 26.8 kB
- Tags: Source
- Uploaded using Trusted Publishing? No
- Uploaded via:
twine/7.0.0 CPython/3.12.6
File hashes
| Algorithm | Hash digest | |
|---|---|---|
| SHA256 |
dddb36874ef59180772513dca5ccf991eb7d895e6c4693379310a8fc89e4818e
|
|
| MD5 |
bbfd68ff3ff46d146003f57f52bb043d
|
|
| BLAKE2b-256 |
e8a04dece21de176f766b075a0efbb765b44fdb41c1cb83a615a1430cb6634f2
|
File details
Details for the file phylocartoplot-0.1.5-py3-none-any.whl.
File metadata
- Download URL: phylocartoplot-0.1.5-py3-none-any.whl
- Upload date:
- Size: 20.1 kB
- Tags: Python 3
- Uploaded using Trusted Publishing? No
- Uploaded via:
twine/7.0.0 CPython/3.12.6
File hashes
| Algorithm | Hash digest | |
|---|---|---|
| SHA256 |
fd6fcdff9999de82b90bd4cad87bb9433940546da551e85434bbd19dbf5f9151
|
|
| MD5 |
c3ef588a24df7602fcd9c125a6445e4a
|
|
| BLAKE2b-256 |
6383637279c3c848099dad0de99ad9fe2adc484e0dd4db64788cf5ad921c5daa
|














