
Phylustrator
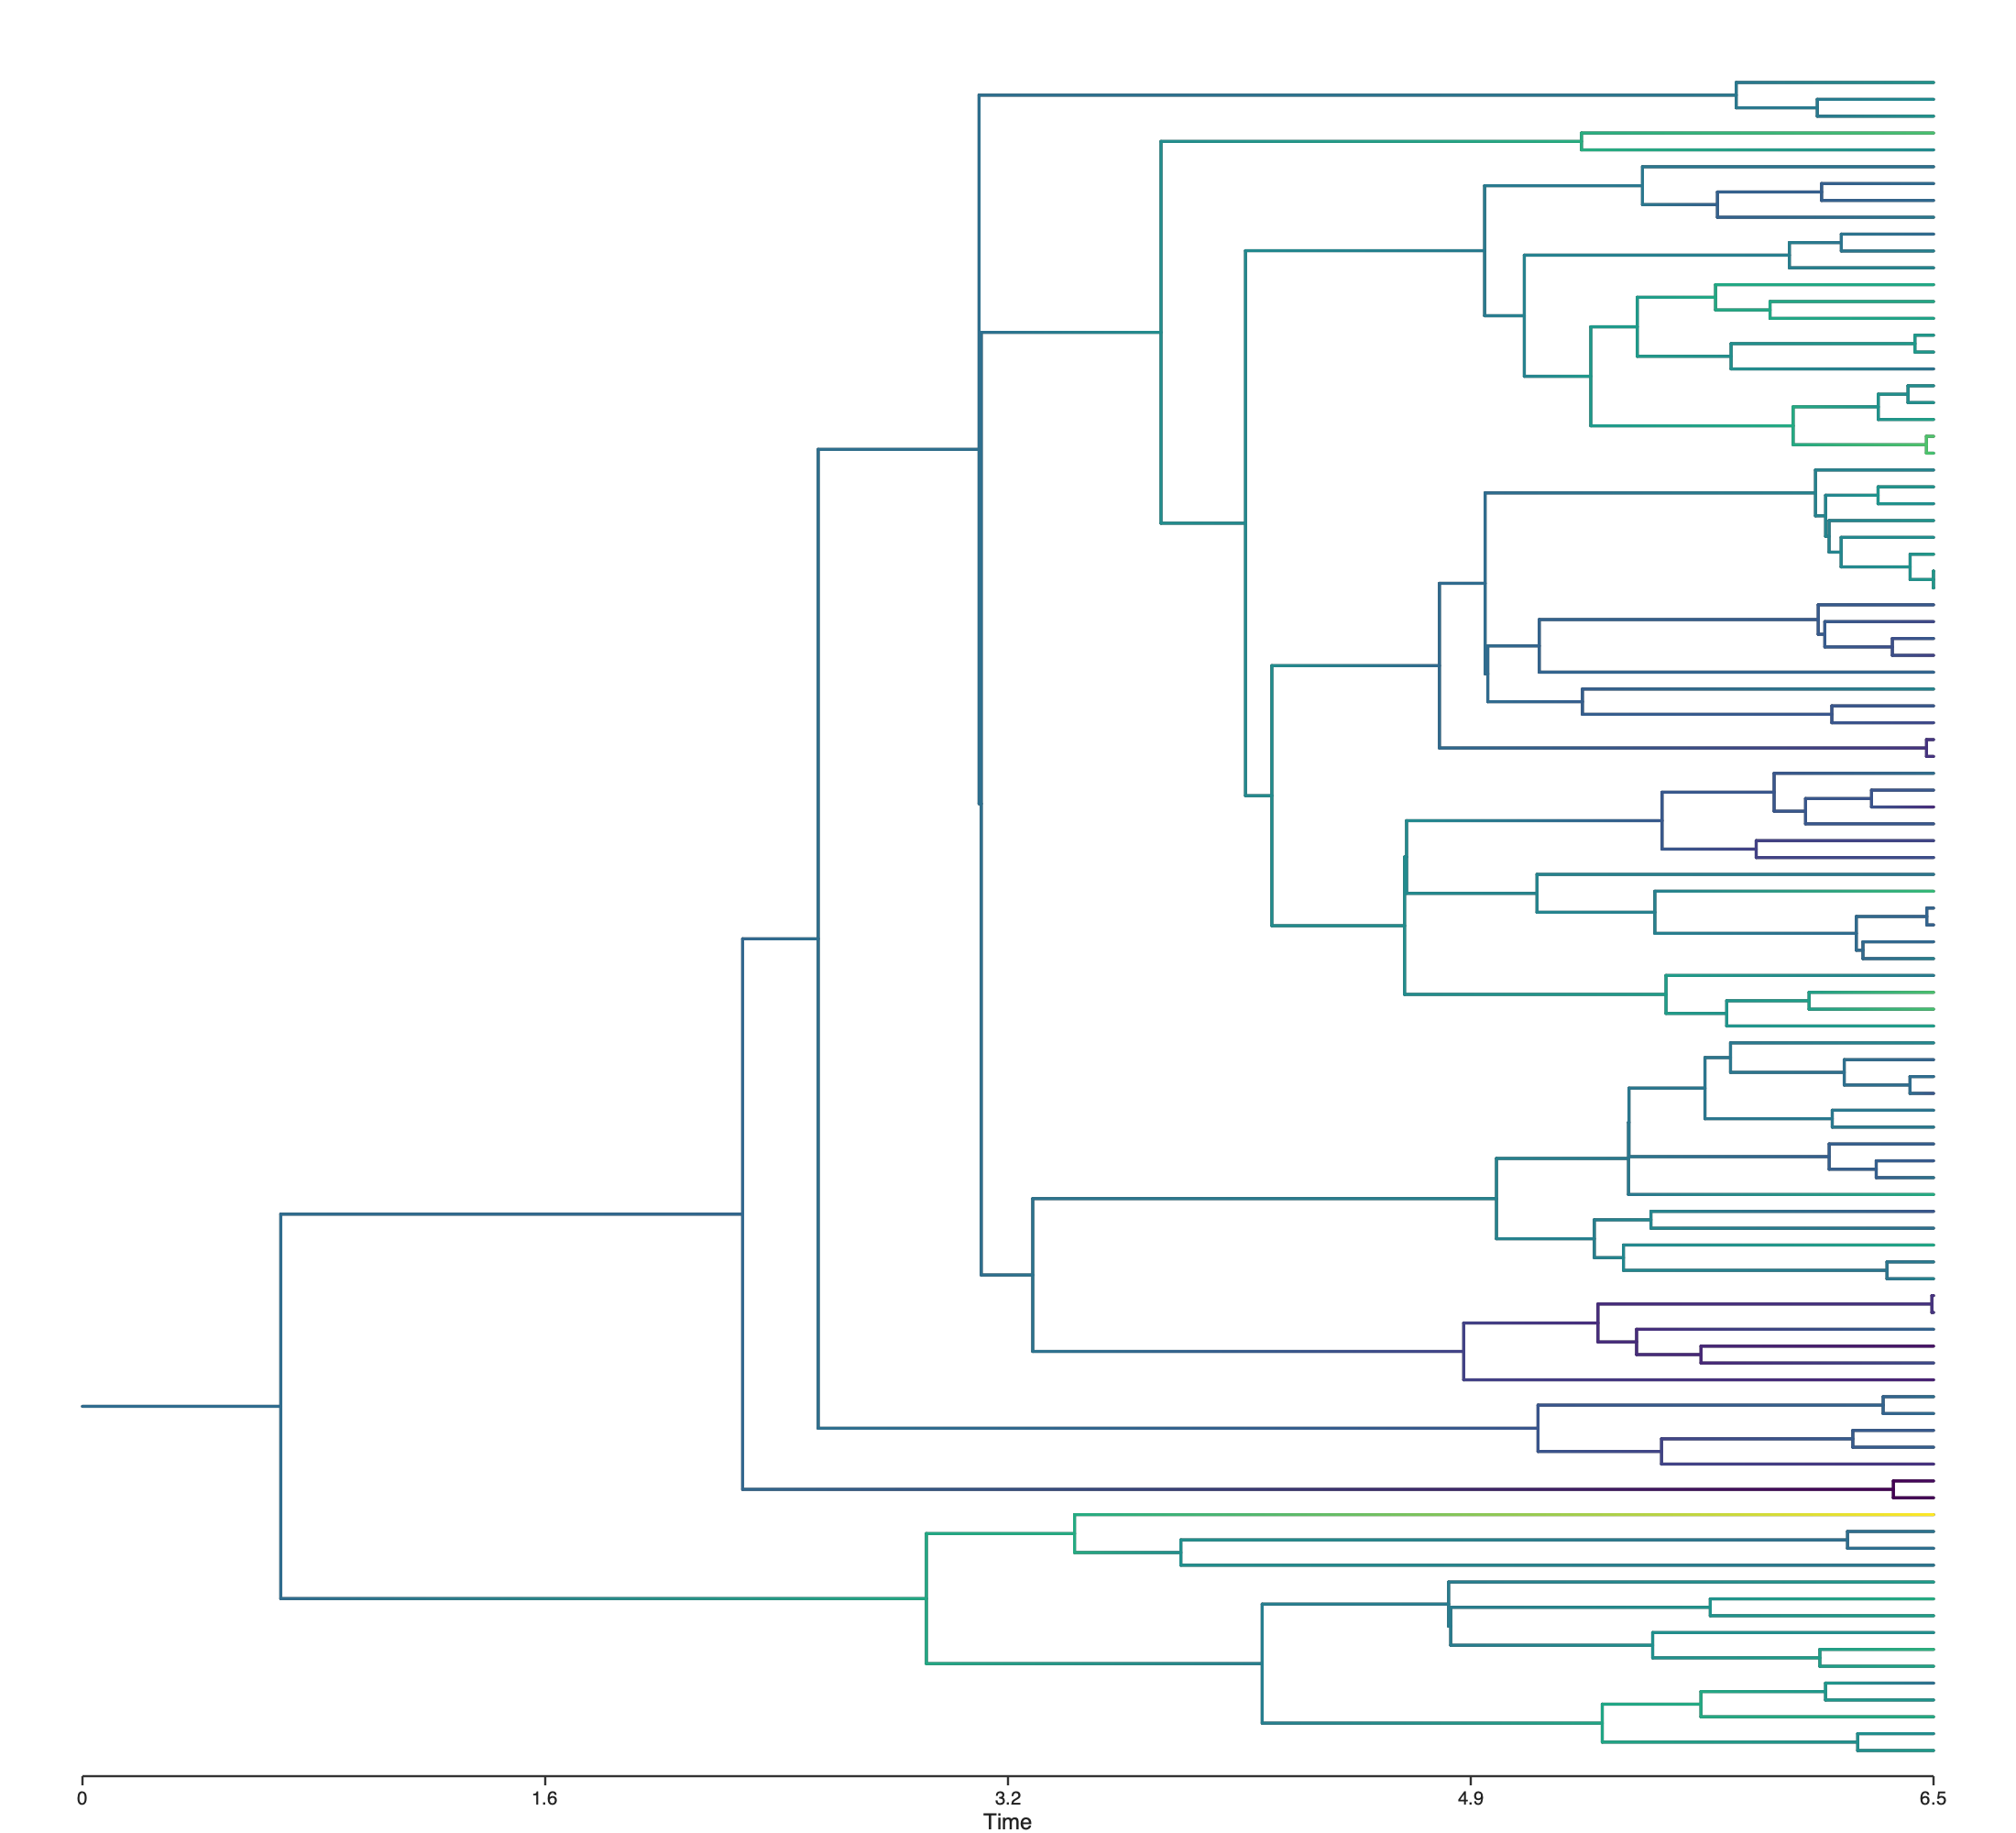
A small, composable plotter for evolutionary figures. Two domains share one grammar: ph.trees
plots phylogenetic trees and ph.genomes plots genomes, synteny and alignments. Start a figure,
add layers with +, and save it to SVG, PDF, or PNG.
Install
pip install git+https://github.com/AADavin/Phylustrator
SVG output needs nothing else; for PDF/PNG also install cairosvg (pip install cairosvg).
Trees
import phylustrator as ph

tree = ph.trees.loads("((((Human:6,Chimp:6)a:2,Gorilla:8)b:3,Orang:11)c:5,Gibbon:16)root;")
brain = {"Human": 1350, "Chimp": 400, "Gorilla": 500, "Orang": 400, "Gibbon": 100,
         "a": 650, "b": 560, "c": 500, "root": 470}

(ph.trees.plot(tree)
 + ph.trees.color_branches(brain)
 + ph.trees.tip_labels()
 + ph.trees.colorbar("brain size (cc)")
 + ph.trees.time_axis("million years")).save("tree.png")
That is the whole idea: plot(tree) starts a figure and each + layer adds one decoration.
- Layouts —
rectangular(default),radial,unrooted. - Layers —
color_branches,color_history,tip_labels,node_labels,tip_track,branch_events,branch_spindles,node_halves,colorbar,legend,time_axis,time_marker,scale_bar,note,title,highlight_clade,highlight_lineage.legendandnotetake a corner;titleis centred over the panel.branch_spindlesmarks a branch with a lens that fades into the branch's own colour, andnode_halvesputs a two-colour disc on a node. An event given tobranch_eventscan carry aweight, so arcs and marks scale with the count they stand for. - Panels —
node_points, placed under a rectangular tree withph.below(tree, panel). The panel shares the tree's time axis, so a value measured at a node sits directly under that node.
Genomes
The same grammar, for genome maps. Plot a genome as a line or a ring, colour genes by family or strand, link two genomes with synteny ribbons, or set a copy-number heatmap / alignment beside a tree.
import phylustrator as ph

G = ph.genomes.read_gff("genome.gff")           # {name: Genome}
genome = next(iter(G.values()))
(ph.genomes.plot(genome, layout="circular", coordinates="nucleotide")
 + ph.genomes.genes(by="strand")
 + ph.genomes.position_axis()).save("ring.png")
- Layouts —
linear,circular, andstack(one genome per row, for synteny). - Layers —
genes,synteny,highlight,position_axis. - Panels —
heatmap,alignment, placed next to a tree withph.beside(tree, panel).
ZOMBI2 I/O
ph.zombi reads the output of the ZOMBI2 genome-evolution
simulator into the data models above — kept in one clearly-separated layer so the core stays
format-agnostic:
import phylustrator as ph

G = ph.zombi.read_genomes("run/genomes")        # {lineage: Genome}
M = ph.zombi.read_profiles("run")               # family x genome copy-number Matrix
aln = ph.zombi.read_alignment("run", family=0)  # Alignment keyed by genome
tree = ph.zombi.read_species_tree("run")        # a Tree
Command line
phyl is a one-shot tree viewer — hand it a Newick file:
phyl tree.nwk                 # render to a temporary PDF and open it
phyl tree.nwk -o fig.svg      # save instead (format from the extension: .svg / .pdf / .png)
phyl tree.nwk --radial --no-labels
Flags: --layout {rectangular,radial,unrooted} (or --radial / --unrooted), --no-labels,
--node-labels, --no-stem, --no-open. Colouring and everything else live in the Python API.
Dependencies
Only drawsvg (plus cairosvg for PDF/PNG). No ete3, no matplotlib.
License
MIT — see LICENSE.
1 maintainer

Metadata
1 maintainer
Release files for phylustrator 0.9.0
For a detailed explanation of source distributions (sdists) and built distributions (wheels), please see the package formats documentation.
Source distribution (sdist)
| File | Size | Uploaded | |
|---|---|---|---|
| phylustrator-0.9.0.tar.gz | 97.2 kB | Details |
Built distribution (wheel)
| File | Interpreter | ABI | Platform | Reset |
|---|---|---|---|---|
| phylustrator-0.9.0-py3-none-any.whl | Python 3 | none | any | Details |
Total release size: 186.6 kB
Release files / phylustrator-0.9.0.tar.gz
| Download URL | phylustrator-0.9.0.tar.gz |
|---|---|
| Size | 97.2 kB |
| Tags | Source |
|
SHA-256 checksum How to use checksums |
30fc42892c652abe94afced06ed9861cb45473e8b245297e8c5bb1ddd3b4f9b4
|
|
BLAKE2b-256 checksum How to use checksums |
af90a7b4a379a8fd596fe88435dfda9dc1e3916772c370c255ebc5c63082d0a6
|
| Upload date | |
|
Uploaded using Trusted Publishing? What is trusted publishing? |
Yes |
| Uploaded via |
twine/7.0.0 CPython/3.13.14
|
Provenance
Provenance describes where a file came from. On PyPI, provenance is shared via attestations, which provide a verifiable record of the build or publishing details. View details, limitations and caveats.


PyPI Publish Attestation
PyPI verified that this artifact, at this checksum, originated from the publisher listed below.
Signed by GitHub Actions, verified by PyPI on Sep 30, 2026.
Transparency logRelease files / phylustrator-0.9.0-py3-none-any.whl
| Download URL | phylustrator-0.9.0-py3-none-any.whl |
|---|---|
| Size | 89.4 kB |
| Tags | Python 3 |
|
SHA-256 checksum How to use checksums |
1b579595f81c07b5ed487a3a29caae4b3bfef67d0bd68c04111a8b2081f4316e
|
|
BLAKE2b-256 checksum How to use checksums |
986cd266a572ddd9fe26e8b41586e29366281638827afb6ec3581ec0071e706c
|
| Upload date | |
|
Uploaded using Trusted Publishing? What is trusted publishing? |
Yes |
| Uploaded via |
twine/7.0.0 CPython/3.13.14
|
Provenance
Provenance describes where a file came from. On PyPI, provenance is shared via attestations, which provide a verifiable record of the build or publishing details. View details, limitations and caveats.
PyPI Publish Attestation
PyPI verified that this artifact, at this checksum, originated from the publisher listed below.
Signed by GitHub Actions, verified by PyPI on Sep 30, 2026.
Transparency log













