A dashboard to explore long-term DNS query data from Pi-hole FTL database files.

Project description
Pi Hole Long Term Statistics v.0.2.2
A dashboard built with Dash and Plotly to explore long-term DNS query data from Pi-hole v.6 FTL database files. Visualize allowed vs blocked domains, top clients, and query trends over time. I originally made this for my own use, but if you find it useful, a ⭐ would be awesome!
Disclaimer : This is an unofficial, third-party project. The Pi Hole team and the development of PiHole software is not related to this project.
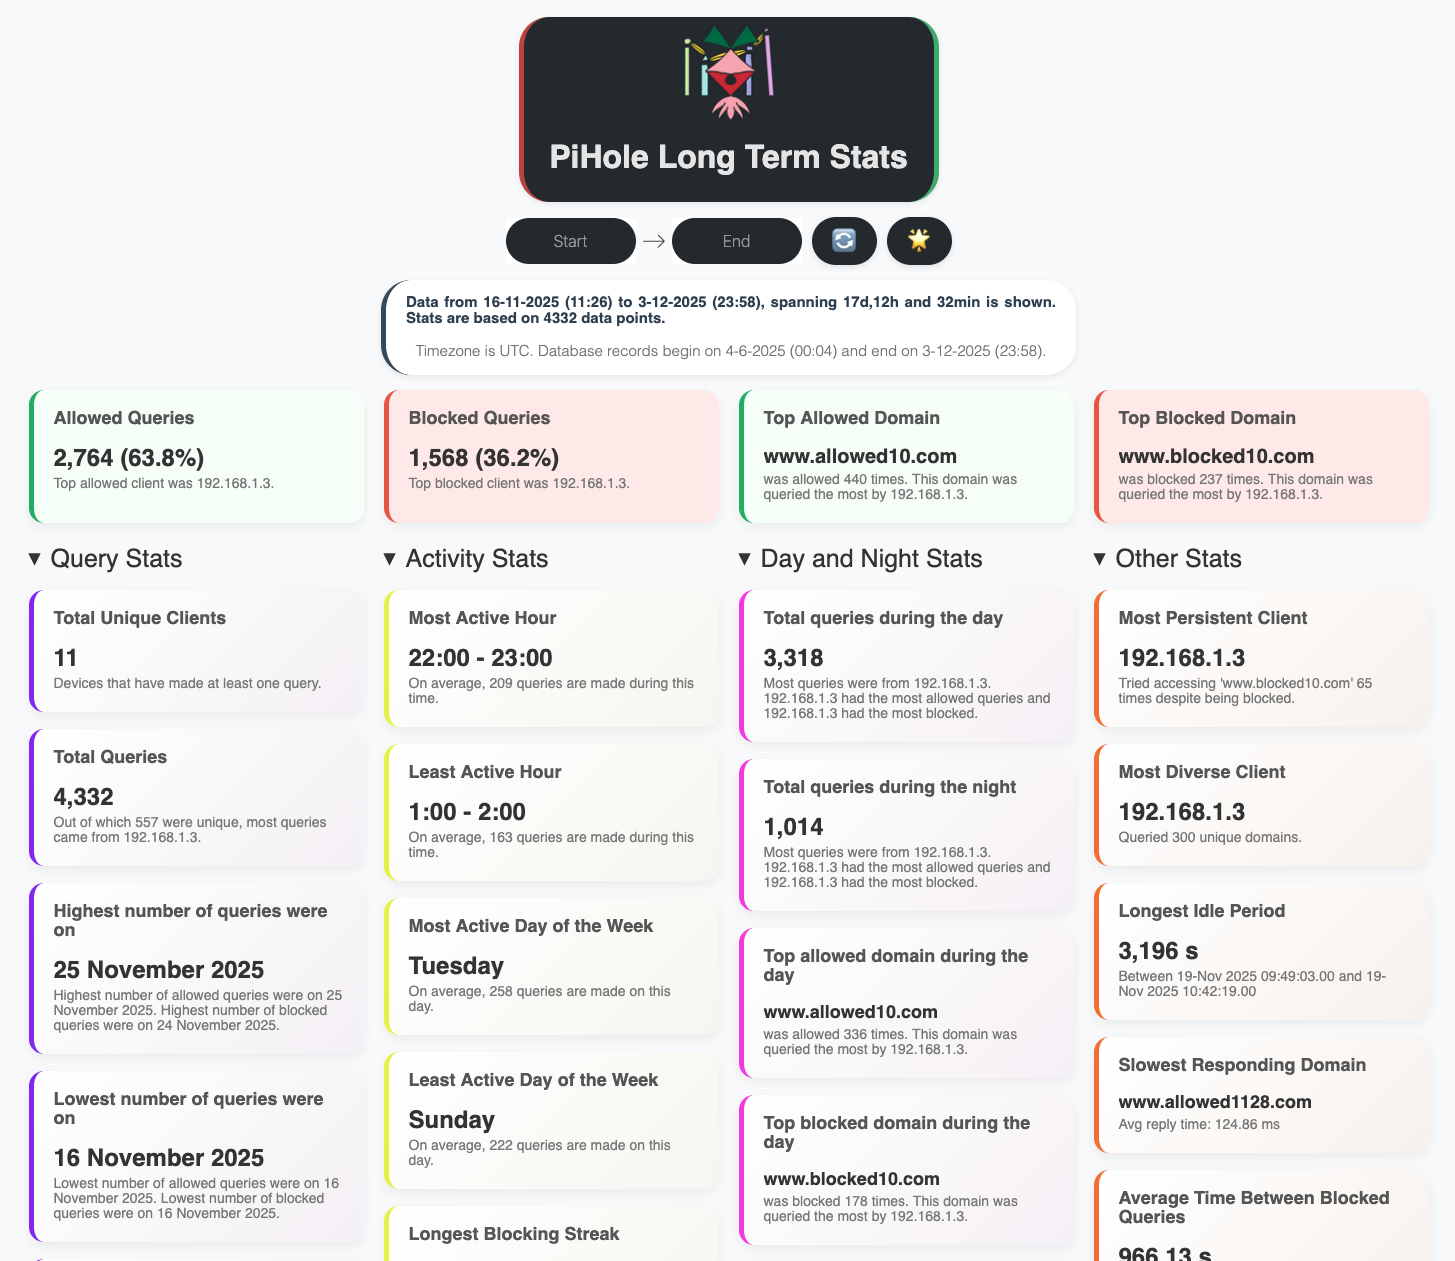

See more screenshots. (The screenshots use a mock database.)
🧰 Features
- ➕ Combine multiple databases and visualize consolidated stats.
- 🗂️ Info cards : Query stats, Activity stats, Day and Night stats. See all supported metrics.
- 📈 Interactive charts for query trends and client behavior, heatmaps showing day-hour stats, reply-times visualisation and more.
- 🔍 Filter queries by client.
- 🌐 View any number of top blocked/allowed domains, top clients.
- 📅 Analyze queries and compute stats over a custom date range and visualize them.
- ❌ Exclude domains using regex patterns before computing stats.
📦 Dependencies
- Python (>=3.11). See
requirements.txtfor dependencies. - Pi-hole (> v.6) FTL database file (pihole-FTL.db)
🚀 Getting Started
[!WARNING] Using your actual Pi-hole FTL db file for querying is not recommended and it is advised to use a copy. Place the copy in the project root or specify its path using the
--db_pathargument orPIHOLE_LT_STATS_DB_PATHenvironment variable. In any case, PiHoleLongTermStats does not monitor for changes in the Pi-hole FTL db file even if you mount it.
[!TIP]
- You can set up a cron job to periodically copy the FTL database to the
db_pathPIHOLE_LT_STATS_DB_PATHlocation, ensuring your stats are updated without touching the live database. Use the reload button in the dashboard to refresh the stats.- Set your timezone (e.g "Europe/Berlin") using
--timezoneorPIHOLE_LT_STATS_TIMEZONE.
[!IMPORTANT]
- PiHoleLongTermStats reloads the Pi-hole FTL database and recalculates stats whenever the dashboard is refreshed or the reload button is clicked.
- If no date range is selected, it uses the default period set by
--daysorPIHOLE_LT_STATS_DAYS.- Large date ranges may lead to increased memory usage.
- When multiple database files are provided, PiHoleLongTermStats concatenates them into a single dataframe and sorts the combined data by timestamp. Duplicate entries are not removed for calculating stats. Consolidating multiple databases can lead to increased memory usage.
[!TIP] There are multiple ways to run the dashboard: using Python or Docker.
🐳 Using Docker
Click to expand.
If you have a copy of your pihole-FTL.db file, you can quickly run the dashboard using Docker Compose.
-
Make a directory for PiHoleLongtermStats:
mkdir PiHoleLongTermStats
cd PiHoleLongTermStats
-
Make a copy/backup of your
pihole-FTL.db(Important!) and place it in the PiHoleLongTermStats directory:# Example: Copy from the default Pi-hole location sudo cp /etc/pihole/pihole-FTL.db . # Ensure the user running the app has read permissions sudo chown $USER:$USER pihole-FTL.db
-
Make a docker-compose.yml file in the same directory:
services:
  pihole-long-term-stats:
    image: ghcr.io/davistdaniel/piholelongtermstats:latest
    container_name: pihole-lt-stats
    ports:
      - "9292:9292"  # Map host port to container port
    volumes:
      - ./pihole-FTL.db:/app/pihole-FTL.db:ro  # Path to your Pi-hole DB file (adjust if it's not in current directory)
      # To include additional Pi-hole databases, mount each one similarly:
      #- ./pihole-FTL-2.db:/app/pihole-FTL-2.db:ro
    environment:
      - PIHOLE_LT_STATS_DB_PATH=/app/pihole-FTL.db  # Path inside the container to the mounted DB file

      # Provide multiple databases by listing their container paths as a
      # comma-separated string, e.g.:
      #- PIHOLE_LT_STATS_DB_PATH=/app/pihole-FTL.db,/app/pihole-FTL-2.db

      - PIHOLE_LT_STATS_DAYS=31                     # Number of days from now of data to analyze; change if desired
      - PIHOLE_LT_STATS_PORT=9292                   # Port the app listens to inside container; keep in sync with ports mapping
      - PIHOLE_LT_STATS_NCLIENTS=10                 # Number of clients to show in top clients plots
      - PIHOLE_LT_STATS_NDOMAINS=10                 # Number of domains to show in top domains plots
      - PIHOLE_LT_STATS_TIMEZONE=UTC                # timezone for display
      #- PIHOLE_LT_STATS_IGNORE_DOMAINS=.*\.local   # regex patterns for excluding domains. Example: to exclude all .local domains use .*\.local

      # To ignore multiple domain patterns, separate each regex with a comma.
      # example definition below ignores: anything ending in .local, anything starting with ads, exactly example.com
      #- PIHOLE_LT_STATS_IGNORE_DOMAINS=.*\.local,^ads\.,^example\.com$

    restart: unless-stopped
and run using :
sudo docker compose up -d
-
Open your browser and visit http://localhost:9292
🐍 Using Python
If installing using python, you can install from this git repo or as a package from PyPi.
Install from PyPi :
Click to expand.
-
Install PiHoleLongTermStats from PyPi
python -m pip install piholelongtermstats
-
Make a directory for PiHoleLongtermStats (optional):
mkdir PiHoleLongTermStats
cd PiHoleLongTermStats
-
Make a copy/backup of your
pihole-FTL.db(Important!) and place it in the PiHoleLongTermStats directory:# Example: Copy from the default Pi-hole location sudo cp /etc/pihole/pihole-FTL.db . # Ensure the user running the app has read permissions sudo chown $USER:$USER pihole-FTL.db
-
Run the app:
piholelongtermstats [OPTIONS]
-
Open your browser and visit http://localhost:9292
Examples for python (Click to expand.)
To start the dashboard and visualize a single pihole-FTL database file for the last 15 days, with top 20 clients and top 15 domains on port 9292 while ingoring all domains which end with ".local":
piholelongtermstats --db_path pihole-FTL.db --days 15 --n_clients 20 --n_domains 15 --port 9292 --ignore-domains ".*\.local"
To combine two databases, provide paths as comma-separated strings:
piholelongtermstats --db_path pihole-FTL.db,pihole-FTL-2.db
To exclude multiple domains, provide comma-separated regex patterns:
piholelongtermstats --ignore-domains ".*\.local,.*\.apple.com"
Install from source :
Click to expand.
-
Clone this repository and move into the project folder:
git clone https://github.com/davistdaniel/PiHoleLongTermStats.git
cd PiHoleLongTermStats
-
Install dependencies using pip:
pip install -r requirements.txt
-
Make a copy/backup of your
pihole-FTL.db(Important!) and place it in the PiHoleLongTermStats directory:# Example: Copy from the default Pi-hole location sudo cp /etc/pihole/pihole-FTL.db . # Ensure the user running the app has read permissions sudo chown $USER:$USER pihole-FTL.db
-
Run the app:
python piholelongtermstats/app.py [OPTIONS]
See the Configuration section below for available options.
-
Open your browser and visit http://localhost:9292
Examples for python (Click to expand.)
To start the dashboard and visualize a single pihole-FTL database file for the last 15 days, with top 20 clients and top 15 domains on port 9292 while ingoring all domains which end with ".local":
python piholelongtermstats/app.py --db_path pihole-FTL.db --days 15 --n_clients 20 --n_domains 15 --port 9292 --ignore-domains ".*\.local"
To combine two databases, provide paths as comma-separated strings:
python piholelongtermstats/app.py --db_path pihole-FTL.db,pihole-FTL-2.db
To exclude multiple domains, provide comma-separated regex patterns:
python piholelongtermstats/app.py --ignore-domains ".*\.local,.*\.apple.com"
⚙️ Configuration
You can configure the application using command-line arguments or environment variables:
| Command-Line Argument | Environment Variable | Default Value | Description |
|---|---|---|---|
--db_path |
PIHOLE_LT_STATS_DB_PATH |
pihole-FTL.db |
Path to the copied Pi-hole database file. Multiple databases can be combined by providing paths as comma-separated strings. |
--days |
PIHOLE_LT_STATS_DAYS |
31 |
Number of days back from today to analyze. |
--port |
PIHOLE_LT_STATS_PORT |
9292 |
Port number to serve the Dash app on. |
--n_clients |
PIHOLE_LT_STATS_NCLIENTS |
10 |
Number of top clients to show in top clients plots. |
--n_domains |
PIHOLE_LT_STATS_NDOMAINS |
10 |
Number of top clients to show in top clients plots. |
--port |
PIHOLE_LT_STATS_TIMEZONE |
UTC |
Timezone for displaying times in the dashboard. |
--ignore-domains |
PIHOLE_LT_STATS_IGNORE_DOMAINS |
"" |
Comma-separated regex patterns to exclude domains from from stats (e.g to exlcude all .local domains, use ".*.local") |
🧑💻 Contributing
Any contribution, feature ideas or bug fixes are always welcome.
Star History

Supported metrics
| Metric | Description |
|---|---|
| Allowed Queries | Total number of queries that were allowed through the Pi-hole. |
| Blocked Queries | Total number of queries that were blocked by the Pi-hole. |
| Top Allowed Domain | The domain which was allowed the most |
| Top Blocked Domain | The domain which was blocked the most |
| Total Unique Clients | The total number of unique devices that made queries. |
| Total Queries | Total number of queries processed by the Pi-hole. |
| Highest number of queries were on | The date with the peak query count. |
| Lowest number of queries were on | The date with the lowest query count. |
| Average reply time | The average time it takes for the Pi-hole to respond to a query. |
| Most Active Hour | The hour with the highest number of queries. |
| Least Active Hour | The hour with the lowest number of queries. |
| Most Active Day of the Week | The day with the highest query activity. |
| Least Active Day of the Week | The day with the lowest query activity. |
| Longest Blocking Streak | The longest consecutive period where queries were blocked. |
| Longest Allowing Streak | The longest consecutive period where queries were allowed. |
| Total queries during the day | Total number of queries made during daytime hours (06:00 to 23:59). |
| Total queries during the night | Total number of queries made during nighttime hours. |
| Top allowed domain during the day | The most allowed domain during the day. |
| Top blocked domain during the day | The most blocked domain during the day. |
| Top allowed domain during the night | The most allowed domain during the night. |
| Top blocked domain during the night | The most blocked domain during the night. |
| Most Persistent Client | The client that made the highest number of queries. |
| Most Diverse Client | The client that queried a blocked domain the most times. |
| Longest Idle Period | The longest period without any queries. |
| Slowest Responding Domain | The domain with the highest average response time. |
| Average Time Between Blocked Queries | Average interval between consecutive blocked queries. |
| Average Time Between Allowed Queries | Average interval between consecutive allowed queries. |
📄 License


Download files
Download the file for your platform. If you're not sure which to choose, learn more about installing packages.
Source Distribution
Built Distribution
Filter files by name, interpreter, ABI, and platform.
If you're not sure about the file name format, learn more about wheel file names.
Copy a direct link to the current filters
File details
Details for the file piholelongtermstats-0.2.2.tar.gz.
File metadata
- Download URL: piholelongtermstats-0.2.2.tar.gz
- Upload date:
- Size: 72.3 kB
- Tags: Source
- Uploaded using Trusted Publishing? No
- Uploaded via: twine/6.2.0 CPython/3.13.7
File hashes
| Algorithm | Hash digest | |
|---|---|---|
| SHA256 |
5ea4ca7c3ea7582ad9cae8ed1d8c4d2ce625f3fdbb37f77c04e699239a264852
|
|
| MD5 |
77204c2ab4853a345743356a90707223
|
|
| BLAKE2b-256 |
06416a31ddc35404f5ed04aee10a9294396aba1550d1a691f447cbc4c66b7c68
|
File details
Details for the file piholelongtermstats-0.2.2-py3-none-any.whl.
File metadata
- Download URL: piholelongtermstats-0.2.2-py3-none-any.whl
- Upload date:
- Size: 68.8 kB
- Tags: Python 3
- Uploaded using Trusted Publishing? No
- Uploaded via: twine/6.2.0 CPython/3.13.7
File hashes
| Algorithm | Hash digest | |
|---|---|---|
| SHA256 |
a1eb58390b6ce087249c378625a0ba6b8e39ea374f3d4049e6526457ae399dba
|
|
| MD5 |
126e3a2fc96a48bb89e3458d66399fe1
|
|
| BLAKE2b-256 |
134718d68023d03064722a1f2f125b3cc0bc0b92e7508d48a4f51b38dd9193ad
|


