A Pillow extension for drawing graphs and charts.

Project description
piligraphs


A Pillow extension for drawing graphs and charts.
Installation
To install this module, run the following command:
pip install piligraphs
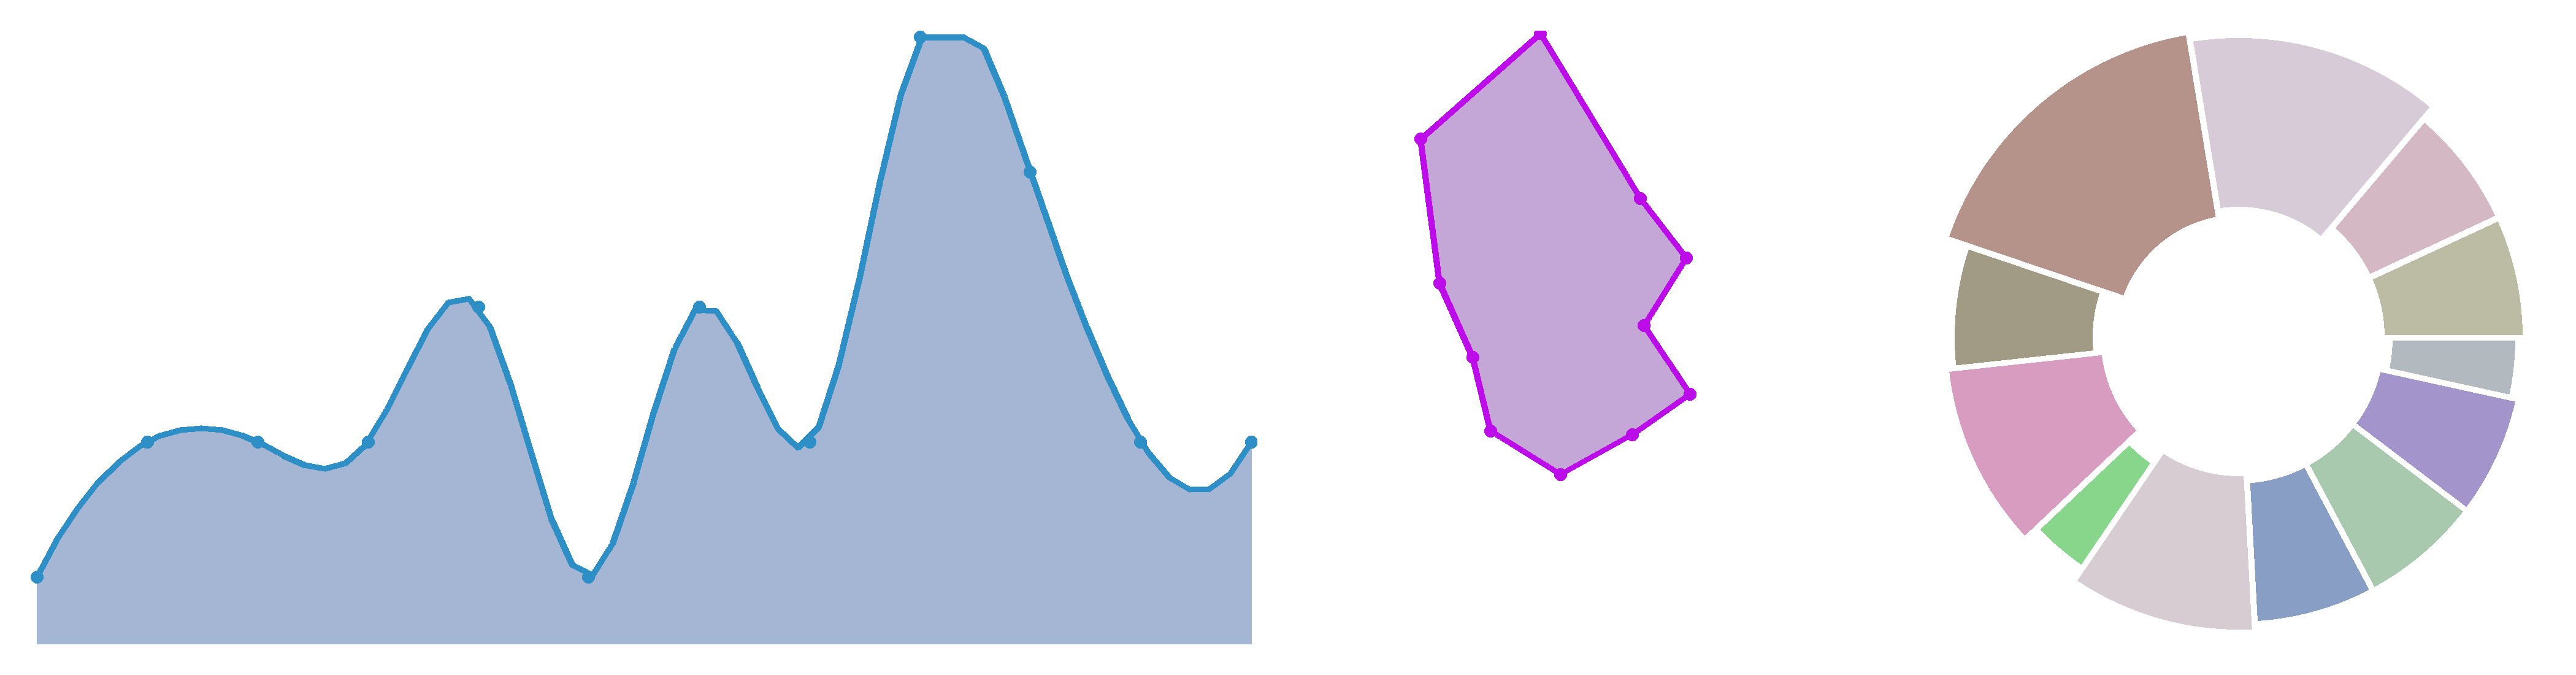
Example usage
Creating a line chart:
import random
from piligraphs import LineChart, Node

# define nodes
nodes = [
    Node(weight=random.randint(1, 7)) for _ in range(10)
]

# create a line chart
chart = LineChart(
    size=(1200, 300),
    thickness=8,
    fill=(243, 14, 95, 156),
    outline=(194, 43, 132, 256),
    pwidth=15,
    onlysrc=True,
    npoints=len(nodes) * 8,
    interp='cubic'
)

# add nodes
chart.add_nodes(*nodes)

# draw the graph
image = chart.draw()
image.show()
Result:

You can find more examples here.
Release history Release notifications | RSS feed


Download files
Download the file for your platform. If you're not sure which to choose, learn more about installing packages.
Source Distribution
piligraphs-0.0.7.tar.gz
(11.2 kB
view details)
Built Distribution
Filter files by name, interpreter, ABI, and platform.
If you're not sure about the file name format, learn more about wheel file names.
Copy a direct link to the current filters
File details
Details for the file piligraphs-0.0.7.tar.gz.
File metadata
- Download URL: piligraphs-0.0.7.tar.gz
- Upload date:
- Size: 11.2 kB
- Tags: Source
- Uploaded using Trusted Publishing? No
- Uploaded via: poetry/1.7.1 CPython/3.11.5 Windows/10
File hashes
| Algorithm | Hash digest | |
|---|---|---|
| SHA256 |
65e86e6ce17ef23866cf309c842e339912e086fdd9fa07fb30322bc3f5c43de9
|
|
| MD5 |
7c00e3ef8549af2ef3cfd8f5ae8ceef0
|
|
| BLAKE2b-256 |
70eed9004464f06cedd56f0353d306262a4b9de2d925bfa1b4f80846d63a318d
|
File details
Details for the file piligraphs-0.0.7-py3-none-any.whl.
File metadata
- Download URL: piligraphs-0.0.7-py3-none-any.whl
- Upload date:
- Size: 19.7 kB
- Tags: Python 3
- Uploaded using Trusted Publishing? No
- Uploaded via: poetry/1.7.1 CPython/3.11.5 Windows/10
File hashes
| Algorithm | Hash digest | |
|---|---|---|
| SHA256 |
98b7a3372aa9a8f123fe9cf634922ab9745f4307abcdae2a352a09d630d7b551
|
|
| MD5 |
8a887de0ba9e0e0ea95d02dcd57ce4d4
|
|
| BLAKE2b-256 |
92c633dae5fbb525b09731fe4a04a30b32f13f8809a826ba52cf11a4920d89da
|


