

Probabilistic Project Planning with Monte Carlo Simulation




Website • Why Planaco? • Features • Installation • Quick Start • Monte Carlo • CLI • Distributions • Contributing
Why Planaco?
Estimating the time it takes to complete a task or project is hard. Traditional approaches use fixed estimates, but this ignores any uncertainty and life often gets in the way.
Planaco helps you make better estimates by modeling tasks as random processes, accounting for uncertainty and task dependencies through Monte Carlo simulation.
Status: Planaco is in alpha (v0.3.0). The public API may still change between releases.
Features
- Probabilistic Task Modeling - Define tasks with min/max/mode duration ranges
- 6 Distribution Types - Triangular, PERT, Uniform, Normal, LogNormal, and Beta distributions
- Task Dependencies - Support for parallel and sequential task execution
- Monte Carlo Simulation - Run thousands of simulations to estimate project completion
- Statistical Analysis - Get percentiles, confidence intervals, and key metrics
- Visualization - Generate histogram and cumulative distribution plots
- Export Results - Save results to JSON or CSV for further analysis
Installation
pip install planaco
Or install from source:
git clone https://github.com/sepam/planaco.git
cd planaco
pip install .
Quick Start
Define Tasks with Uncertainty
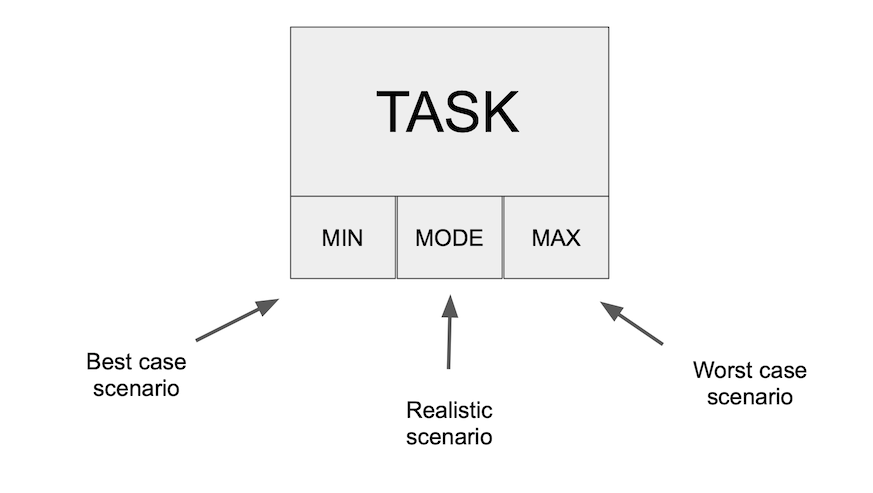
Instead of saying "this task takes 5 days", Planaco lets you model uncertainty:
from planaco import Task

task = Task(
    name='Develop Feature',
    min_duration=3,
    mode_duration=5,  # most likely estimate
    max_duration=9,
    estimator='triangular'
)
Build Projects with Dependencies
Create complex project workflows with parallel and sequential task execution:
from planaco import Task, Project

# Create a project
project = Project(name='Web App Development', unit='days')

# Define tasks
design_ui = Task(name='Design UI', min_duration=2, mode_duration=3, max_duration=5, estimator='triangular')
develop_frontend = Task(name='Develop Frontend', min_duration=5, mode_duration=7, max_duration=10, estimator='triangular')
develop_backend = Task(name='Develop Backend', min_duration=4, mode_duration=6, max_duration=9, estimator='triangular')
testing = Task(name='Testing', min_duration=2, mode_duration=3, max_duration=5, estimator='triangular')
deploy = Task(name='Deploy', min_duration=1, max_duration=2, estimator='uniform')

# Add tasks with dependencies
project.add_task(design_ui)
project.add_task(develop_frontend, depends_on=[design_ui])           # Sequential: frontend needs UI design
project.add_task(develop_backend)                                    # Parallel: backend runs independently
project.add_task(testing, depends_on=[develop_frontend, develop_backend])  # Waits for both tracks
project.add_task(deploy, depends_on=[testing])

Monte Carlo Simulation
Planaco uses Monte Carlo simulation to estimate project completion time. By running thousands of simulations, it leverages the Central Limit Theorem to provide probabilistic estimates for the completion of tasks and projects.
Run Simulation & Get Statistics
# Get comprehensive statistics of the simulation
stats = project.statistics(n=10000)

print(f"Median completion time: {stats['median']:.1f} days")
print(f"90% confidence: {stats['percentiles']['p90']:.1f} days")
print(f"95% confidence: {stats['percentiles']['p95']:.1f} days")
statistics() returns a dictionary with the full distribution summary:
{
    'n_simulations': 10000,
    'unit': 'days',
    'mean': 18.4,
    'median': 18.1,
    'std_dev': 2.7,
    'min': 11.2,
    'max': 29.8,
    'percentiles': {'p50': 18.1, 'p75': 20.1, 'p85': 21.3, 'p90': 22.1, 'p95': 23.4, 'p99': 25.6},
    'confidence_intervals': {'95%': (13.5, 24.2)},
}
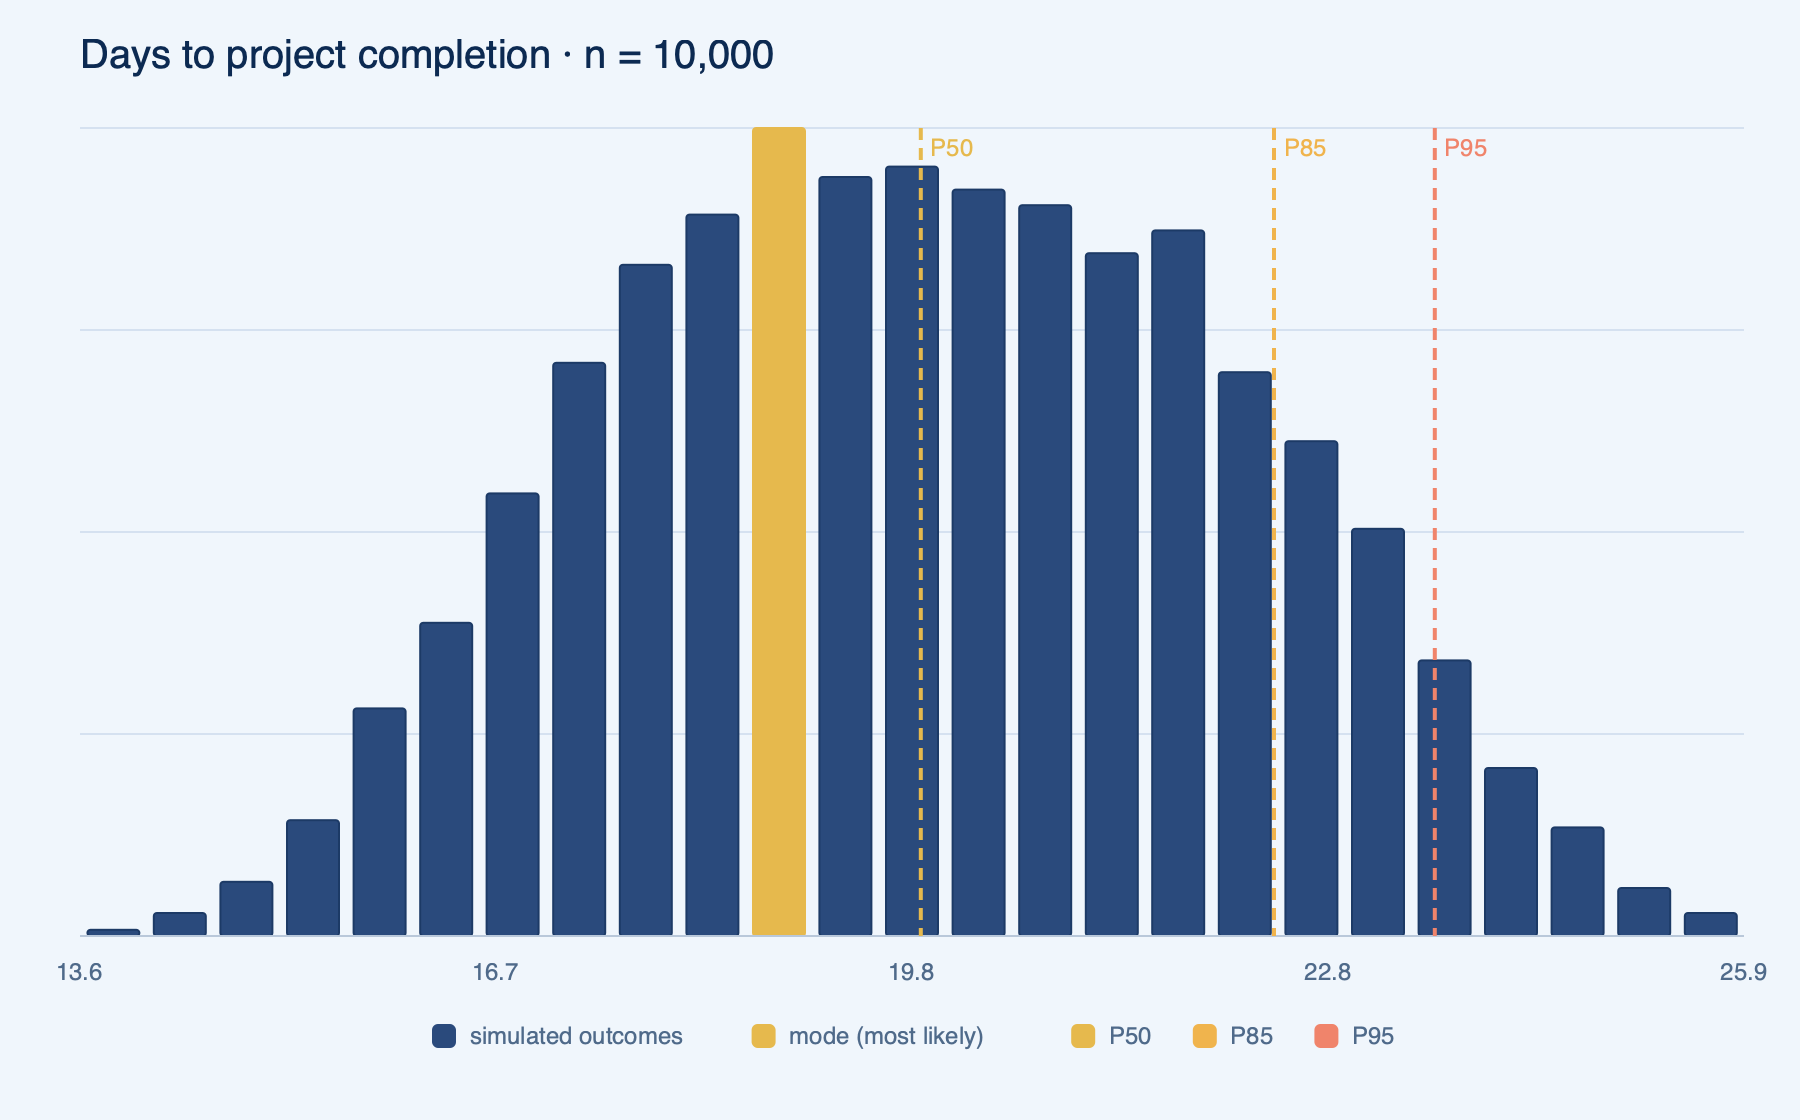
Visualize Results
# Generate histogram
project.plot(n=10000, hist=True)
Cumulative Distribution
Read the likelihood of completing your project by a given date:
# Generate cumulative distribution
project.plot(n=10000, hist=False)
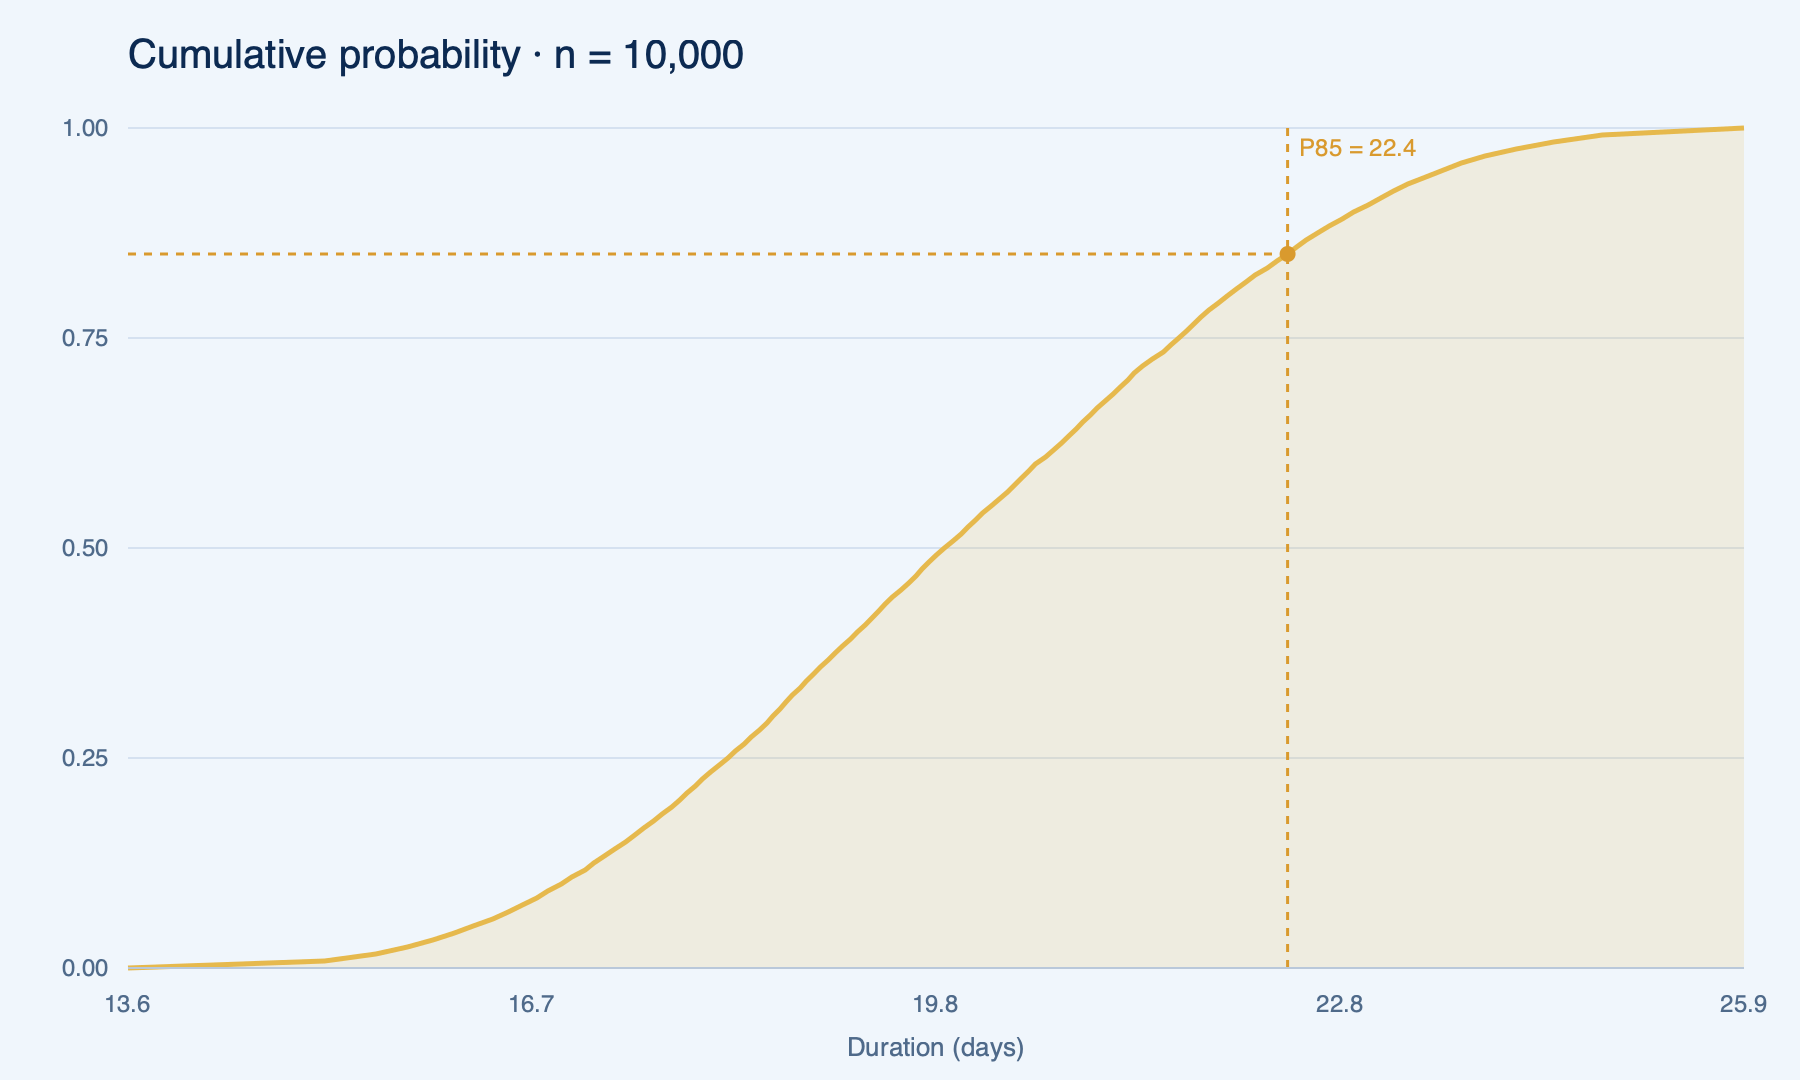
The cumulative distribution shows the probability of completing the project within a given timeframe, accounting for both parallel and sequential task execution.
Advanced Features
Export Results
# Export to JSON
project.export_results(n=10000, format='json', output='results.json')

# Export to CSV
project.export_results(n=10000, format='csv', output='results.csv')
Probability Distributions
Planaco supports six probability distributions, each suited for different estimation scenarios:
Triangular Distribution (Default)
Best for three-point estimates where you can identify optimistic, most likely, and pessimistic values.
task = Task(
    name="Development",
    min_duration=5,      # Best case
    mode_duration=8,     # Most likely
    max_duration=15,     # Worst case
    estimator="triangular"
)
When to use: Most common choice. Use when you have a clear "most likely" estimate and can define reasonable bounds.
PERT Distribution
A smoother alternative to triangular that weights the mode more heavily (by default, 4x). Widely used in project management.
task = Task(
    name="Testing",
    min_duration=2,
    mode_duration=4,
    max_duration=10,
    estimator="pert"
)
When to use: Industry standard for project estimation. Produces more realistic results than triangular by reducing the influence of extreme values.
Uniform Distribution
All values between min and max are equally likely. No mode required.
task = Task(
    name="Deployment",
    min_duration=1,
    max_duration=3,
    estimator="uniform"
)
When to use: When you genuinely don't know the most likely duration, only the range. Good for tasks with high uncertainty.
Normal (Gaussian) Distribution
Classic bell curve centered on the mean. Best for well-understood, repeatable tasks.
from planaco import Task, NormalDistribution

task = Task(
    name="Code Review",
    distribution=NormalDistribution(
        mean=2.0,
        std_dev=0.5,
        min_value=0.5,  # Optional lower bound
        max_value=4.0   # Optional upper bound
    )
)
When to use: Tasks you've done many times before with predictable variability. The optional bounds prevent unrealistic negative or extreme values.
LogNormal Distribution
Right-skewed distribution where delays are more likely than early completion. Realistic for many real-world tasks.
from planaco import Task, LogNormalDistribution

task = Task(
    name="Integration",
    distribution=LogNormalDistribution(
        mean=5.0,
        std_dev=2.0
    )
)
When to use: Tasks with potential for unexpected delays (debugging, third-party dependencies, approvals). Models the common pattern where things take longer than expected more often than they finish early.
Beta Distribution
Most flexible distribution with customizable shape via alpha and beta parameters.
from planaco import Task, BetaDistribution

task = Task(
    name="Research",
    distribution=BetaDistribution(
        alpha=2.0,
        beta=5.0,
        min_value=1.0,
        max_value=10.0
    )
)
When to use: When you need fine-grained control over the distribution shape:
alpha < beta: Right-skewed (more likely to finish early)alpha > beta: Left-skewed (more likely to finish late)alpha = beta: Symmetric
Choosing the Right Distribution
| Scenario | Recommended Distribution |
|---|---|
| Standard 3-point estimate | PERT or Triangular |
| Well-understood, repeatable task | Normal |
| High uncertainty, unknown mode | Uniform |
| Risk of delays/blockers | LogNormal |
| Custom uncertainty profile | Beta |
New to Monte Carlo? Start with PERT - it's the industry standard and works well for most project estimation tasks.
Command Line Interface
Planaco also ships with a planaco CLI that runs simulations from a YAML project file — useful for CI pipelines, shared team configs, and version-controlled estimates.
planaco init project.yaml                 # Create a template config
planaco stats project.yaml -n 10000       # Print formatted statistics
planaco run project.yaml -o results.json  # Export results (json or csv)
planaco plot project.yaml -o chart.png    # Histogram or cumulative plot
planaco graph project.yaml                # Visualize the task dependency graph
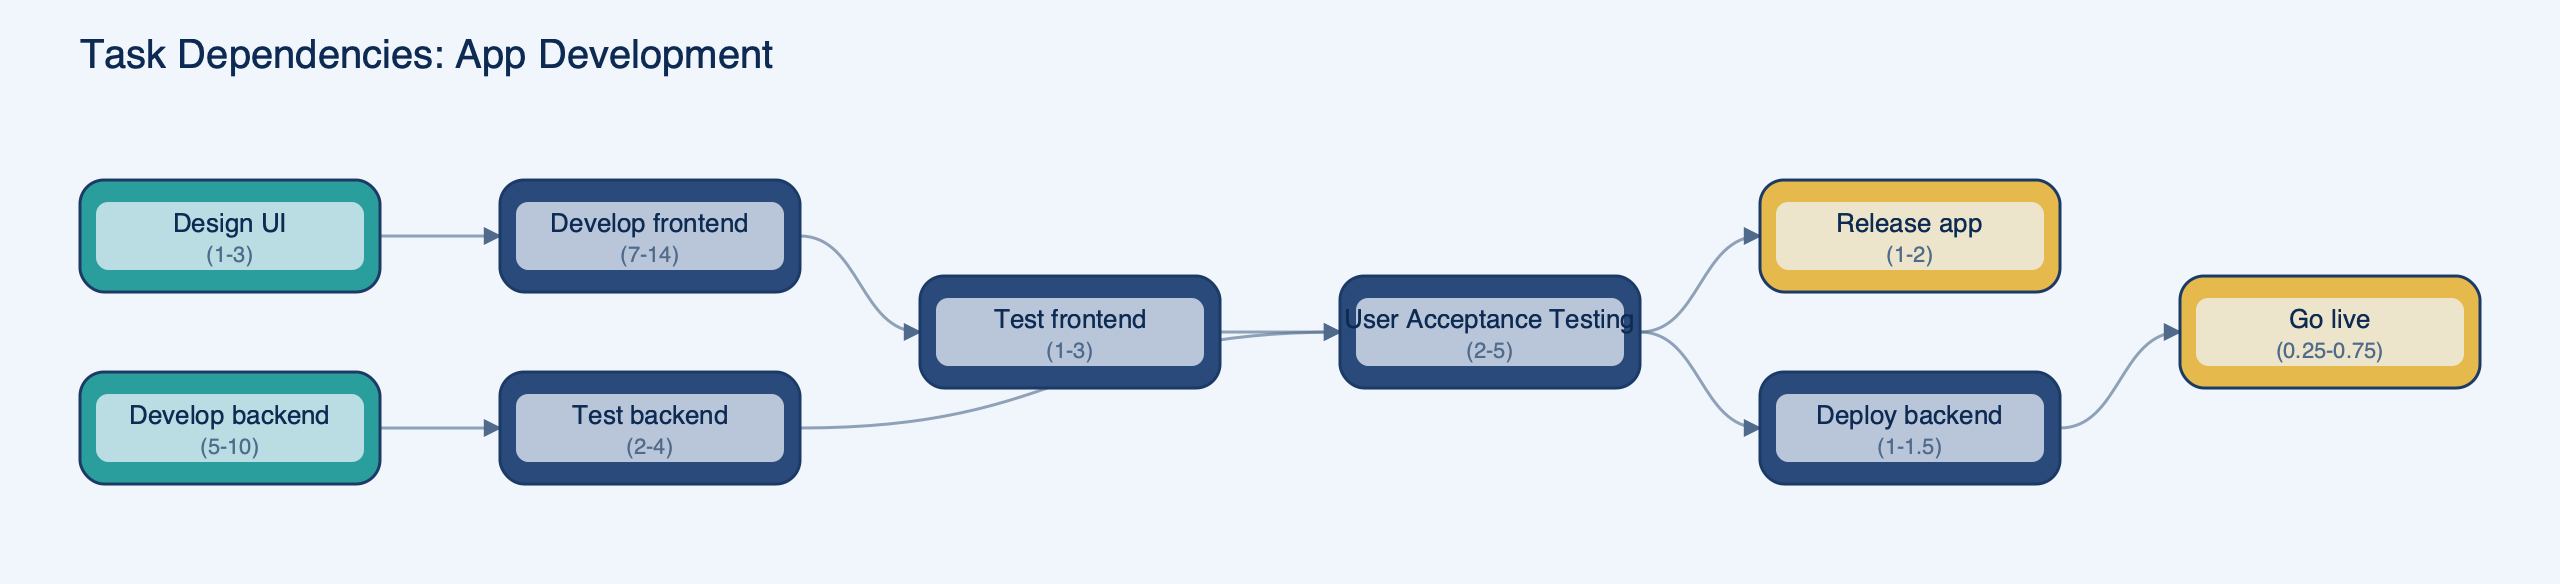
Charts render as crisp, on-brand SVG (or PNG) — see the brand & style guide.
Example YAML config:
project:
  name: Website Redesign
  unit: days
  seed: 42  # optional, for reproducible runs

tasks:
  design:
    name: Design
    estimator: pert
    min_duration: 5
    mode_duration: 7
    max_duration: 14

  development:
    name: Development
    estimator: triangular
    min_duration: 10
    mode_duration: 15
    max_duration: 25
    depends_on: [design]
Run planaco --help or planaco <command> --help to see all available options, including --seed for reproducible results and -p/--percentile markers for plots.
Example
A complete, runnable example lives in example/example_project.py, with an annotated walkthrough in example/example.ipynb.
python example/example_project.py
Contributing
Contributions are welcome! To set up a development environment:
git clone https://github.com/sepam/planaco.git
cd planaco
pip install -e ".[dev]"
Run the checks before submitting a PR:
pytest             # run the test suite
ruff check .       # lint
black .            # format
mypy src           # type-check
Please open an issue to discuss larger changes before starting work.
License
This project is licensed under the MIT License - see the LICENSE.md file for details.
1 maintainer

Metadata
1 maintainer
Release files for planaco 0.3.1
For a detailed explanation of source distributions (sdists) and built distributions (wheels), please see the package formats documentation.
Source distribution (sdist)
| File | Size | Uploaded | |
|---|---|---|---|
| planaco-0.3.1.tar.gz | 64.6 kB | Details |
Built distribution (wheel)
| File | Interpreter | ABI | Platform | Reset |
|---|---|---|---|---|
| planaco-0.3.1-py3-none-any.whl | Python 3 | none | any | Details |
Total release size: 104.7 kB
Release files / planaco-0.3.1.tar.gz
| Download URL | planaco-0.3.1.tar.gz |
|---|---|
| Size | 64.6 kB |
| Tags | Source |
|
SHA-256 checksum How to use checksums |
c1b1af730dd9285898e860d5c4f7a71df3376b1c404583afb5ceed437cc7c8bc
|
|
BLAKE2b-256 checksum How to use checksums |
00c507e94aaa38aa7db30a77c509a98a9a9a6f1f2d0f538dbaf9726296b7bcfe
|
| Upload date | |
|
Uploaded using Trusted Publishing? What is trusted publishing? |
Yes |
| Uploaded via |
twine/6.1.0 CPython/3.13.12
|
Provenance
Provenance describes where a file came from. On PyPI, provenance is shared via attestations, which provide a verifiable record of the build or publishing details. View details, limitations and caveats.


PyPI Publish Attestation
PyPI verified that this artifact, at this checksum, originated from the publisher listed below.
Signed by GitHub Actions, verified by PyPI on Jul 5, 2026.
Transparency logRelease files / planaco-0.3.1-py3-none-any.whl
| Download URL | planaco-0.3.1-py3-none-any.whl |
|---|---|
| Size | 40.1 kB |
| Tags | Python 3 |
|
SHA-256 checksum How to use checksums |
88510392549ea9eb287bfa70cca8286c8579520a99d28c982bad167aad6e769d
|
|
BLAKE2b-256 checksum How to use checksums |
3a705367e3ee137ba3373dddfe147473b7f121f64ffbb0b072fd8169ed135814
|
| Upload date | |
|
Uploaded using Trusted Publishing? What is trusted publishing? |
Yes |
| Uploaded via |
twine/6.1.0 CPython/3.13.12
|
Provenance
Provenance describes where a file came from. On PyPI, provenance is shared via attestations, which provide a verifiable record of the build or publishing details. View details, limitations and caveats.
PyPI Publish Attestation
PyPI verified that this artifact, at this checksum, originated from the publisher listed below.
Signed by GitHub Actions, verified by PyPI on Jul 5, 2026.
Transparency log













