An interactive visualization tool for microplate reader growth data.

Project description
PlateViz Library
An interactive visualization tool for synergy-file-reader-type microplate reader growth data.
This tool uses customtkinter with a custom-built theme to run an application with intuitive controls to easily view your plate reader data. PlateViz does not cover all potential use cases and is not suited as basis for extensive customisations or in-depth analysis, rather think of it as a (beautiful) first step towards analyzing your growth data. At this moment plateviz supports single plate visualization for a 96-well plate.
Getting Started
Install the package from your terminal using pip:
pip install plateviz
We assume that you are a user of synergy-file-reader and are familiar with loading plate reader data using it. If not, have a look at their friendly documentation. PlateViz is designed to be very intuitive so just go through this Getting Started section and start exploring. If you want more details about the features, scroll down to the User Guide.
Importing plateviz and launching the app
import plateviz as pv
If you don't have any plate reader data ready to go and still want to experience this application, scroll down to the Example Data section. Otherwise, you probably have a text file directly obtained from the plate reader. Proceed as you would normally do.
from synergy_file_reader import SynergyFile
my_plate = SynergyFile("my_data.txt")[0]
In addition to my_plate, which is an object of class SynergyPlate, you'll require the names of all the channels which you want to look at. You can either declare them manually or access them via the channel property of my_plate:
channels = ['channel_1', 'channel_2', 'channel_3'] # manual
channels = my_plate.channels # accessed via properties
At this point you are ready to launch the application and view your growth data. Simply call the plateDisplay function and enjoy the experience:
pv.plateDisaplay(my_plate, channels=channels)
Channel nicknames
In case you forgot to edit the channel names before your experiment or want to customize the channel names, you can do that using the nick attribute in the following way:
channels = ['OD', 'Fluorescence:433,475', 'Fluorescence:520,560']
nicks = ['Tom', 'Dick', 'Harry']
pv.plateDisplay(my_plate, channels=channels, nick=nicks)
Just make sure to order the channel nicknames exactly how they appear in the channels attribute. These nicknames will be displayed in the app instead of the real channel names.
Custom colormap
You can also customize the colormap used for plotting in the Multi-Well mode as long as it is matplotlib-consistent. The default colormap is gnuplot.
pv.plateDisplay(my_plate, channels=channels, nick=nicks, cmap='viridis')
Example Data
Our example data is provided with the library and can be accessed using:
pv.example_data
This is an object of class SynergyPlate. This is equivalent to my_plate above. You can use the following set of commands to immediately launch the application without loading any data of your own:
import plateviz as pv
pv.plateDisplay(pv.example_data, pv.example_data.channels)
User Guide
This section explicitly explains all the available PlateViz features.
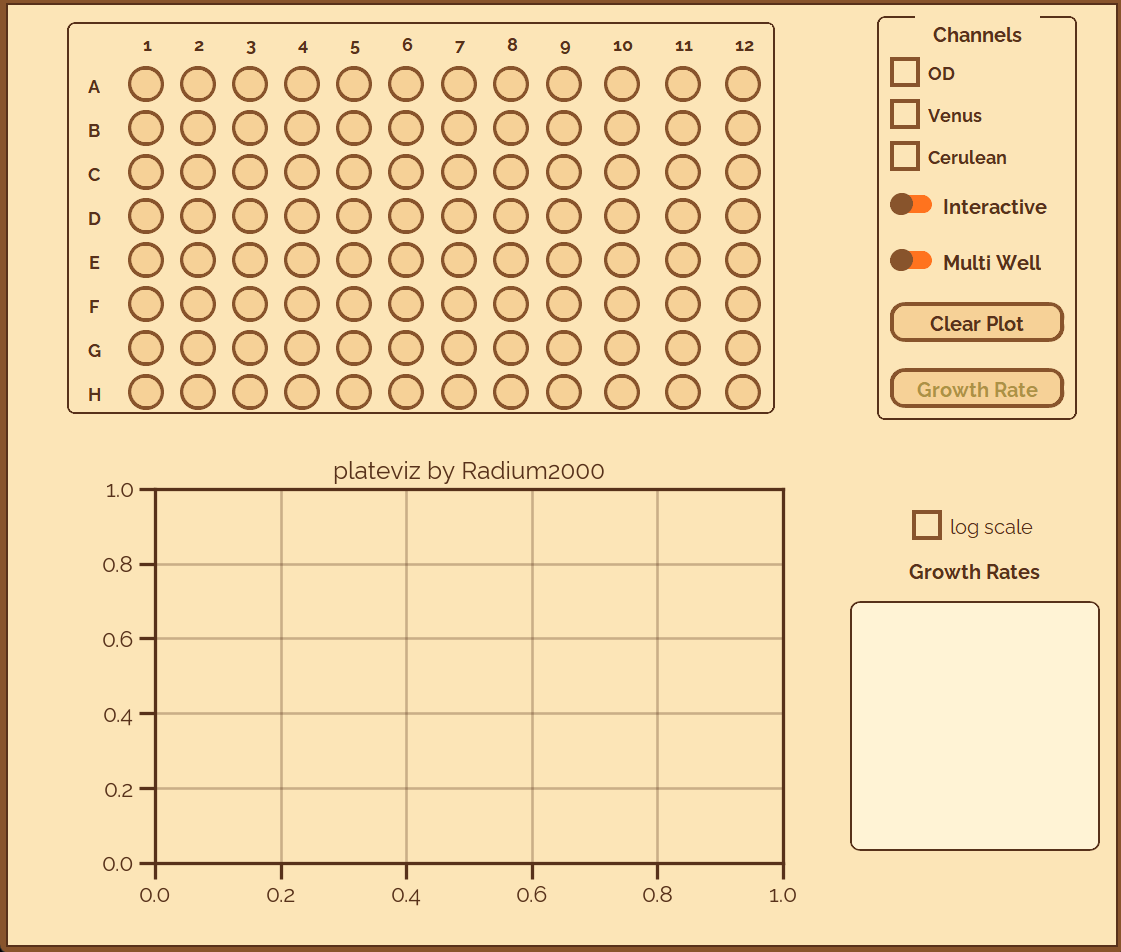
Channel checkboxes
You can select which channels you want to be plotted through these checkboxes. The embedded canvas will be updated once you click on a well button. If you have selected multiple channels, growth rate determination will be disabled. If no channels are selected, no data will be plotted and a "warning" will be displayed on the plot.
Multi-Well mode
Enable this switch to view the data of multiple wells at once. To add more data to the canvas, keep pressing different well buttons. If the well you clicked on has already been plotted on the canvas, nothing will happen. While in this mode, the growth rate determination is disabled.
Interactive mode
The interactive mode switch is provided for ease of detailed viewing, in case you want to have a better look at the plot and want access to features like zooming, panning and saving the plot. Multiwell plotting and growth rate determination are disabled when in interactive mode.
- If nothing is being currently displayed on the canvas, the next button press will open an interactive, native-matplotlib window with the data from that particular well. Keep selecting well, and more windows will open in parallel.
- A very powerful, use-case scenario is if you have multiwell mode enabled and there are many growth curves displayed on the current canvas. In this case, for better viewing you can enable the interactive mode switch and the current view will pop out into an interactive window. From here you can also save the figure locally.
Growth rate determination
This feature is only available for single growth curves; so multiwell plots and multi-channel plots are not supported for now. On pressing this button, the current growth curve is used as an input to fit to a sigmoidal curve. We use scipy.optimize.curve_fit and the resulting fit is displayed on the canvas with a dashed line. Since growth rate is the parameter of interest we output it to the text box on the right of the canvas with information about the well and channel. This enables you to copy the information if needed. Any subsequent calls for fit will be appended to this text box so you can copy all the information at the very end of your use.
Goodness of fit: To determine whether curve is actually a growth curve or some other function or just noise, we use a goodness of fit estimation to set a threshold. Currently we are using r2_score from sklearn.metrics to make this call. Any fit with an $R^2$ score lower than $0.85$ is rejected and a warning is displayed on the canvas.
Log scale
Selecting this checkbox will set the $y$-axis scale to be logarithmic. All interactive plots will also be affected.
Clear plot
Clear the current view with this button. The canvas returns to its ground state.
Recommend this library to your friends and colleagues if you found it useful and feel free to send any suggestions to my email id.
Release history Release notifications | RSS feed


Download files
Download the file for your platform. If you're not sure which to choose, learn more about installing packages.
Source Distributions
Built Distribution
Filter files by name, interpreter, ABI, and platform.
If you're not sure about the file name format, learn more about wheel file names.
Copy a direct link to the current filters
File details
Details for the file plateviz-0.1.1-py3-none-any.whl.
File metadata
- Download URL: plateviz-0.1.1-py3-none-any.whl
- Upload date:
- Size: 351.1 kB
- Tags: Python 3
- Uploaded using Trusted Publishing? No
- Uploaded via: twine/6.1.0 CPython/3.12.3
File hashes
| Algorithm | Hash digest | |
|---|---|---|
| SHA256 |
fb7bb4e03d4cedcdec4ad0dea2aca08a45facfcac2ed03ff362be1c7beb650da
|
|
| MD5 |
9d3c084507209069fb9c32fe31e6d539
|
|
| BLAKE2b-256 |
dc03a976ce668d9594dee47307e0e63675064a2d54d94315a19fcaa115b7f6dd
|


