Python package to generate plots from coverage report

Project description
plot_coverage


Python package to generate plots from coverage report
Generate visual plots to demonstrate your code coverage. Interactive plots are opened in the browser immediately after running the script. HTML files for the plots are stored alongside the coverage report inside htmlcov folder.
Plots are generated using plotly express.
Usage
Install using pip install plot-coverage
- From the project root (where htmlcov folder is located), run:
plot_coverage –plot=treemap
plot_coverage –plot=sunburst
Note: Make sure htmlcov/index.html is present at the root of your project before running the above. So, coverage html should be run before attempting this.
Example
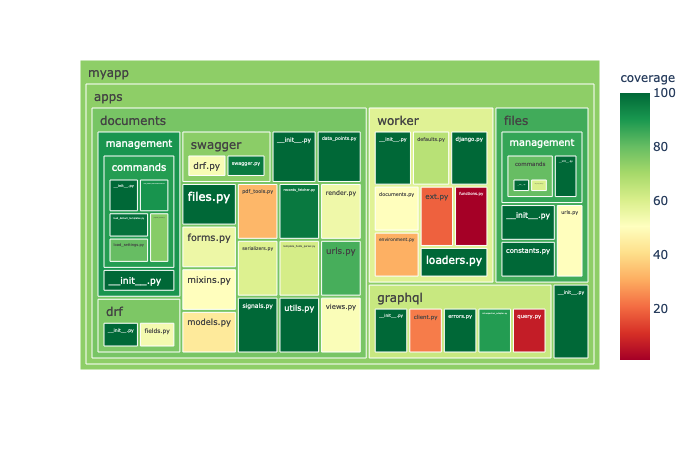
Treemap
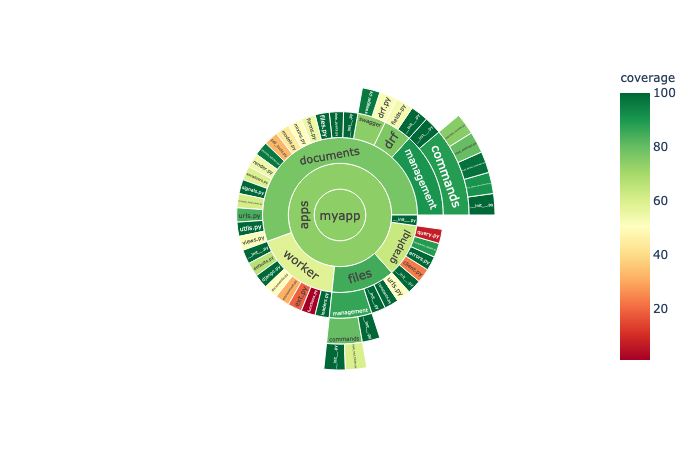
Sunburst
Features
Generate Treemap plot for showing your coverage report with color sequence based on coverage percentage.
Generate Sunburst plot for showing your coverage report with color sequence based on coverage percentage.
Credits
This package was created with Cookiecutter and the audreyr/cookiecutter-pypackage project template.
Free software: BSD license
History
1.0.0 (2020-06-25)
First release on PyPI.


Download files
Download the file for your platform. If you're not sure which to choose, learn more about installing packages.
Source Distribution
Built Distribution
Filter files by name, interpreter, ABI, and platform.
If you're not sure about the file name format, learn more about wheel file names.
Copy a direct link to the current filters
File details
Details for the file plot_coverage-1.0.2.tar.gz.
File metadata
- Download URL: plot_coverage-1.0.2.tar.gz
- Upload date:
- Size: 12.8 kB
- Tags: Source
- Uploaded using Trusted Publishing? No
- Uploaded via: twine/3.2.0 pkginfo/1.5.0.1 requests/2.24.0 setuptools/47.3.1 requests-toolbelt/0.9.1 tqdm/4.46.1 CPython/3.8.0
File hashes
| Algorithm | Hash digest | |
|---|---|---|
| SHA256 |
a63415e3cbe488d9391ed283e6f88093a61ff66fd6be94c00aafe86718bfa46e
|
|
| MD5 |
ffd508bf9e3d16217fc561f6971836d1
|
|
| BLAKE2b-256 |
22b3c502d23c96644d5230dd641bc739588bb6d816c59bf5b85e6f359551c0be
|
File details
Details for the file plot_coverage-1.0.2-py2.py3-none-any.whl.
File metadata
- Download URL: plot_coverage-1.0.2-py2.py3-none-any.whl
- Upload date:
- Size: 5.3 kB
- Tags: Python 2, Python 3
- Uploaded using Trusted Publishing? No
- Uploaded via: twine/3.2.0 pkginfo/1.5.0.1 requests/2.24.0 setuptools/47.3.1 requests-toolbelt/0.9.1 tqdm/4.46.1 CPython/3.8.0
File hashes
| Algorithm | Hash digest | |
|---|---|---|
| SHA256 |
83bd830d8dbd36f24b103d1435007bd2e457b892cbbe8597a539b2214a0a6b48
|
|
| MD5 |
9afcebb8e2d8c0a55133c78898a74d52
|
|
| BLAKE2b-256 |
efbbaa51a67acf1bc9d0ad12d105d4bf2c53cd9fea128d0aa7098831a888c896
|


