
Creates a static .html file with charts using Google Charts API

Project description
plot2html
Helping people publish beautiful automated reports that contribute to transparency, high quality monitoring and faster decision making
With this library, you can create static .html files with text and charts using Google Charts API.
On the command line:
pip install plot2html
On your python file:
import pandas as pd
from plot2html import CreateReport
rep = CreateReport("Example of plot2html Report")
rep.text("<h2>Smart title you can create</h2>This is an example what what you can do with plot2html.")
temp = pd.read_csv('https://raw.githubusercontent.com/rafatro/plot2html/main/tests/Temperature_London_Rome.csv',parse_dates=[0])
options = {'title': 'Average temperature at London and Rome',
           'hAxis': {'title': 'Date'},
           'vAxis': {'title': 'Average Daily Temperature (Celsius)'},
           'colors': ['#a52714', '#097138']
          }
rep.plot(data=temp.pivot(index='date', columns='location', values='tavg').reset_index()
         ,x='date'
         ,y=['London','Rome']
         ,type='line'
         ,width='half'
         ,height=400
         ,options=options)
rep.text('''This text is an explanation about the chart to the left.<br>
The first chart above shows data from <a href='https://meteostat.net/'>Meteostat</a>, that provides open source data about meteorology.<br>
You can see Rome temperatures follow the same trend as London's, because both cities are in the northern hemisphere, but Rome is a bit hotter, especialy on the summer.
''',width="half")
rep.exporthtml("C:/Users/rafae/Desktop/plot2html/tests/index.html")
You will get this output:
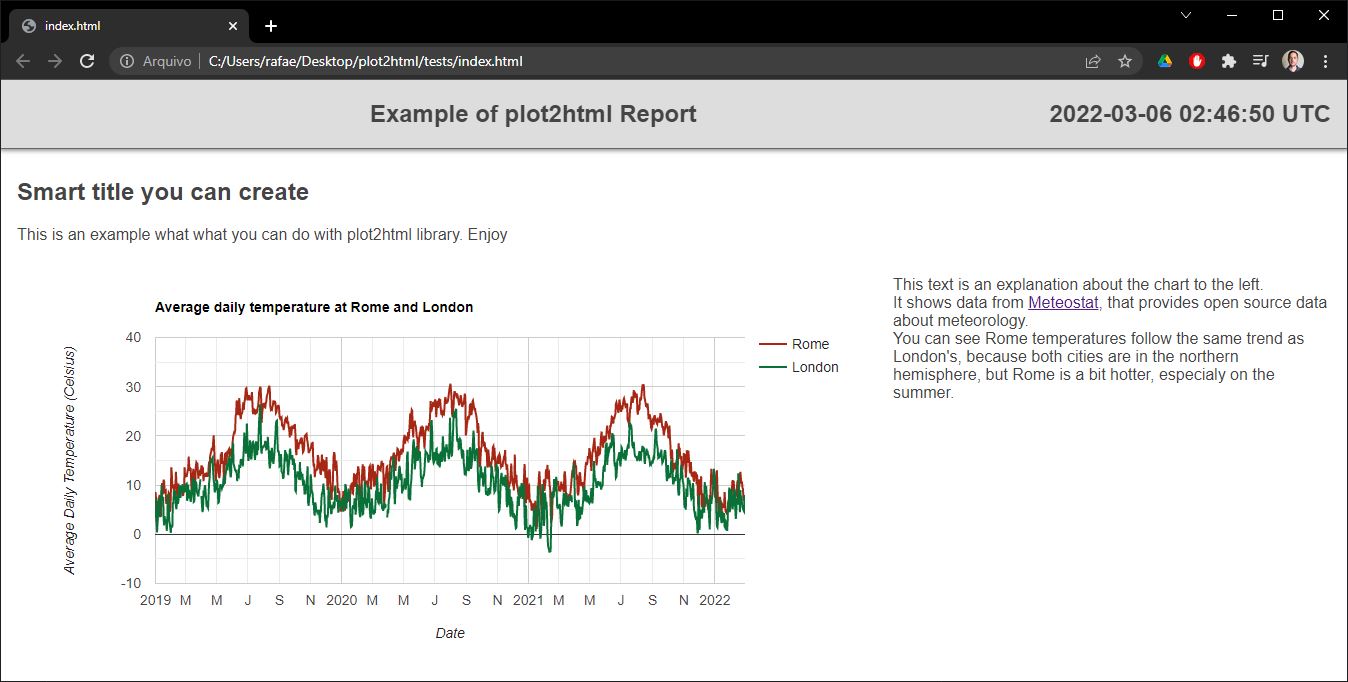
This is just the begining.
Release history Release notifications | RSS feed


Download files
Download the file for your platform. If you're not sure which to choose, learn more about installing packages.
Source Distribution
plot2html-0.0.7.tar.gz
(4.9 kB
view details)
Built Distribution
Filter files by name, interpreter, ABI, and platform.
If you're not sure about the file name format, learn more about wheel file names.
Copy a direct link to the current filters
File details
Details for the file plot2html-0.0.7.tar.gz.
File metadata
- Download URL: plot2html-0.0.7.tar.gz
- Upload date:
- Size: 4.9 kB
- Tags: Source
- Uploaded using Trusted Publishing? No
- Uploaded via: twine/3.8.0 pkginfo/1.8.2 readme-renderer/32.0 requests/2.27.1 requests-toolbelt/0.9.1 urllib3/1.26.8 tqdm/4.62.3 importlib-metadata/4.11.1 keyring/23.5.0 rfc3986/2.0.0 colorama/0.4.4 CPython/3.10.2
File hashes
| Algorithm | Hash digest | |
|---|---|---|
| SHA256 |
97de24cfd2b7015249a0738342015a7995971e422f816d4b0628db5203f5e293
|
|
| MD5 |
49f01df63cbf178d7504af9a5d6101d2
|
|
| BLAKE2b-256 |
c1e6d6ae8d44055ffeae29d2f99e2026d495e5f3fb5d867451fc600cfd4f238b
|
File details
Details for the file plot2html-0.0.7-py3-none-any.whl.
File metadata
- Download URL: plot2html-0.0.7-py3-none-any.whl
- Upload date:
- Size: 5.0 kB
- Tags: Python 3
- Uploaded using Trusted Publishing? No
- Uploaded via: twine/3.8.0 pkginfo/1.8.2 readme-renderer/32.0 requests/2.27.1 requests-toolbelt/0.9.1 urllib3/1.26.8 tqdm/4.62.3 importlib-metadata/4.11.1 keyring/23.5.0 rfc3986/2.0.0 colorama/0.4.4 CPython/3.10.2
File hashes
| Algorithm | Hash digest | |
|---|---|---|
| SHA256 |
8ae3f65c6ead0c228f9856cb3a81f9bba7c7b9b64e5383c76c1d6e3b9b6b03b0
|
|
| MD5 |
b92d66bb7e343ea14effe442b6928062
|
|
| BLAKE2b-256 |
7c62304a872191b1e9d5ac2c034f8bd190255ac9c5af08885fa67e4d813c9b81
|






