Plot4GMNS: An open-source academic research tool for visualizing multimodal networks for transportation system modeling and optimization


Project description
Plot4GMNS: An open-source academic research tool for visualizing multimodal networks for transportation system modeling and optimization


Authors: Dr. Junhua Chen, Zanyang Cui, Xiangyong Luo
Email: cjh@bjtu.edu.cn, zanyangcui@outlook.com, luoxiangyong01@gmail.com
Table of Contents
Introduction
To enable rapid transportation modeling and optimization, as traffic management researchers, we provide this free open-source tool for visualizing multimodal networks. Based on GMNS data format by Zepha foundation, plot4gmns is designed for reading and plotting multimodal data sets including transportation network files, demand and agent trace files.
Requirements
- pandas
- shapely
- matplotlib
- numpy
- seaborn
- scipy
- chardet
- keplergl==0.3.2
Install
pip install plot4gmns
Note
- For Windows users, the pip method might fail to install some dependencies. If errors occur when you try to install any of those dependencies, try instead to pip install their .whl files, which can be downloaded from the Unoffical Windows Binaries for Python Extension Packages.
Features
- **show GMNS data elements (coordinates or geometry included)
- web-based network visualization
- show networks in different modes
- show network with given node types
- show network by given link types
- show network by given link attributes range
- show network by link attributes distribution
- show network with given POI types
- show network by poi attributes distribution
- show network demand matrix heatmap
- show network demand OD
- Show only network elements of interest
- Show different networks on one diagram
- Set the drawing style
Usage
Before starting, you must have prepared network files, including node.csv, link.csv, poi.csv, demand.csv, and zone.csv. The osm2gmns package will help you quickly obtain node, link, and poi data, and the grid2demand package will help you obtain network demand and zone information.
Quickstart
Step 0: generate multimodal network
import plot4gmns as p4g
mnet=p4g.generate_multi_network_from_csv(r'./datasets')
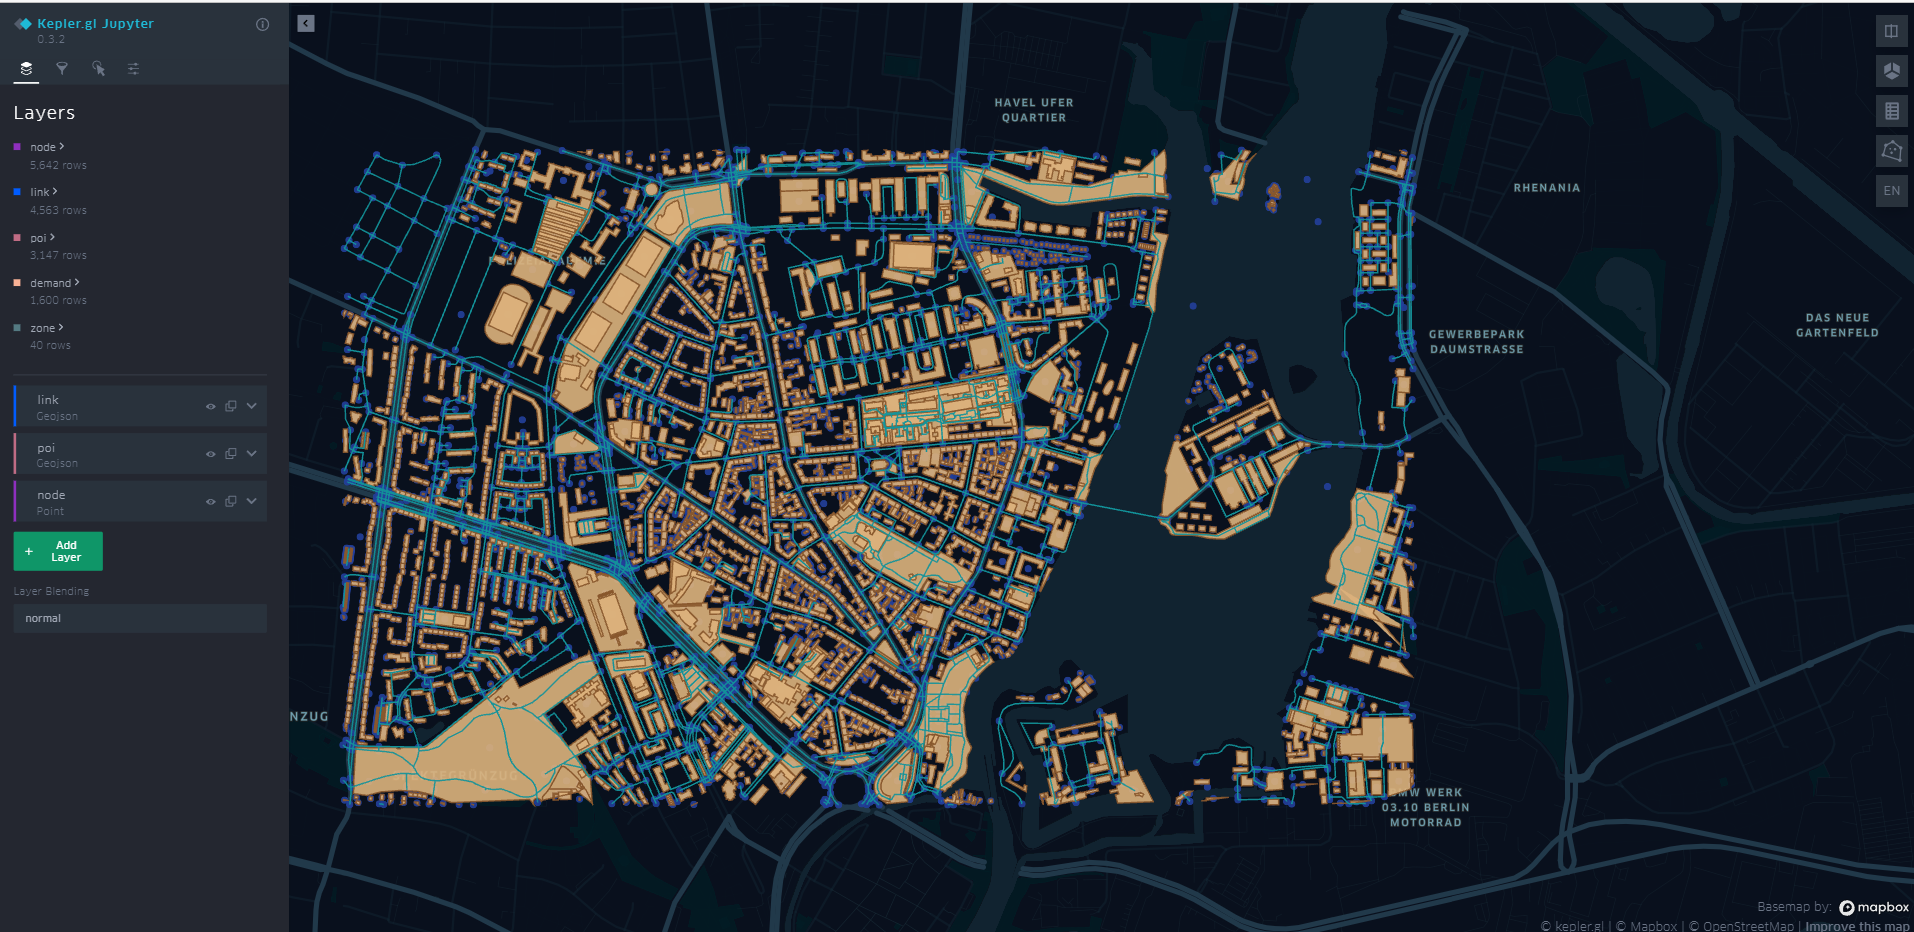
After executing the above command, you will get an Html file, as shown below. More visual operations are supported on the web site..
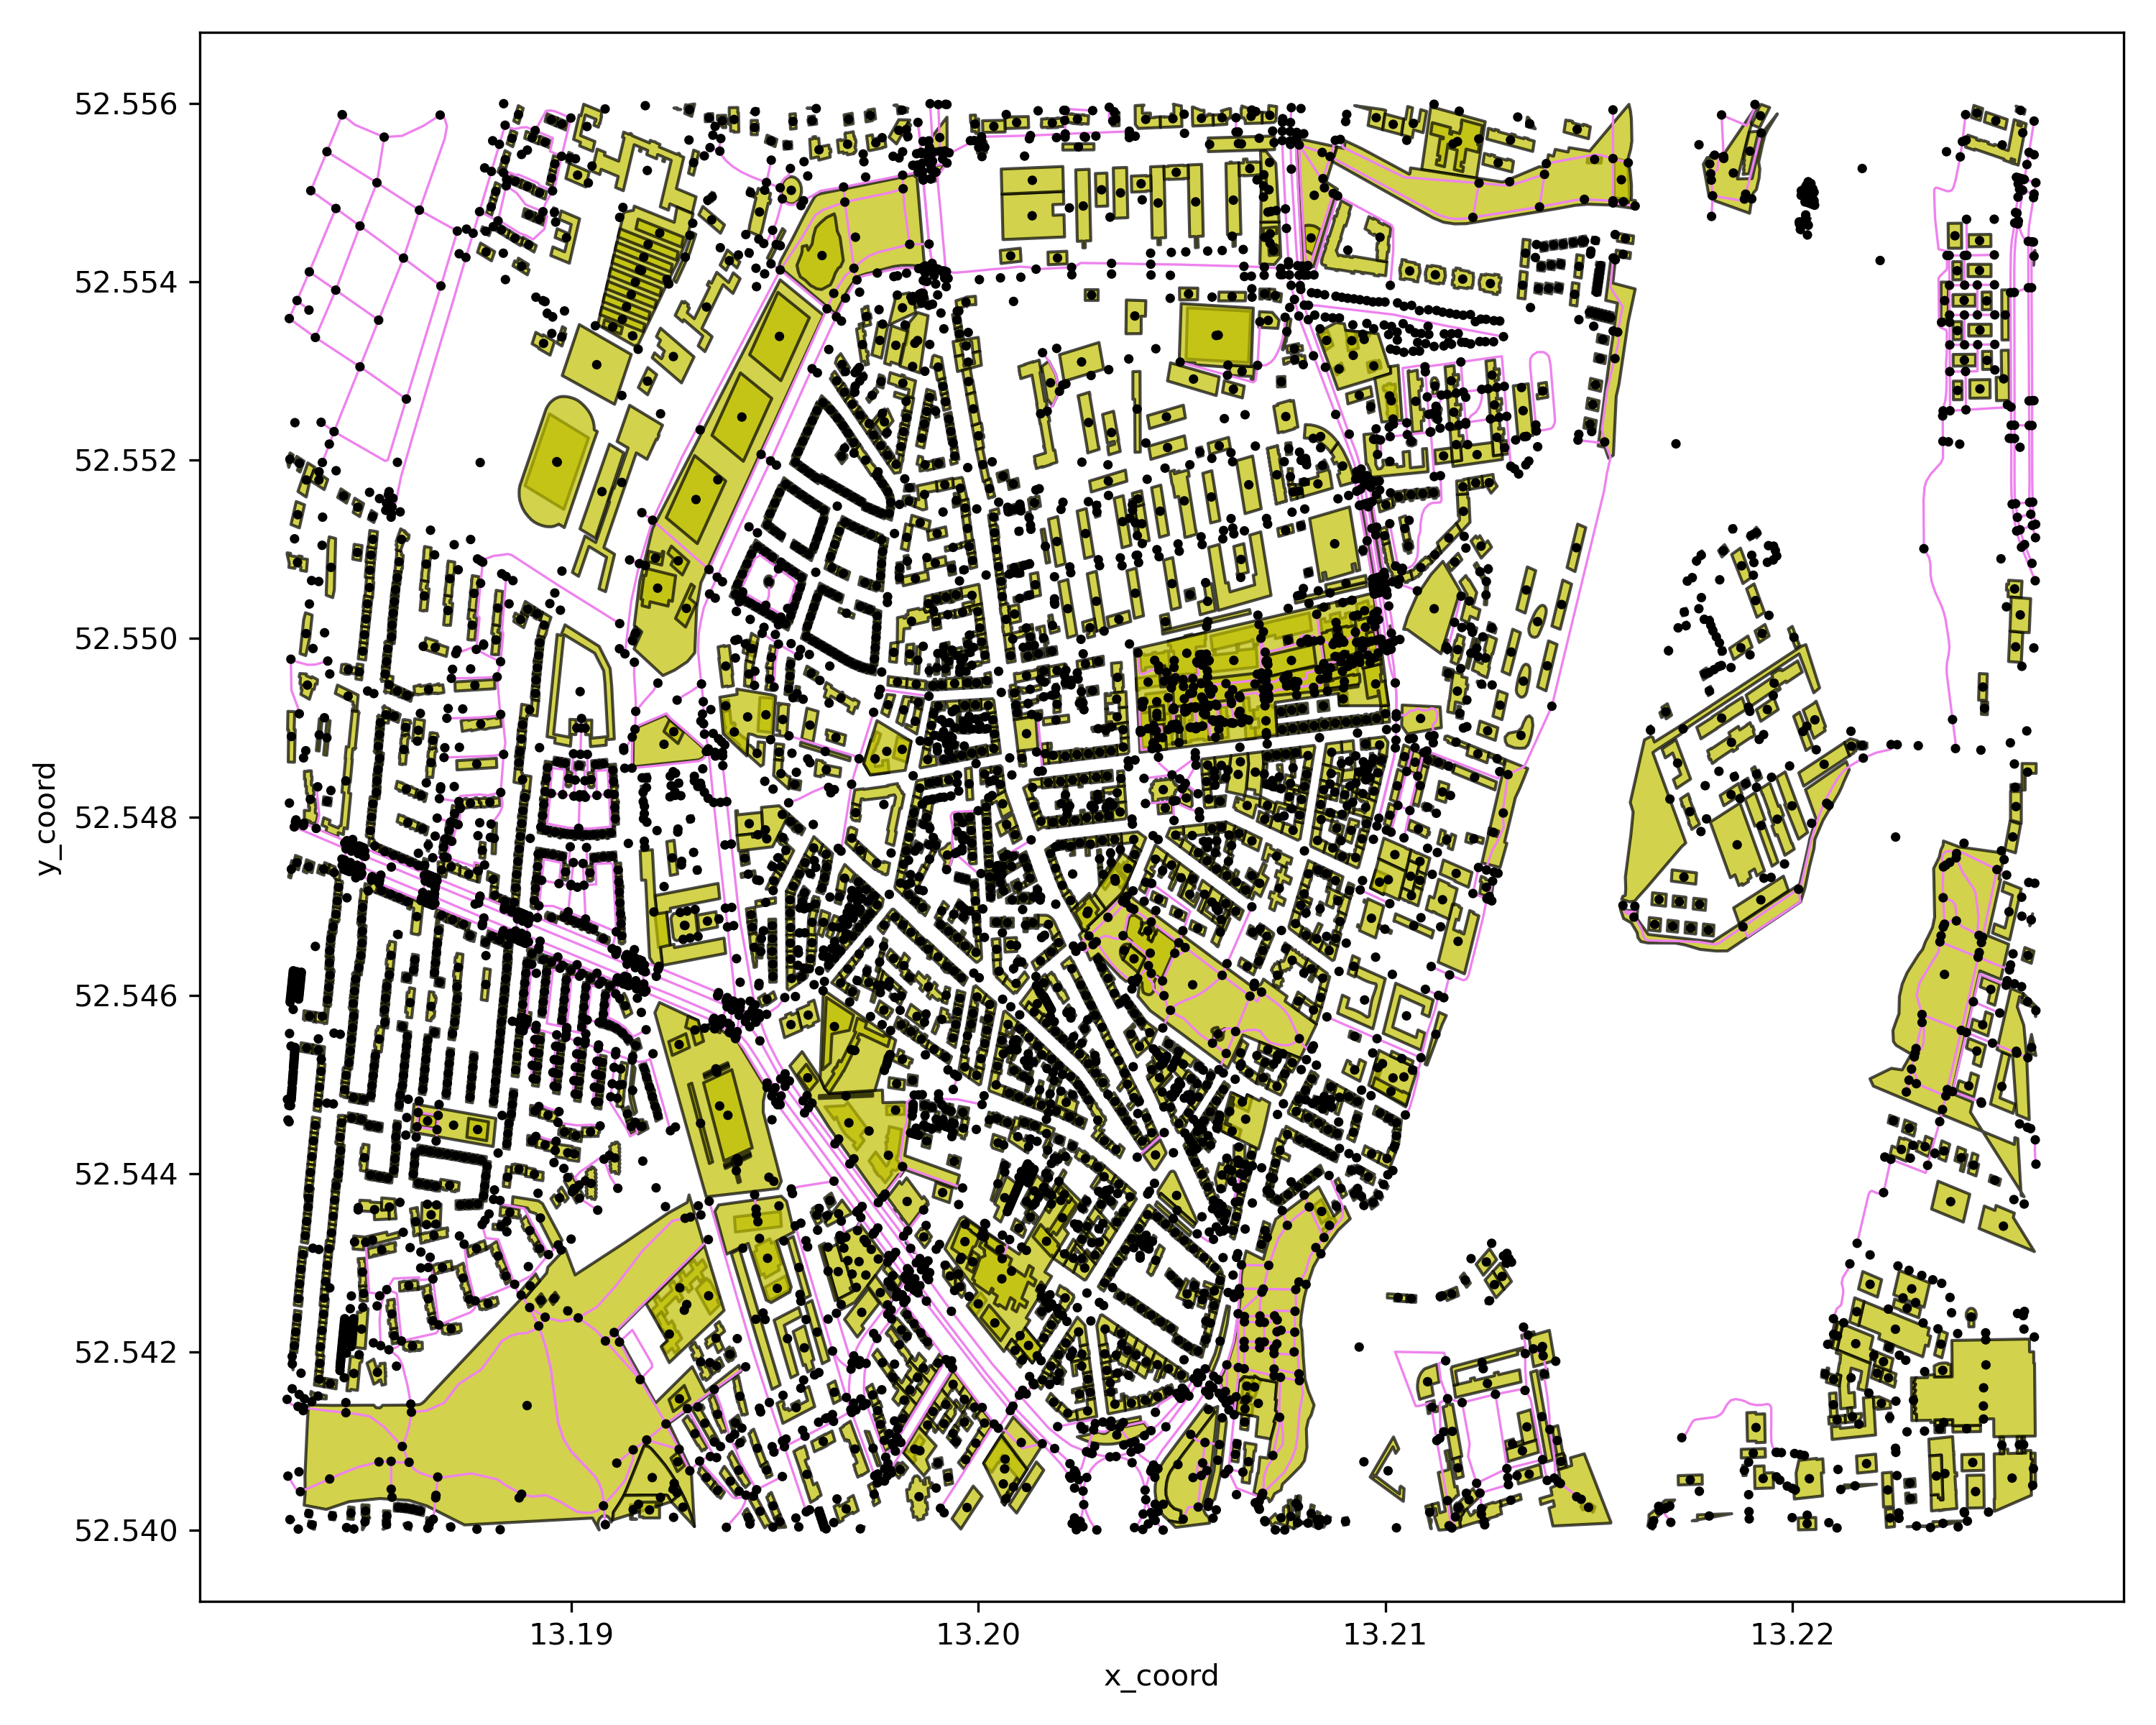
**Step 1: Show GMNS data elements (GMNS DATA Elements)
The supported data elements are: node, link, lane, zone, location, geometry, poi, movement, demand
# we can visualize GMNS elements and any combination of each data elements
# GMNS specification: https://github.com/zephyr-data-specs/GMNS/tree/main/spec
# For data elements including geometry: node, link, lane, zone, location, geometry, poi, movement, demand
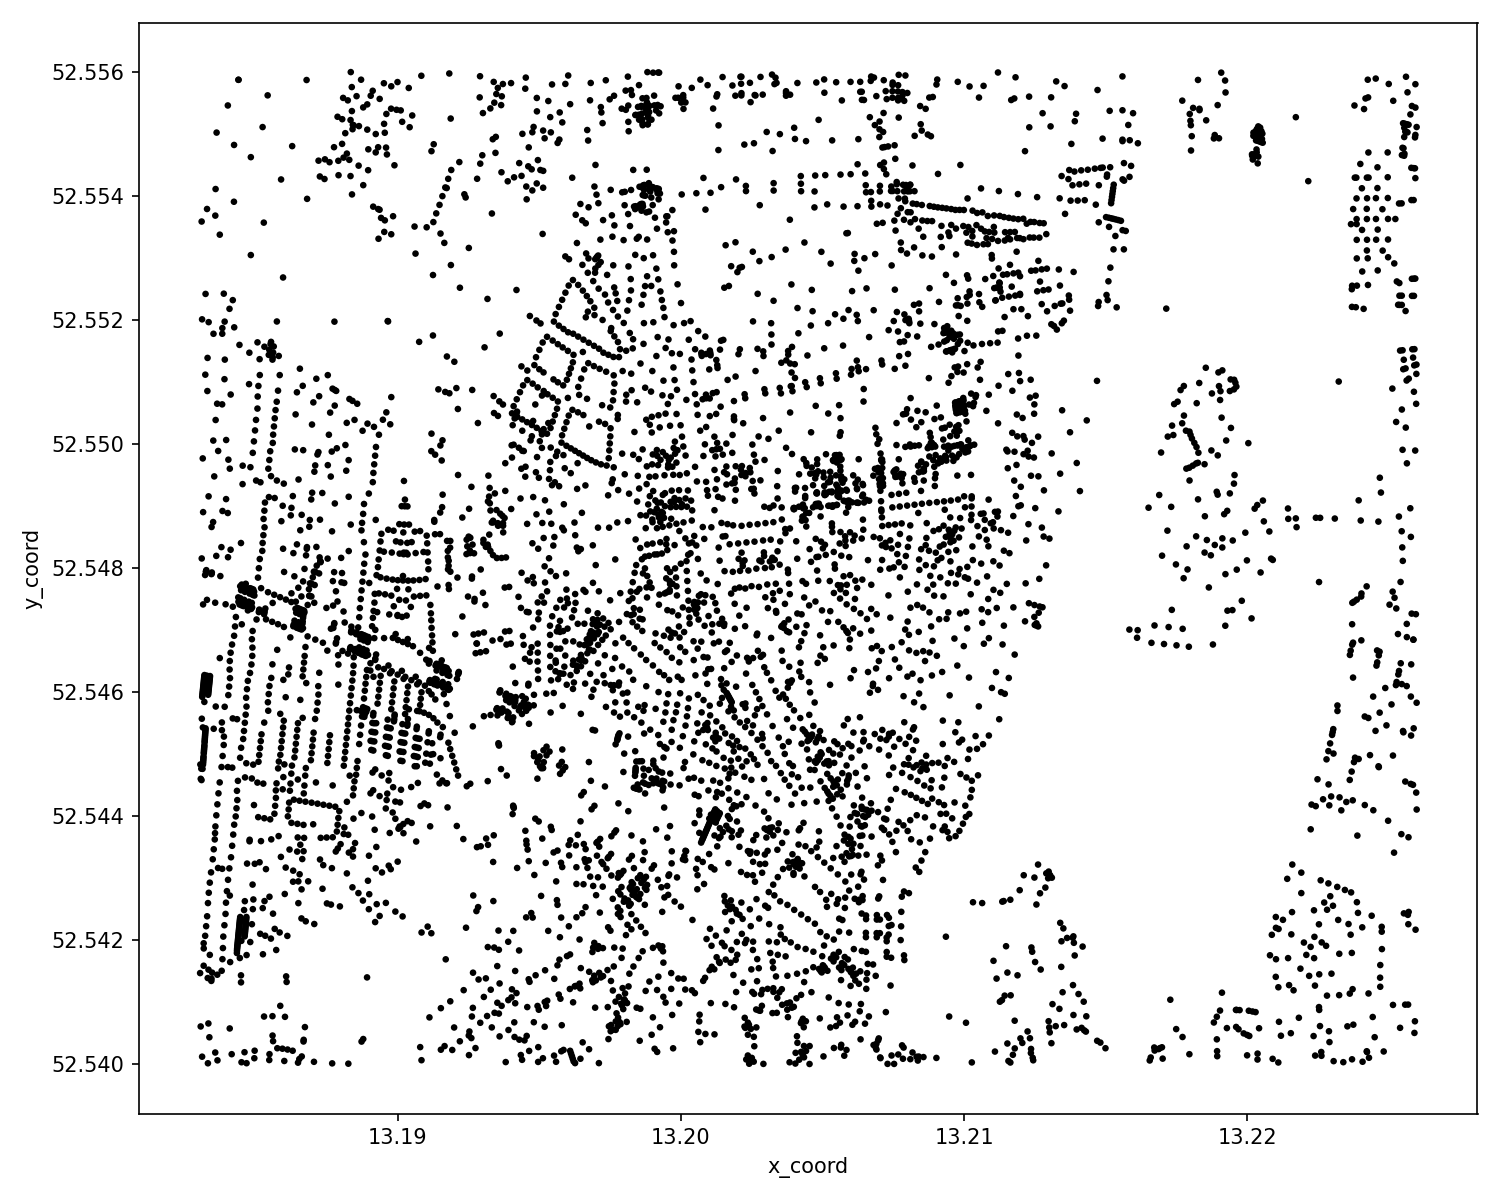
cf_node = p4g.show_gmns_nodes(mnet)
cf_node.show()
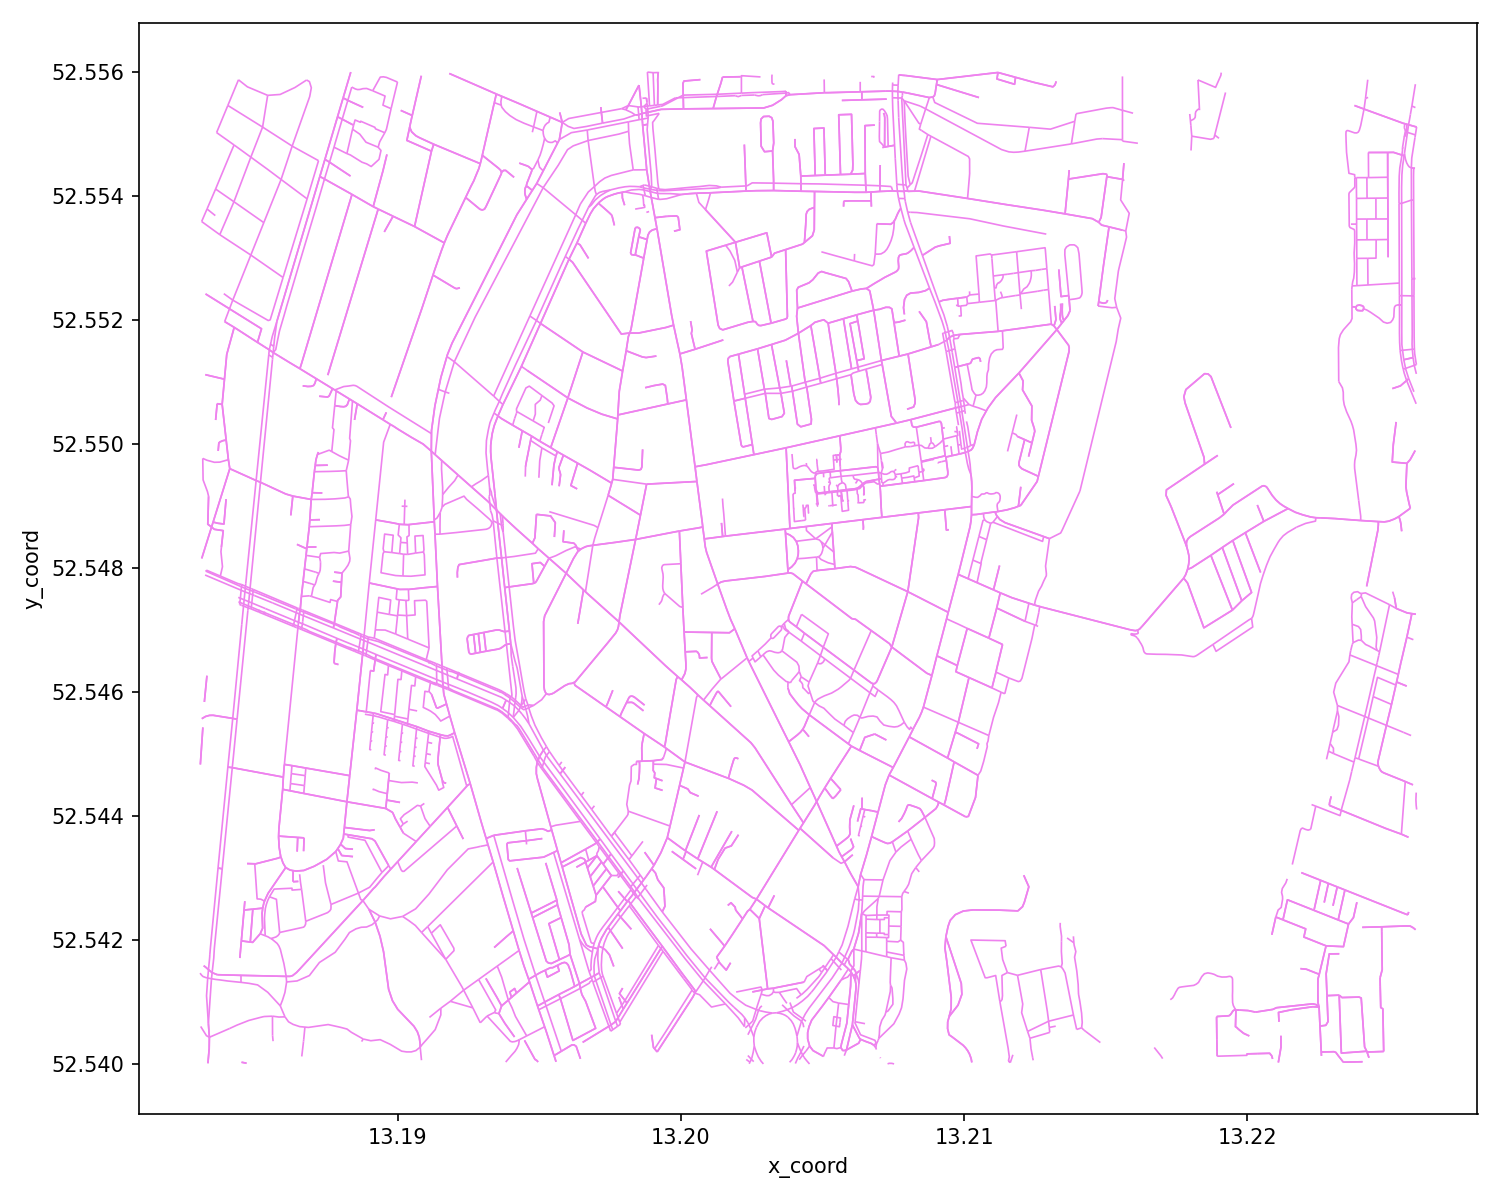
cf_link = p4g.show_gmns_links(mnet)
cf_link.show()
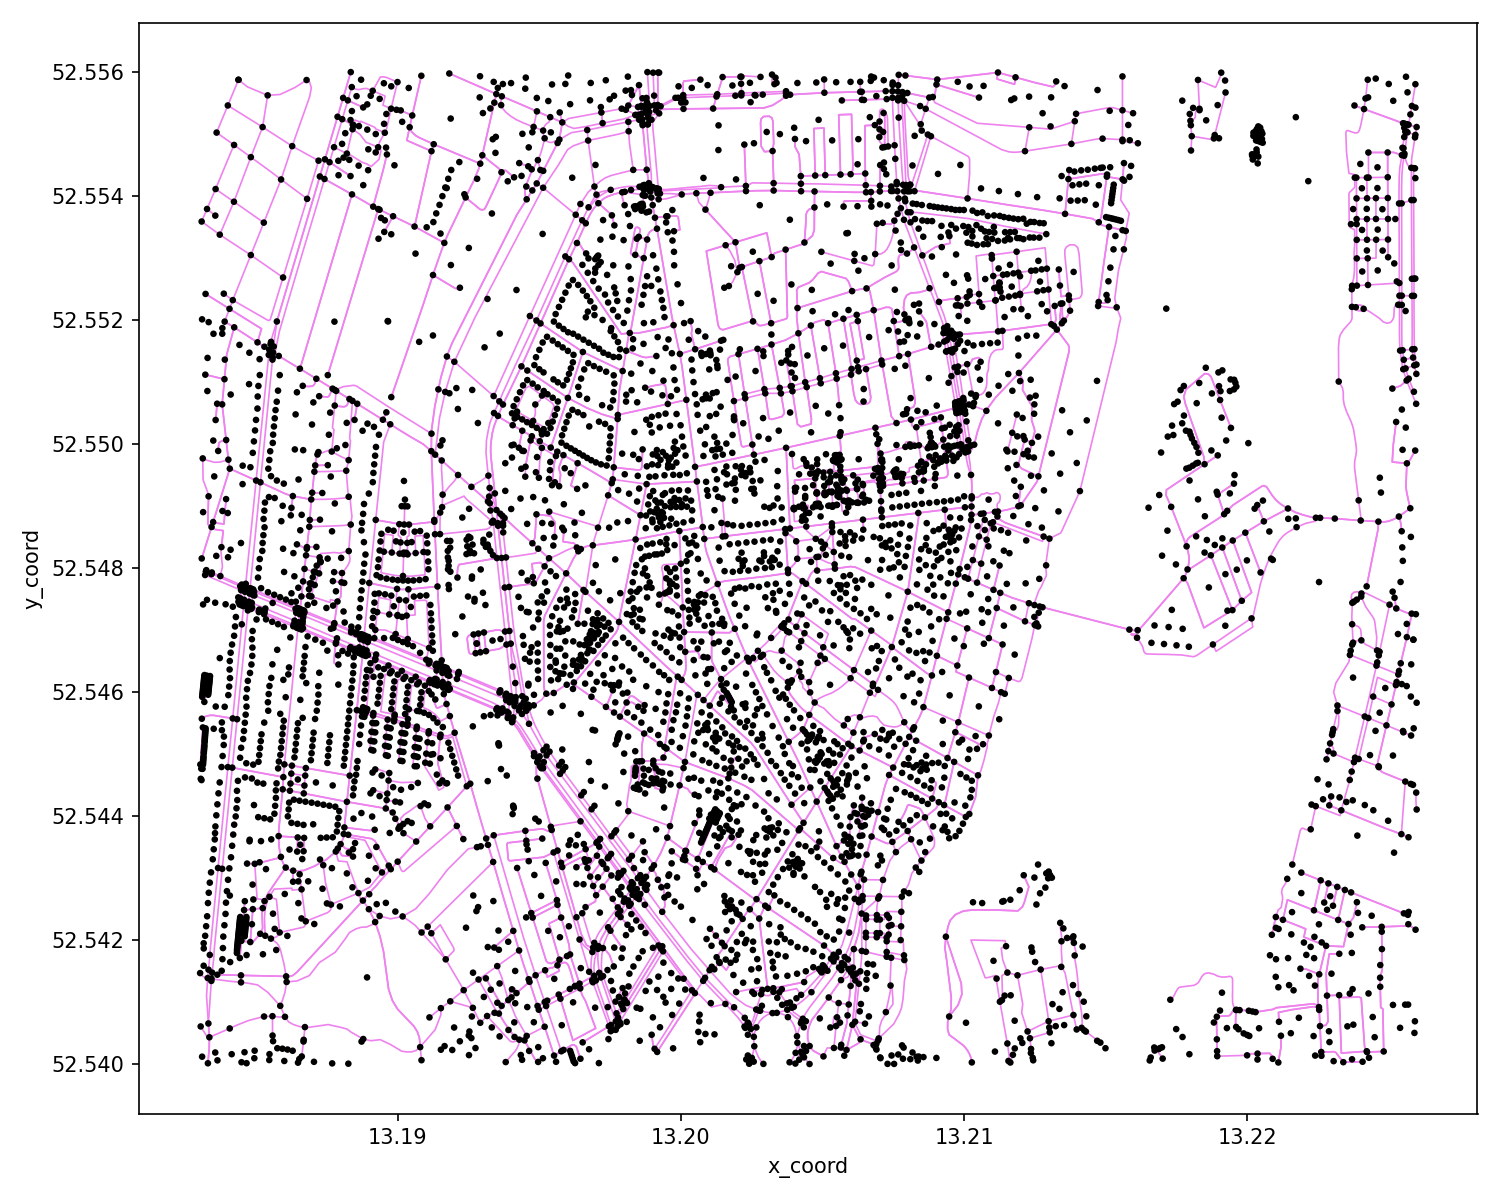
# you can also show the combined network
cf_node_link = p4g.show_gmns_links(mnet, fig_obj=cf_node)
cf_node_link.show()
Step 2: show networks in different modes
# draw 'all' modes network and save to png file
cf = p4g.show_network_by_modes(mnet=mnet)
# show the figure on the current window
cf.show()
# show 'bike' mode network
cf = p4g.show_network_by_modes(mnet=mnet,modes=['bike'])
cf.show() # show the figure on the current window
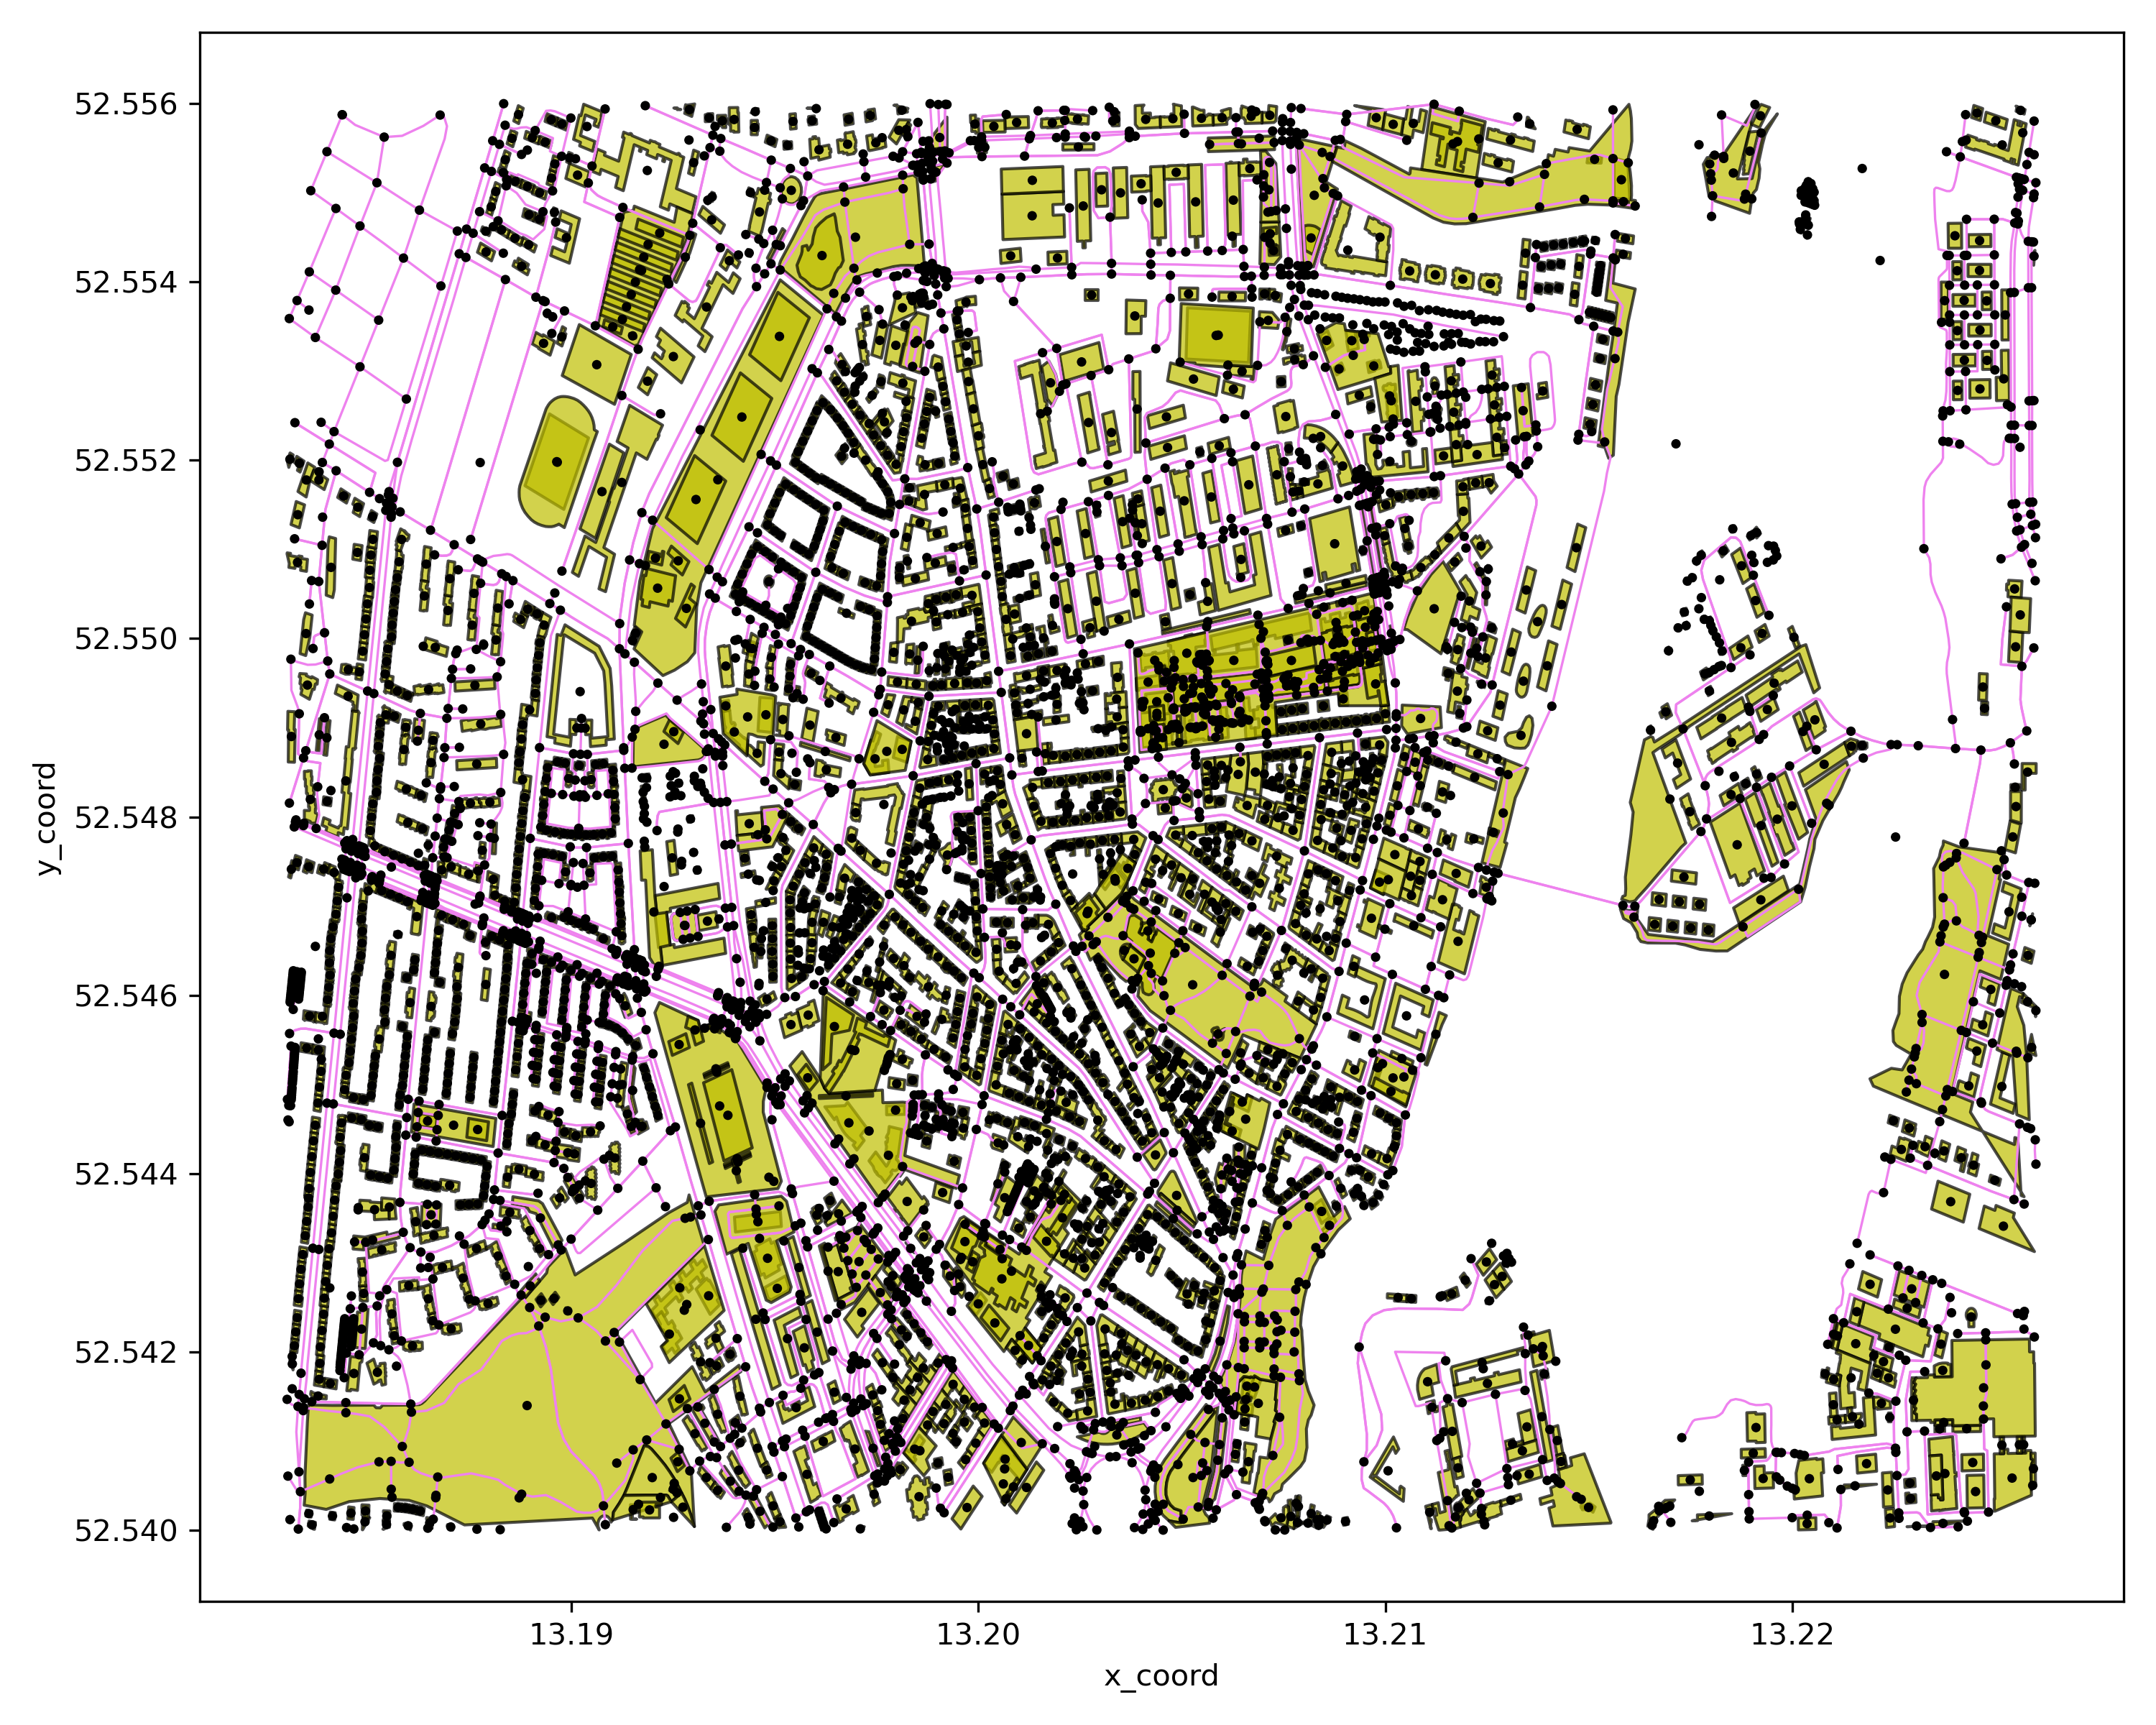
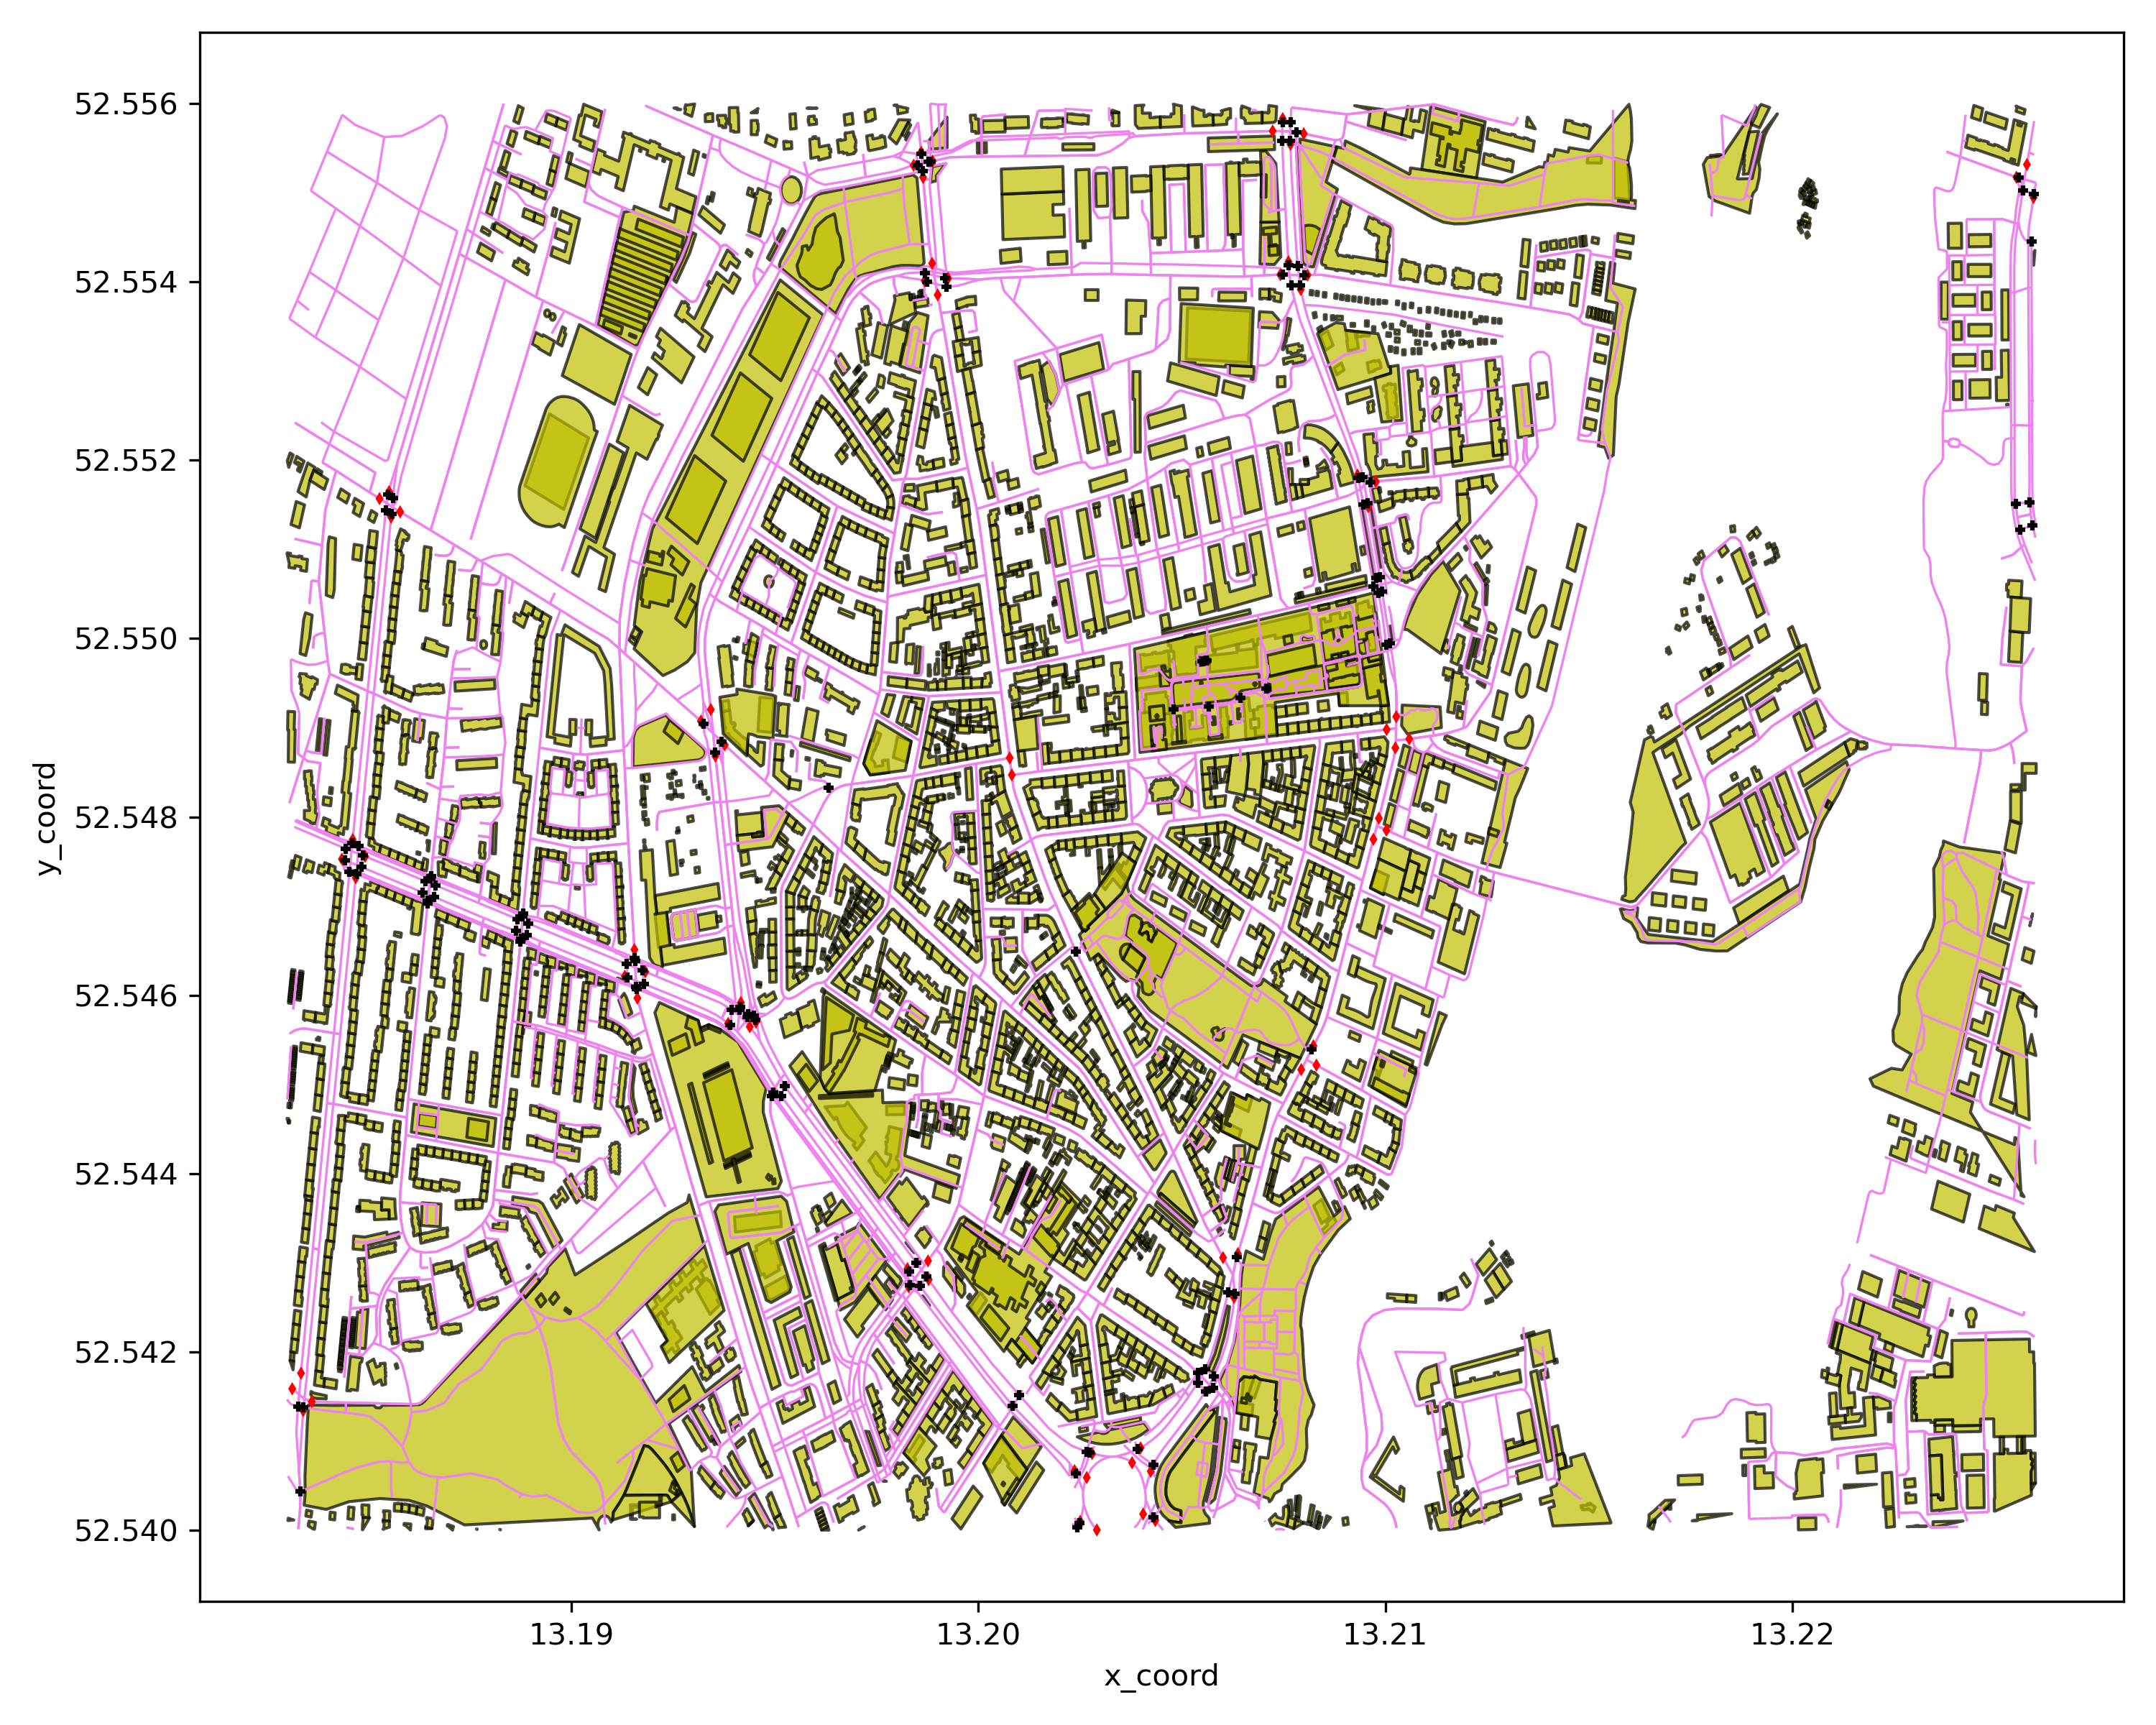
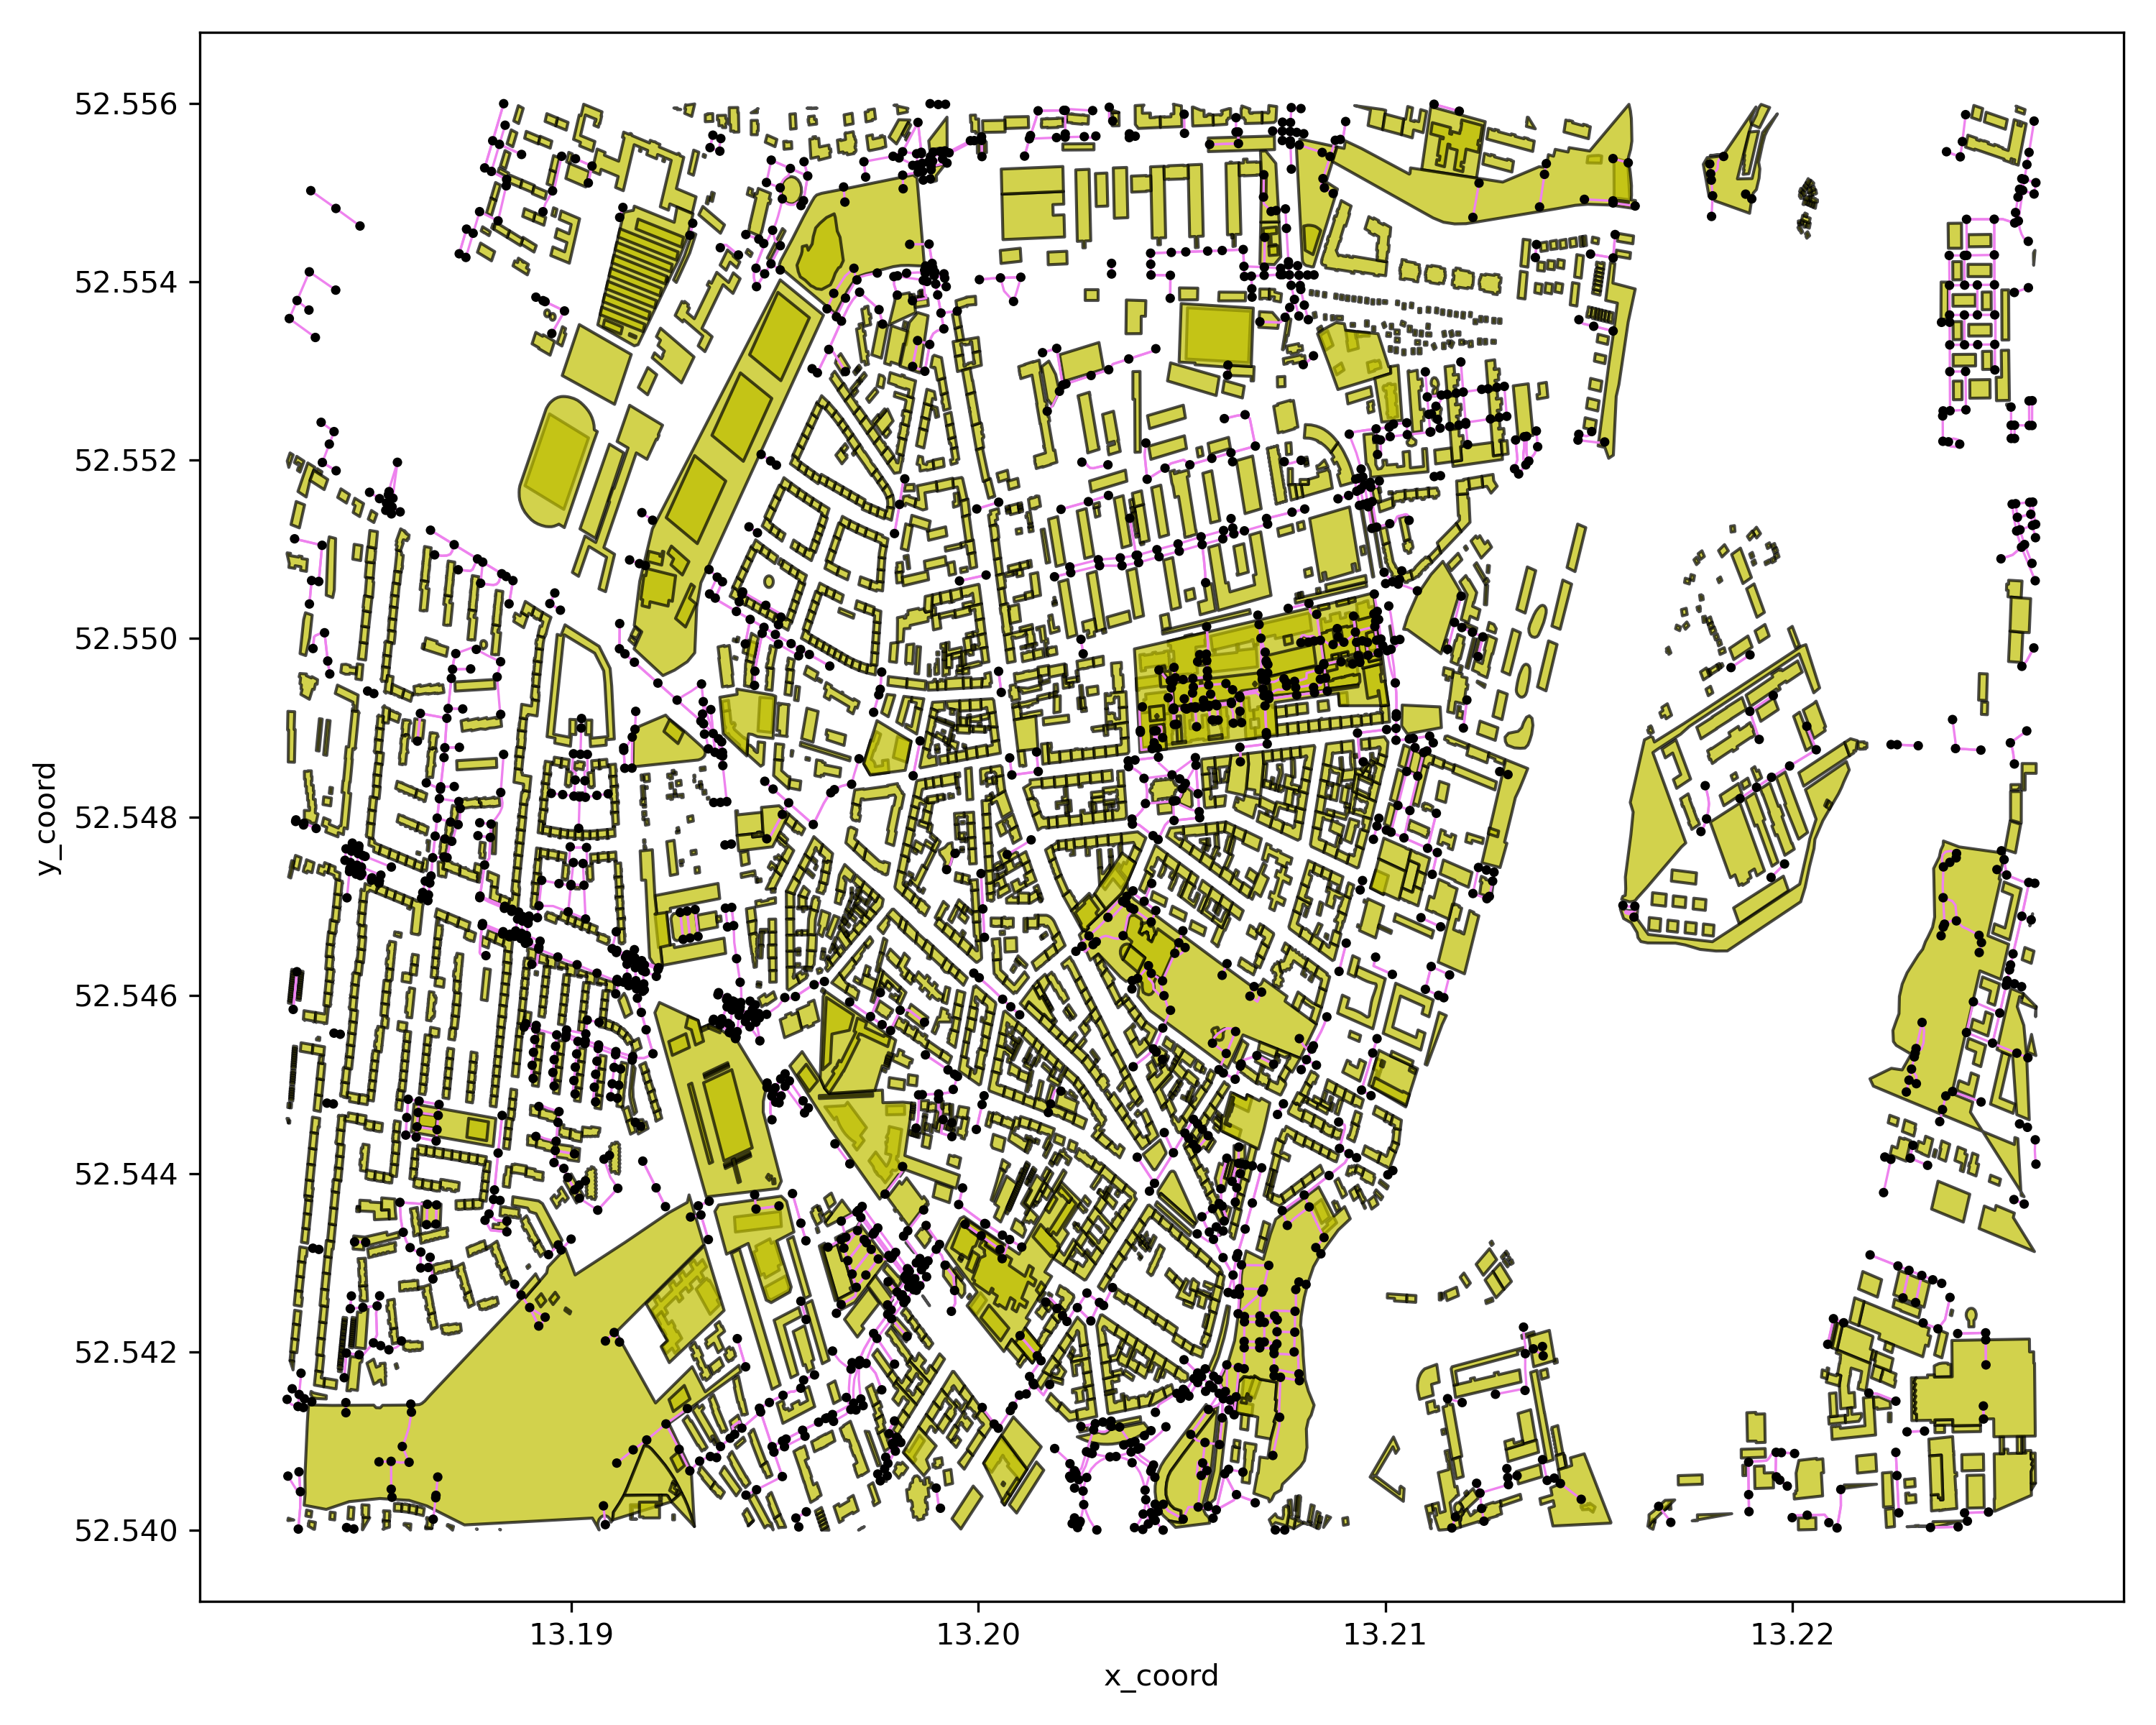
Step 3: show network with given node types
cf = p4g.show_network_by_node_types(mnet=mnet,ctrl_type=['traffic_signals','crossing'])
cf.show()
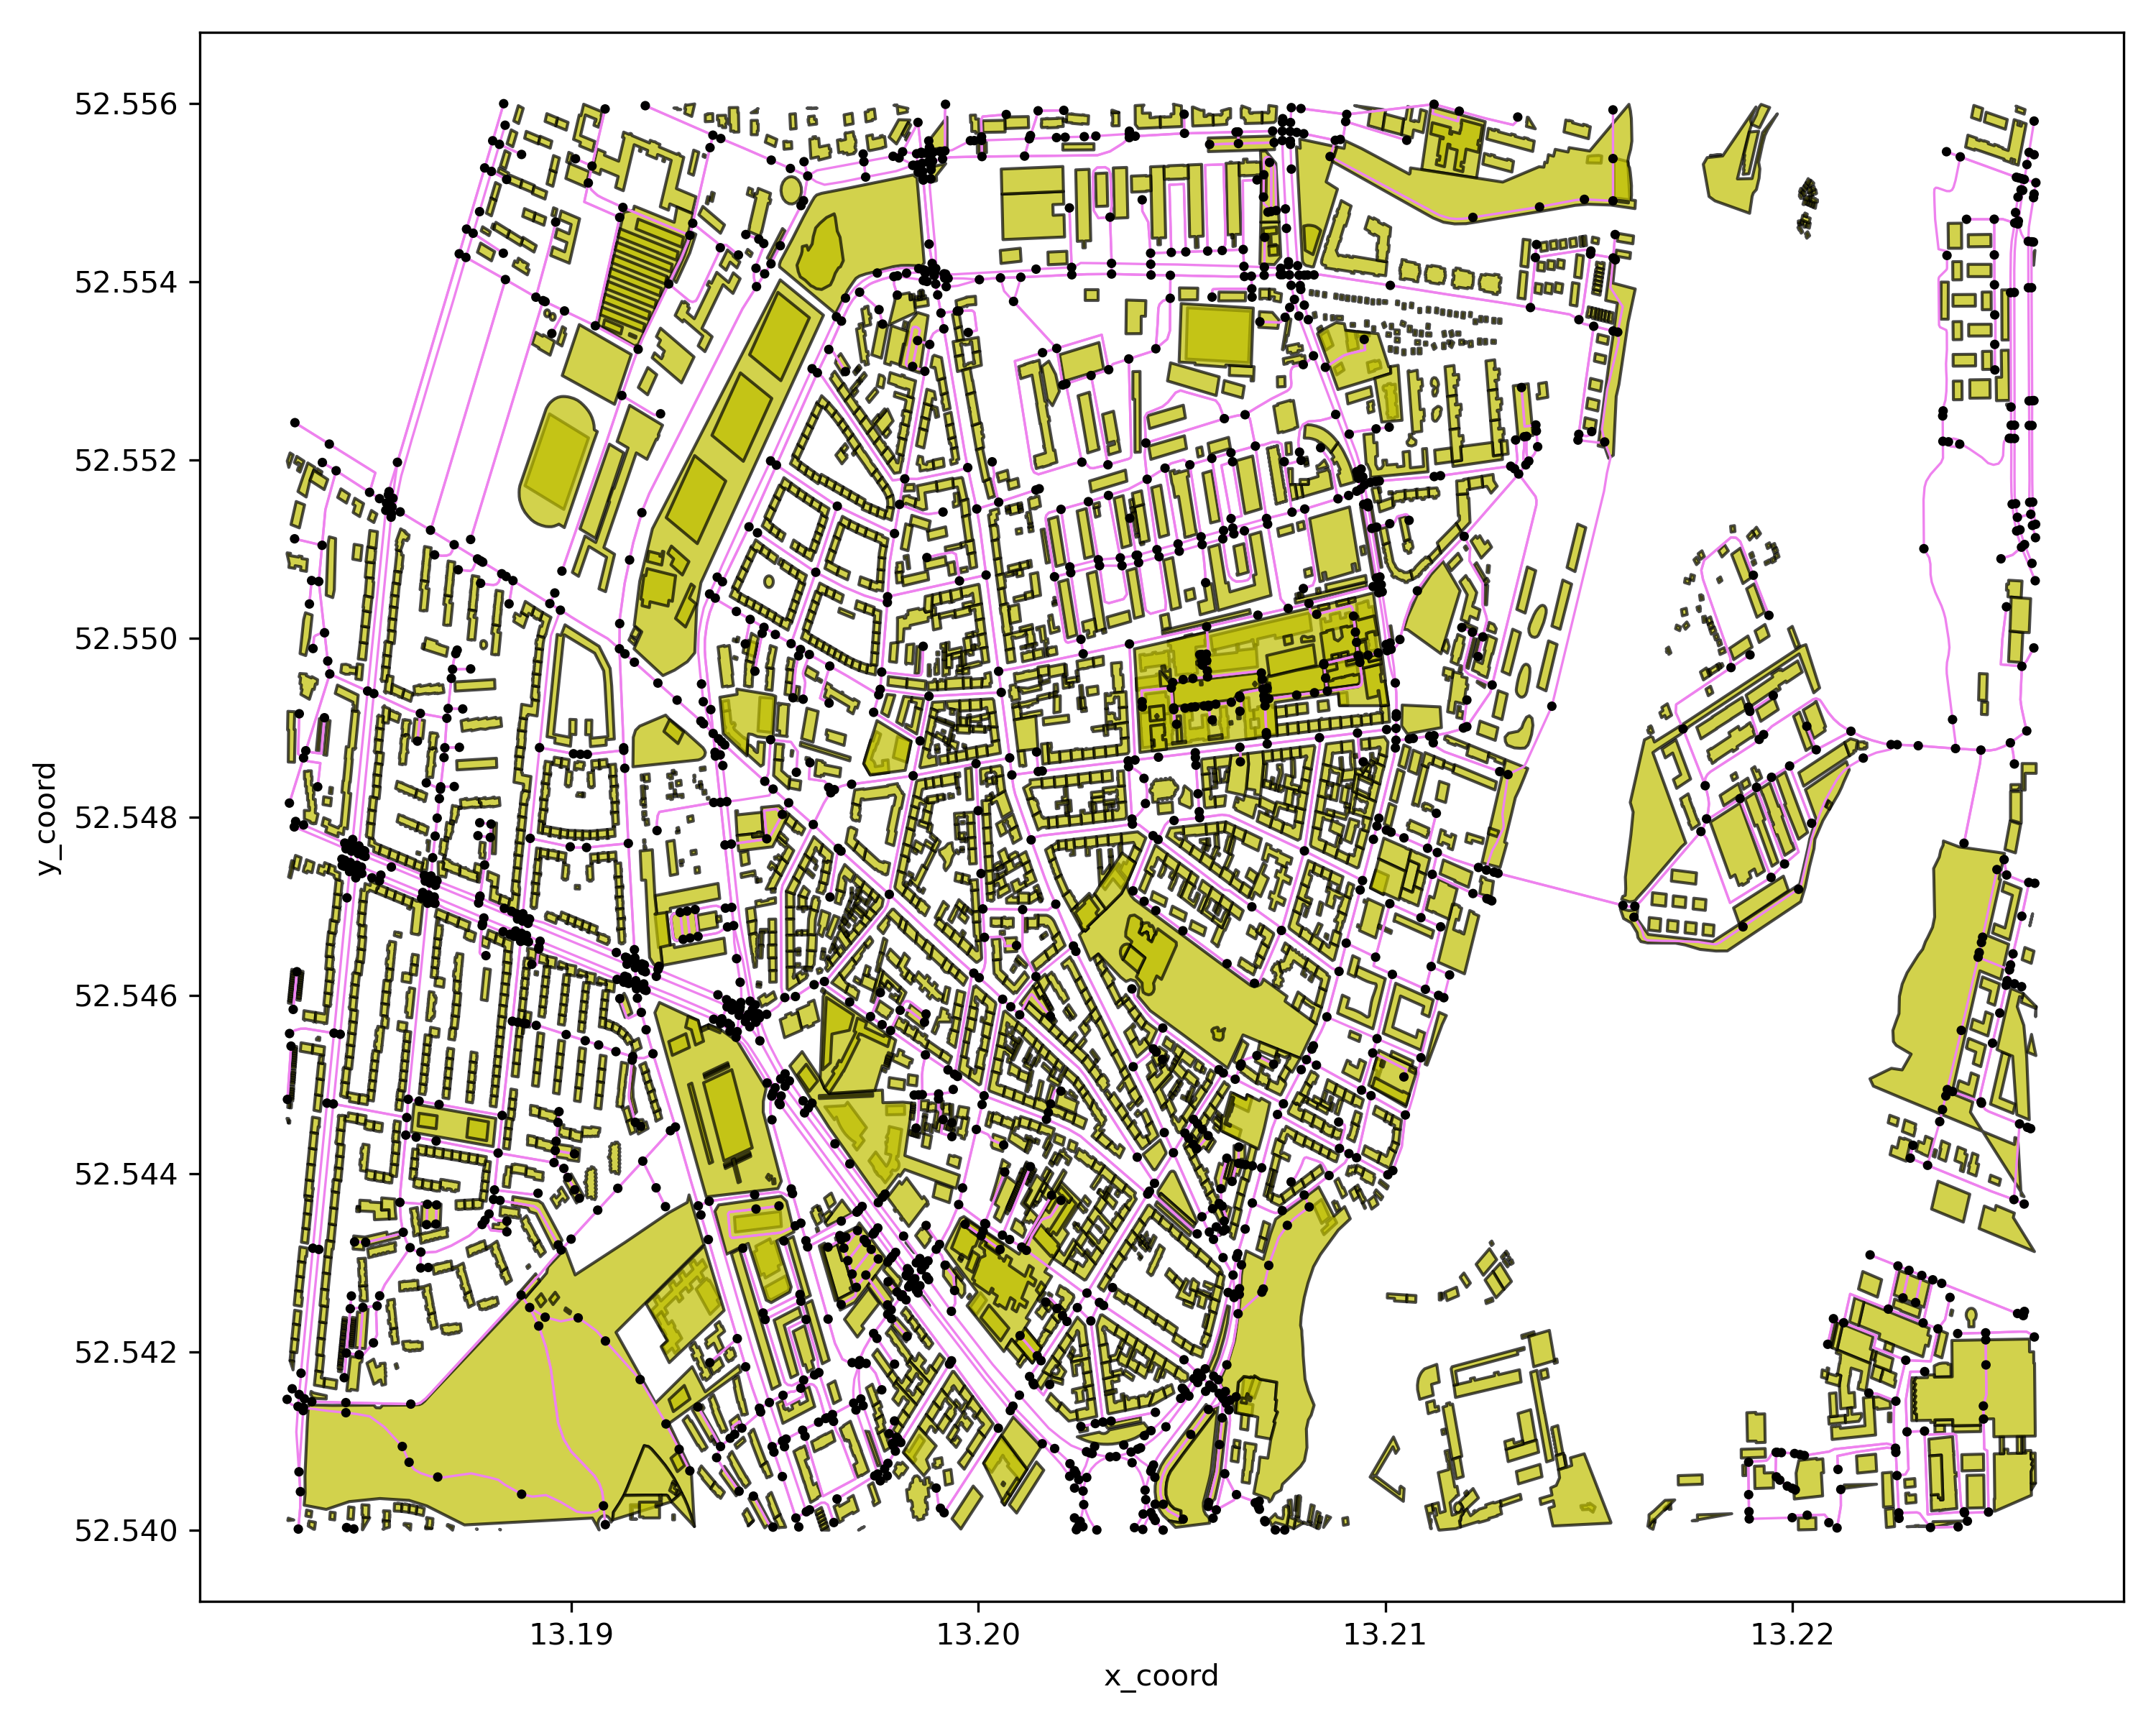
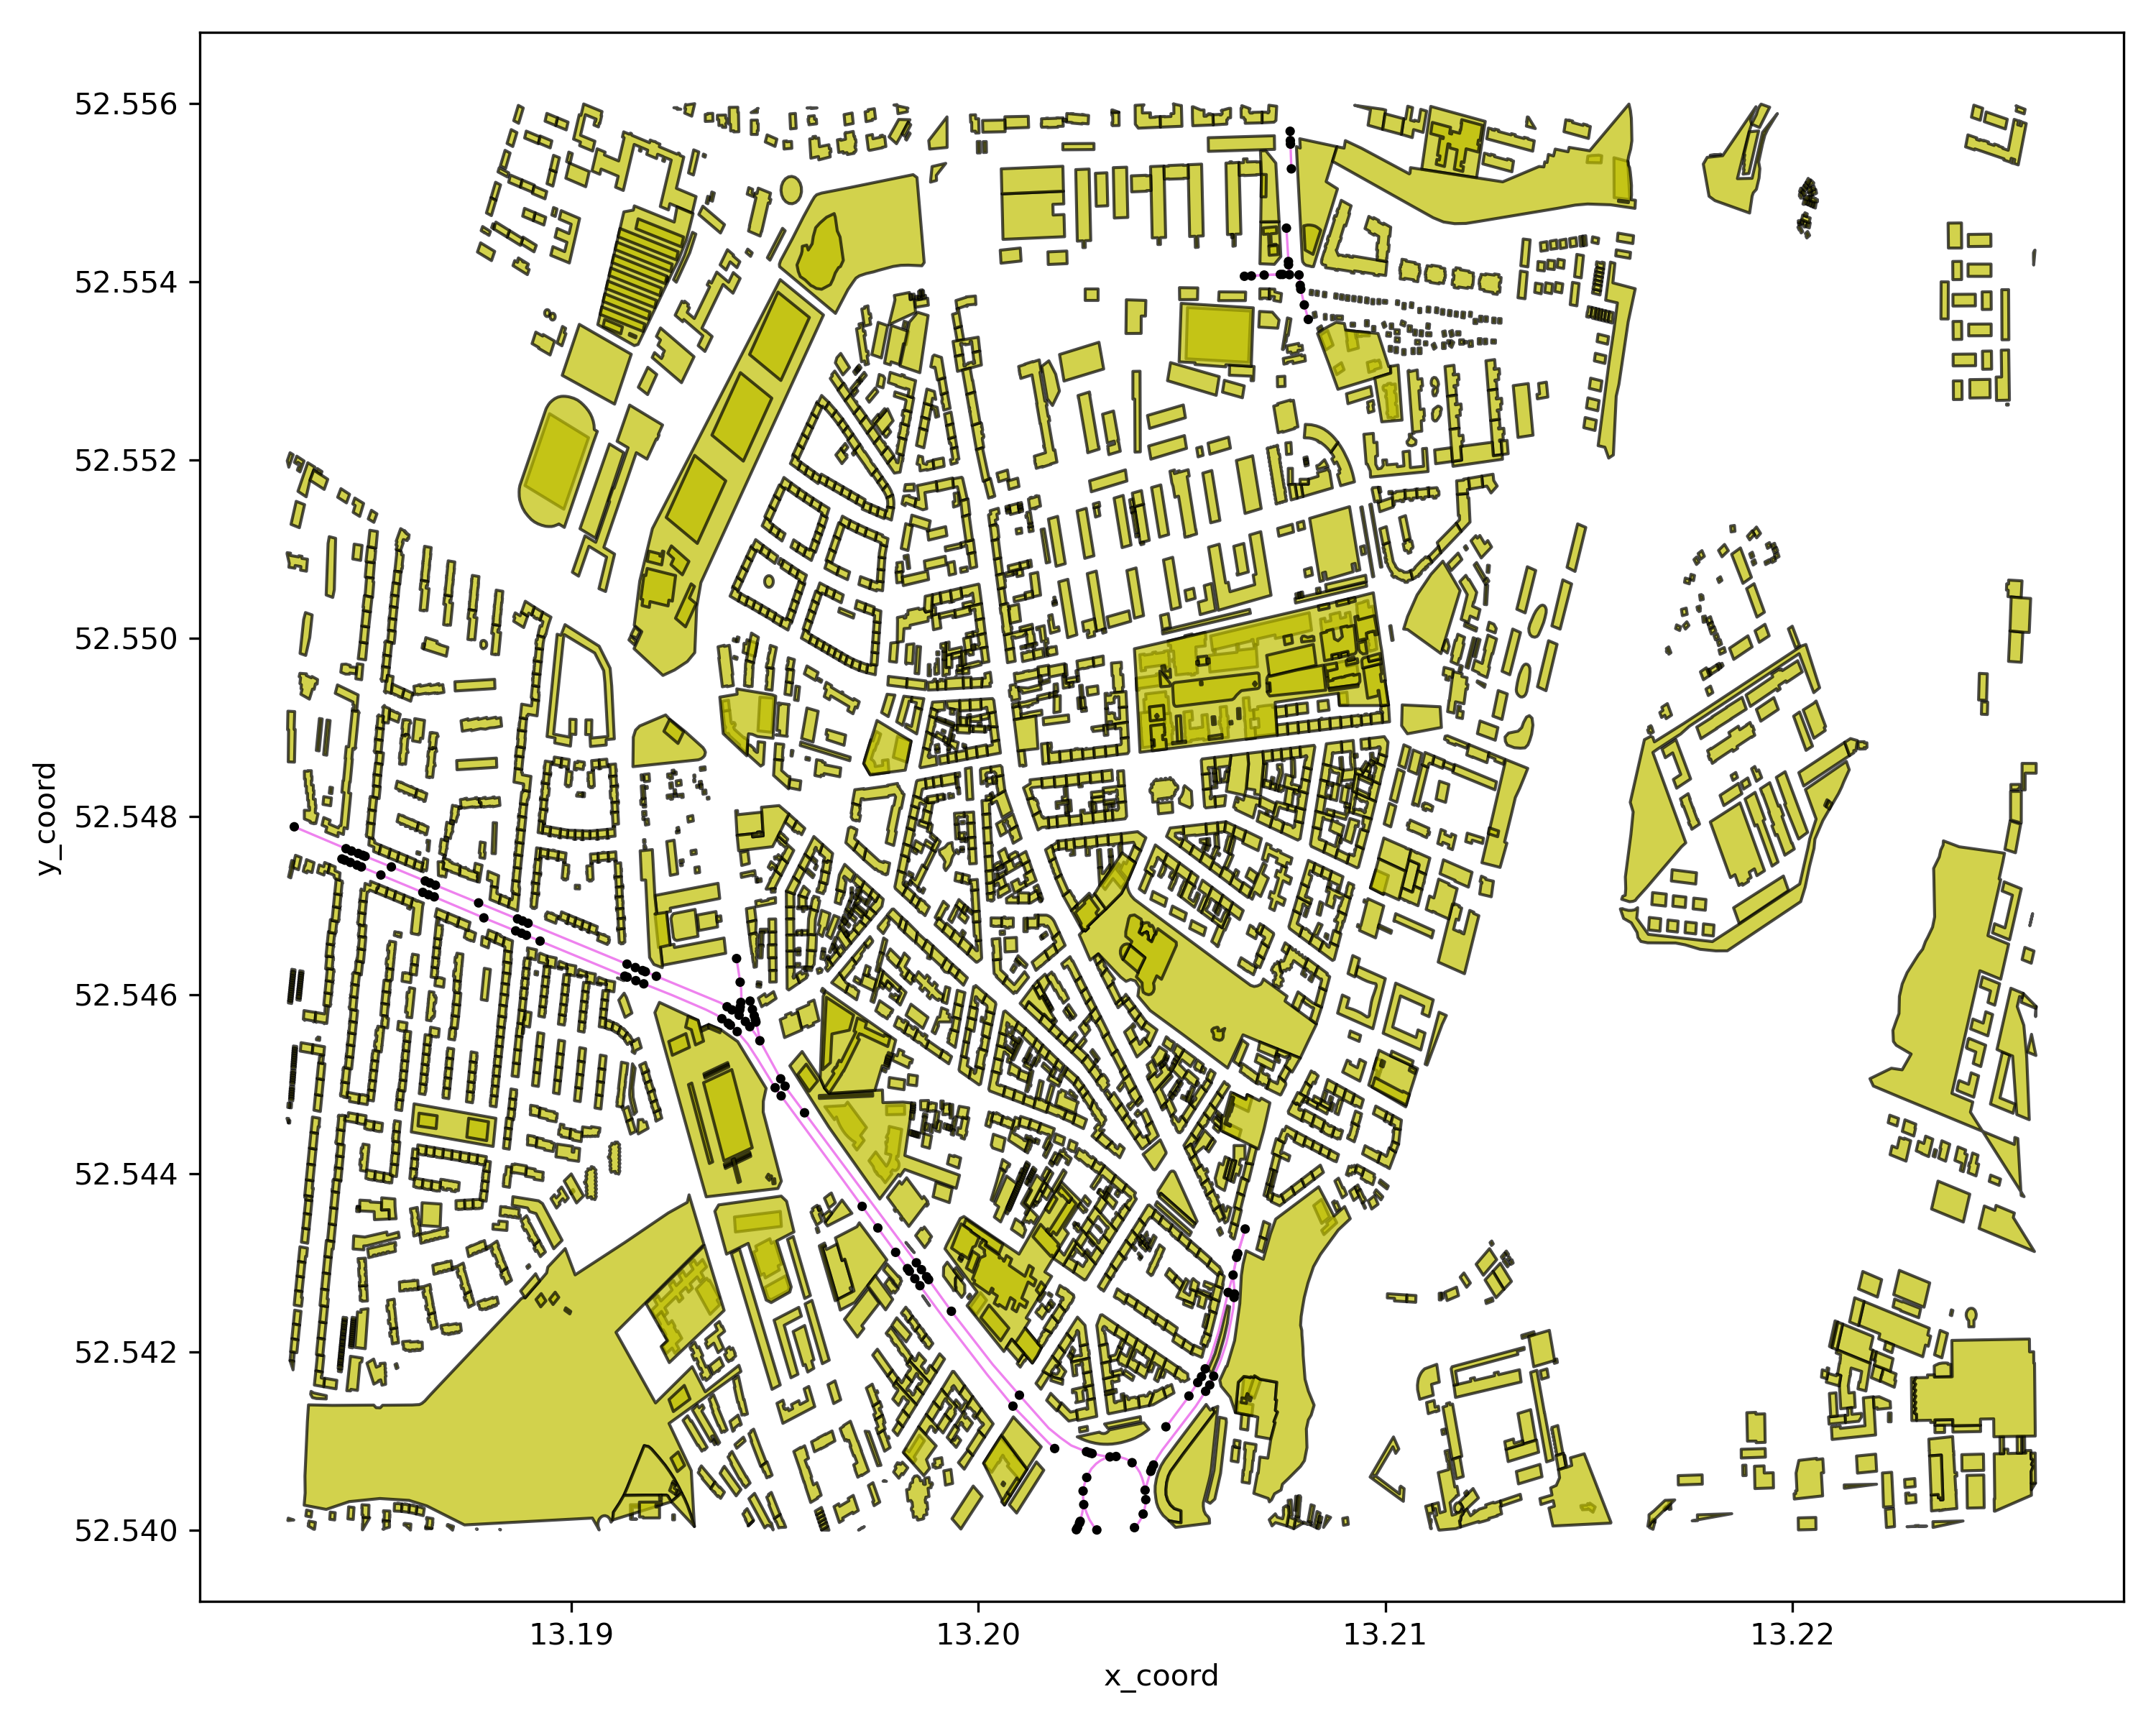
Step 4: show network by given link types
# show network by given link types
cf = p4g.show_network_by_link_types(mnet=mnet,link_types=['secondary','footway'])
cf.show()
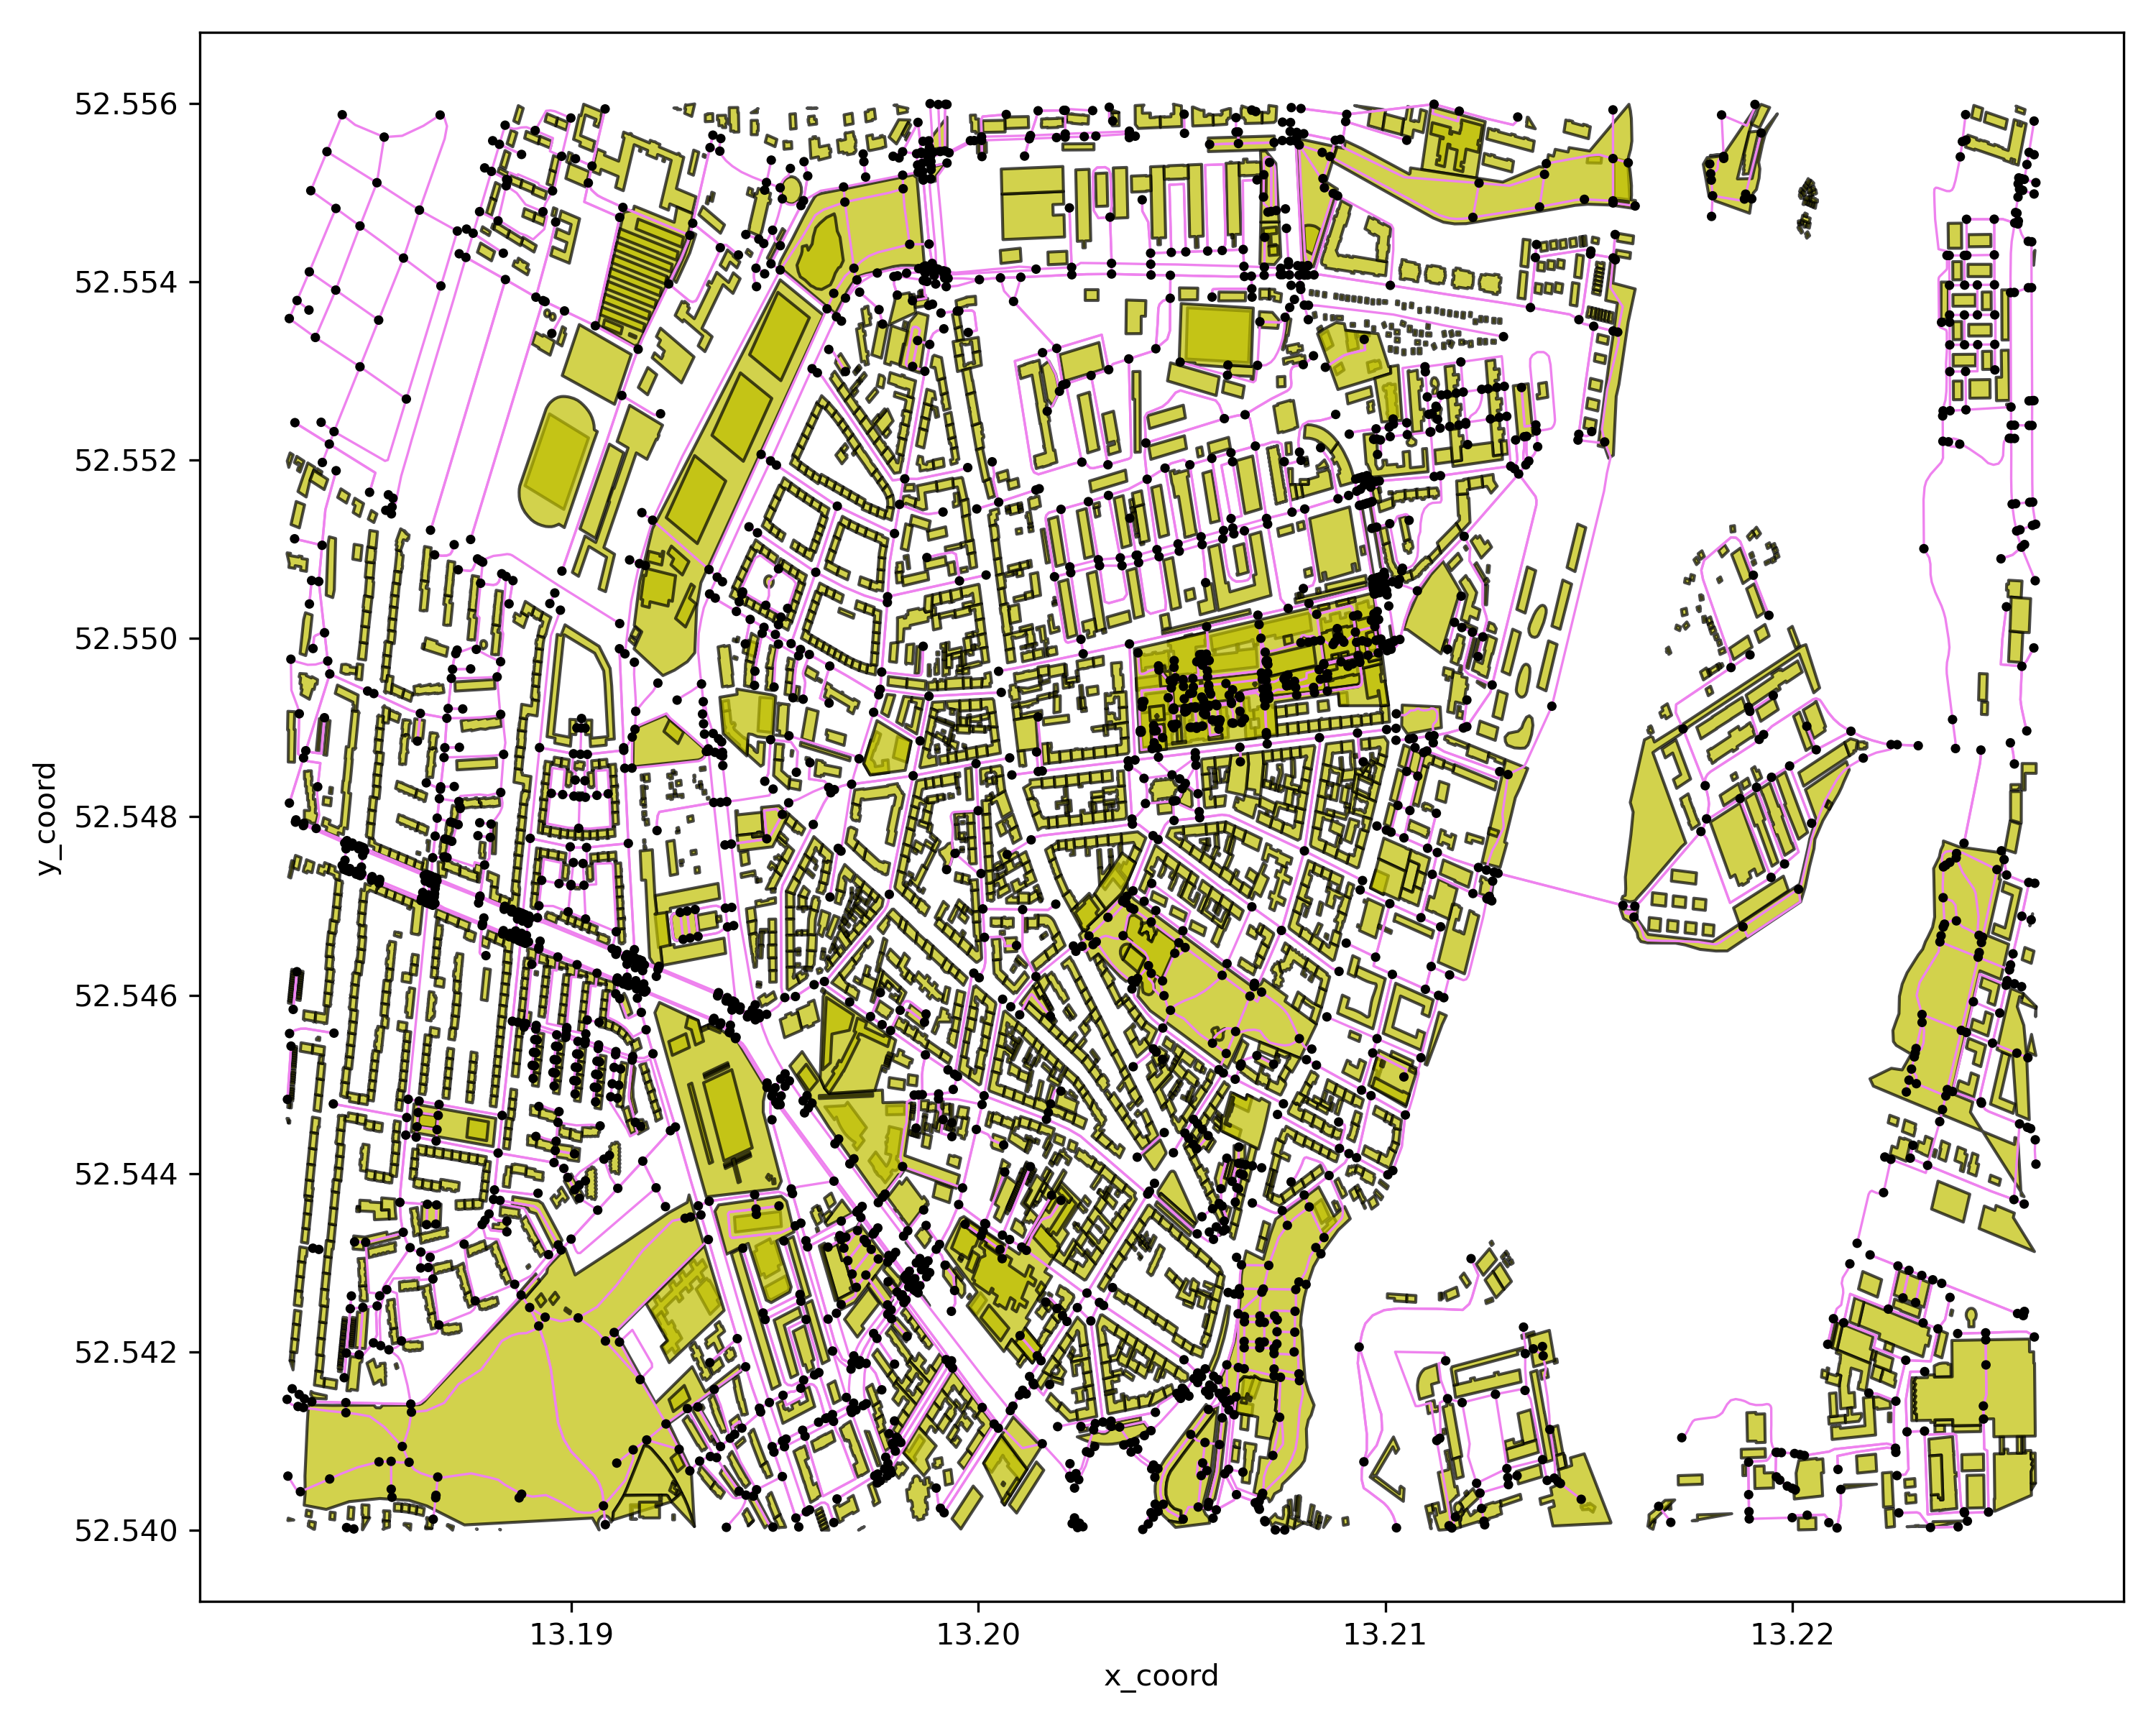
Step 5: show network by given link attributes range
# show network by given link length range
cf = p4g.show_network_by_link_length(mnet=mnet,min_length=10,max_length=50)
cf.show()
# show network by given link lane range
cf = p4g.show_network_by_link_lanes(mnet=mnet,min_lanes=1,max_lanes=3)
cf.show()
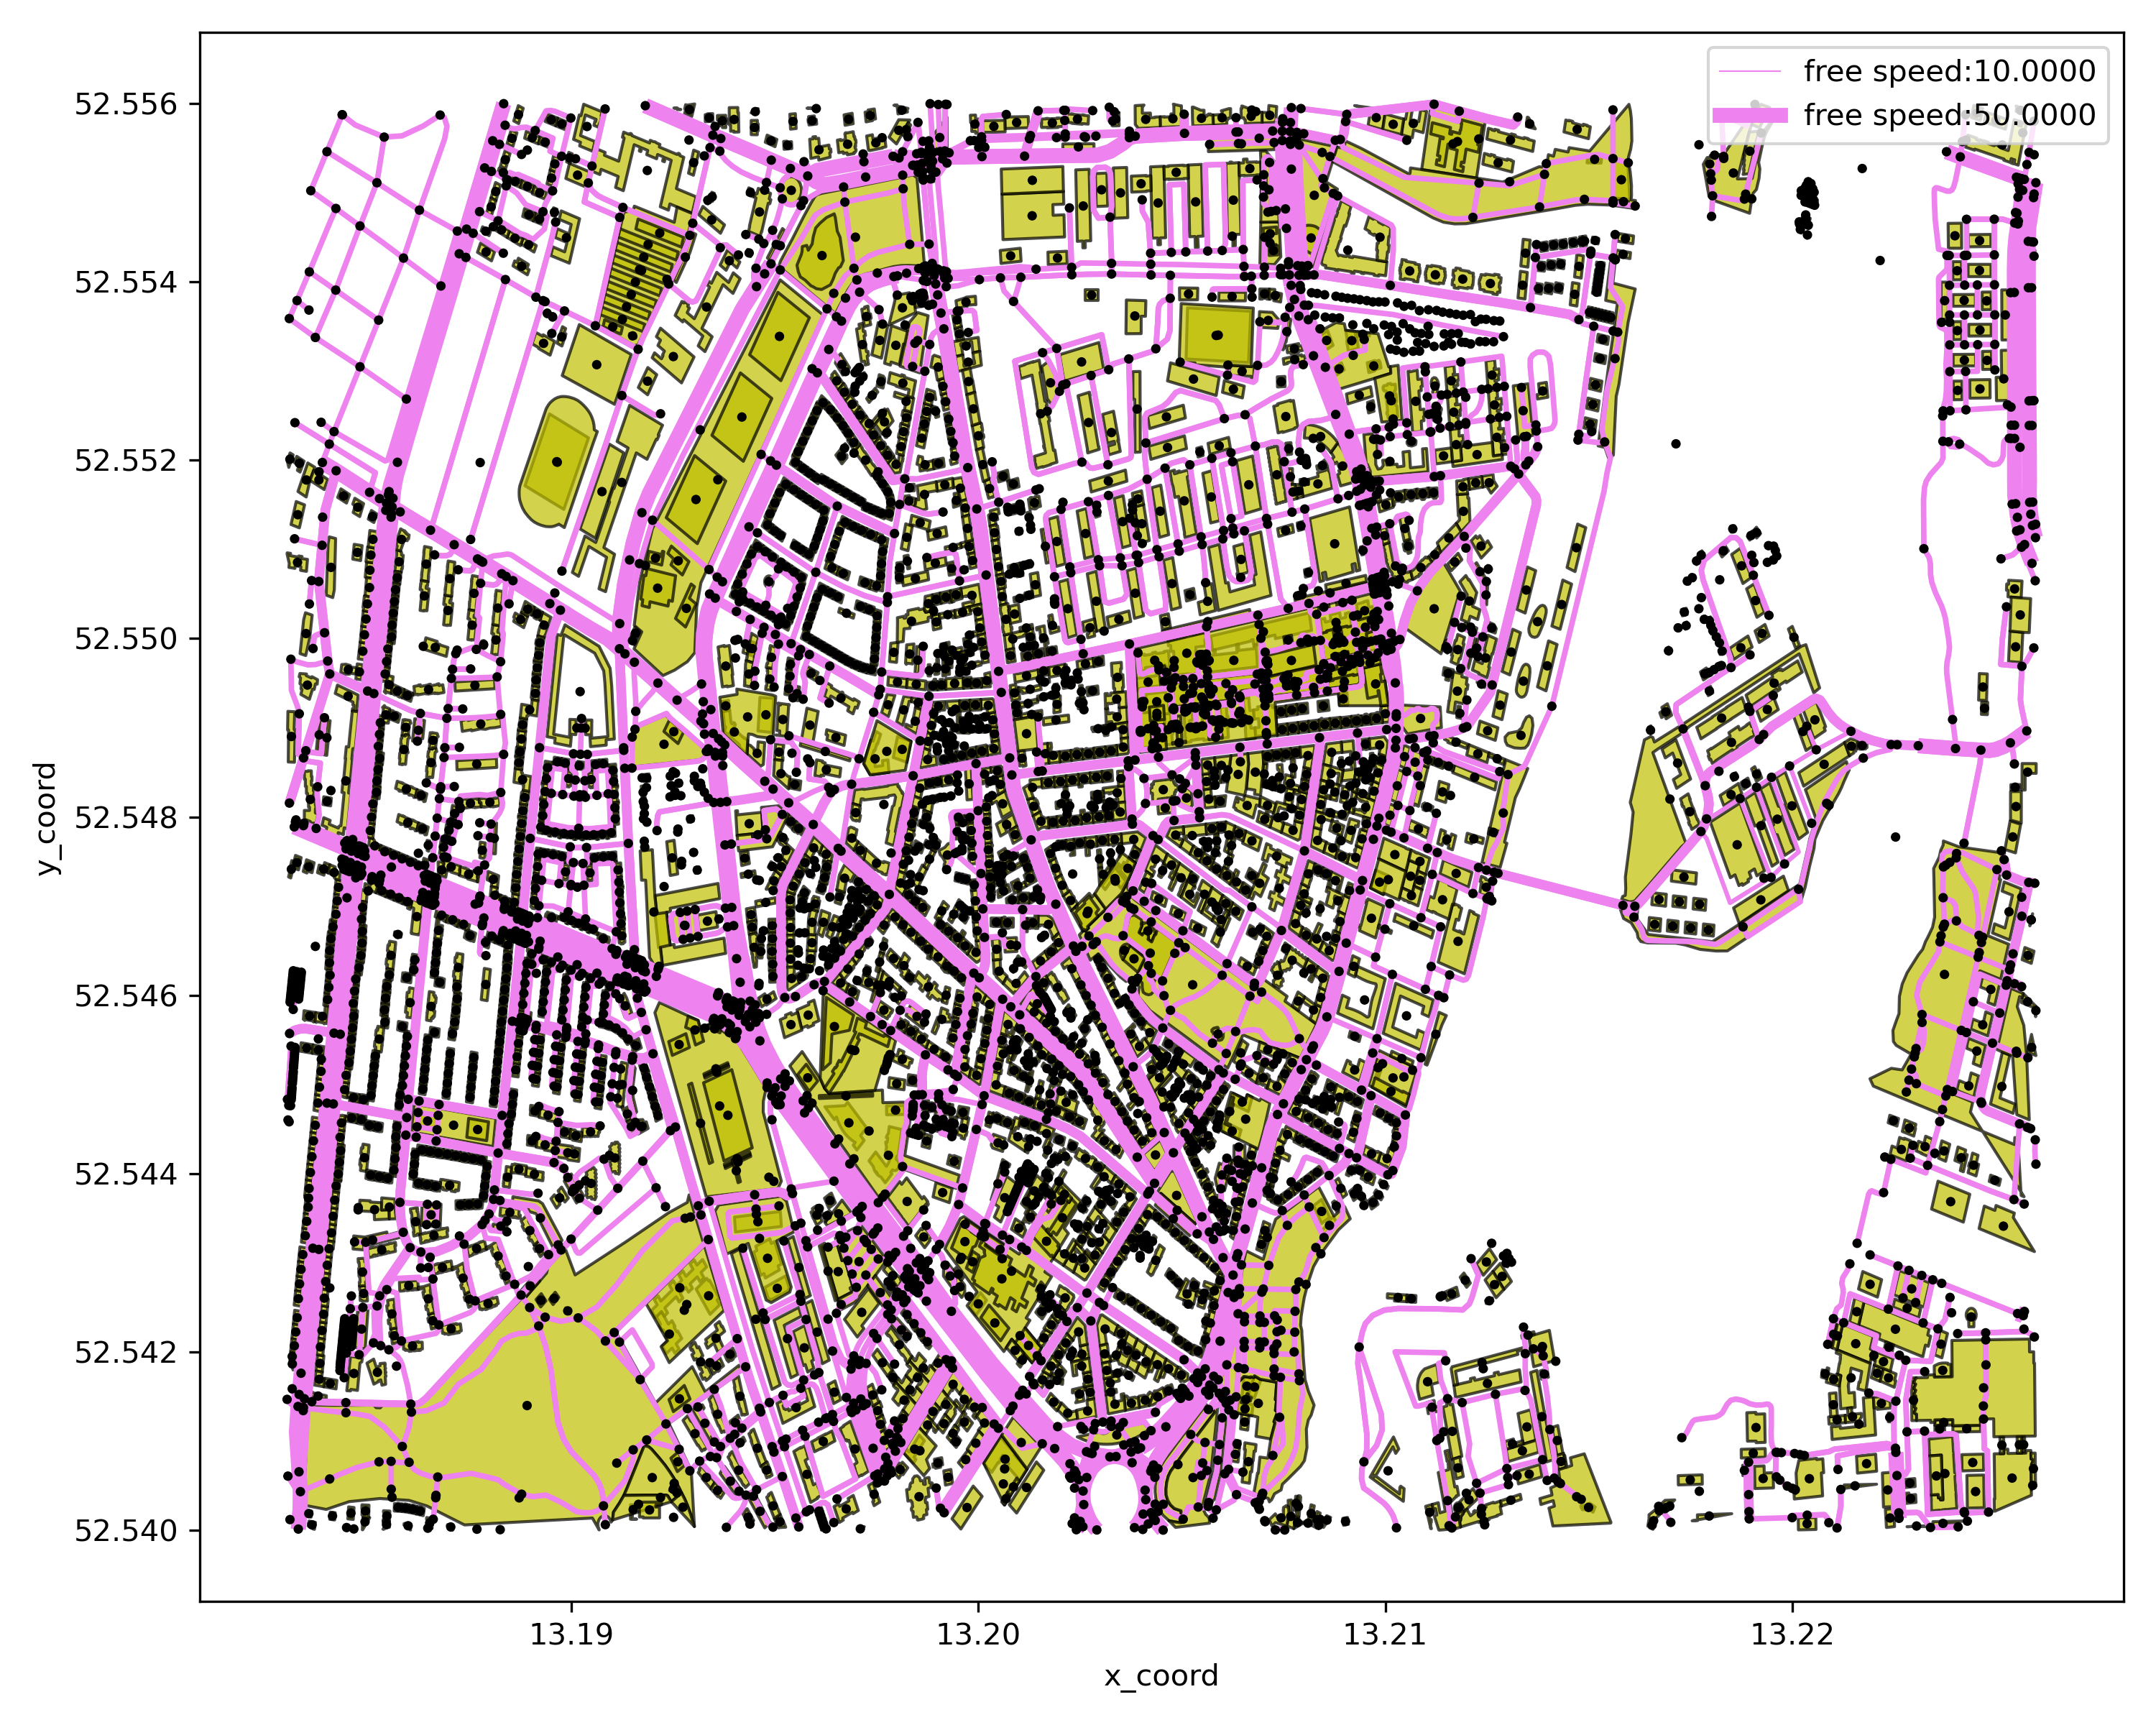
# show network by given link free speed range
cf = p4g.show_network_by_link_free_speed(mnet=mnet,min_free_speed=10,max_free_speed=40)
cf.show()
Step 6: show network by link attributes distribution
# show network by link lane distribution
cf = p4g.show_network_by_link_lane_distribution(mnet=mnet)
cf.show()
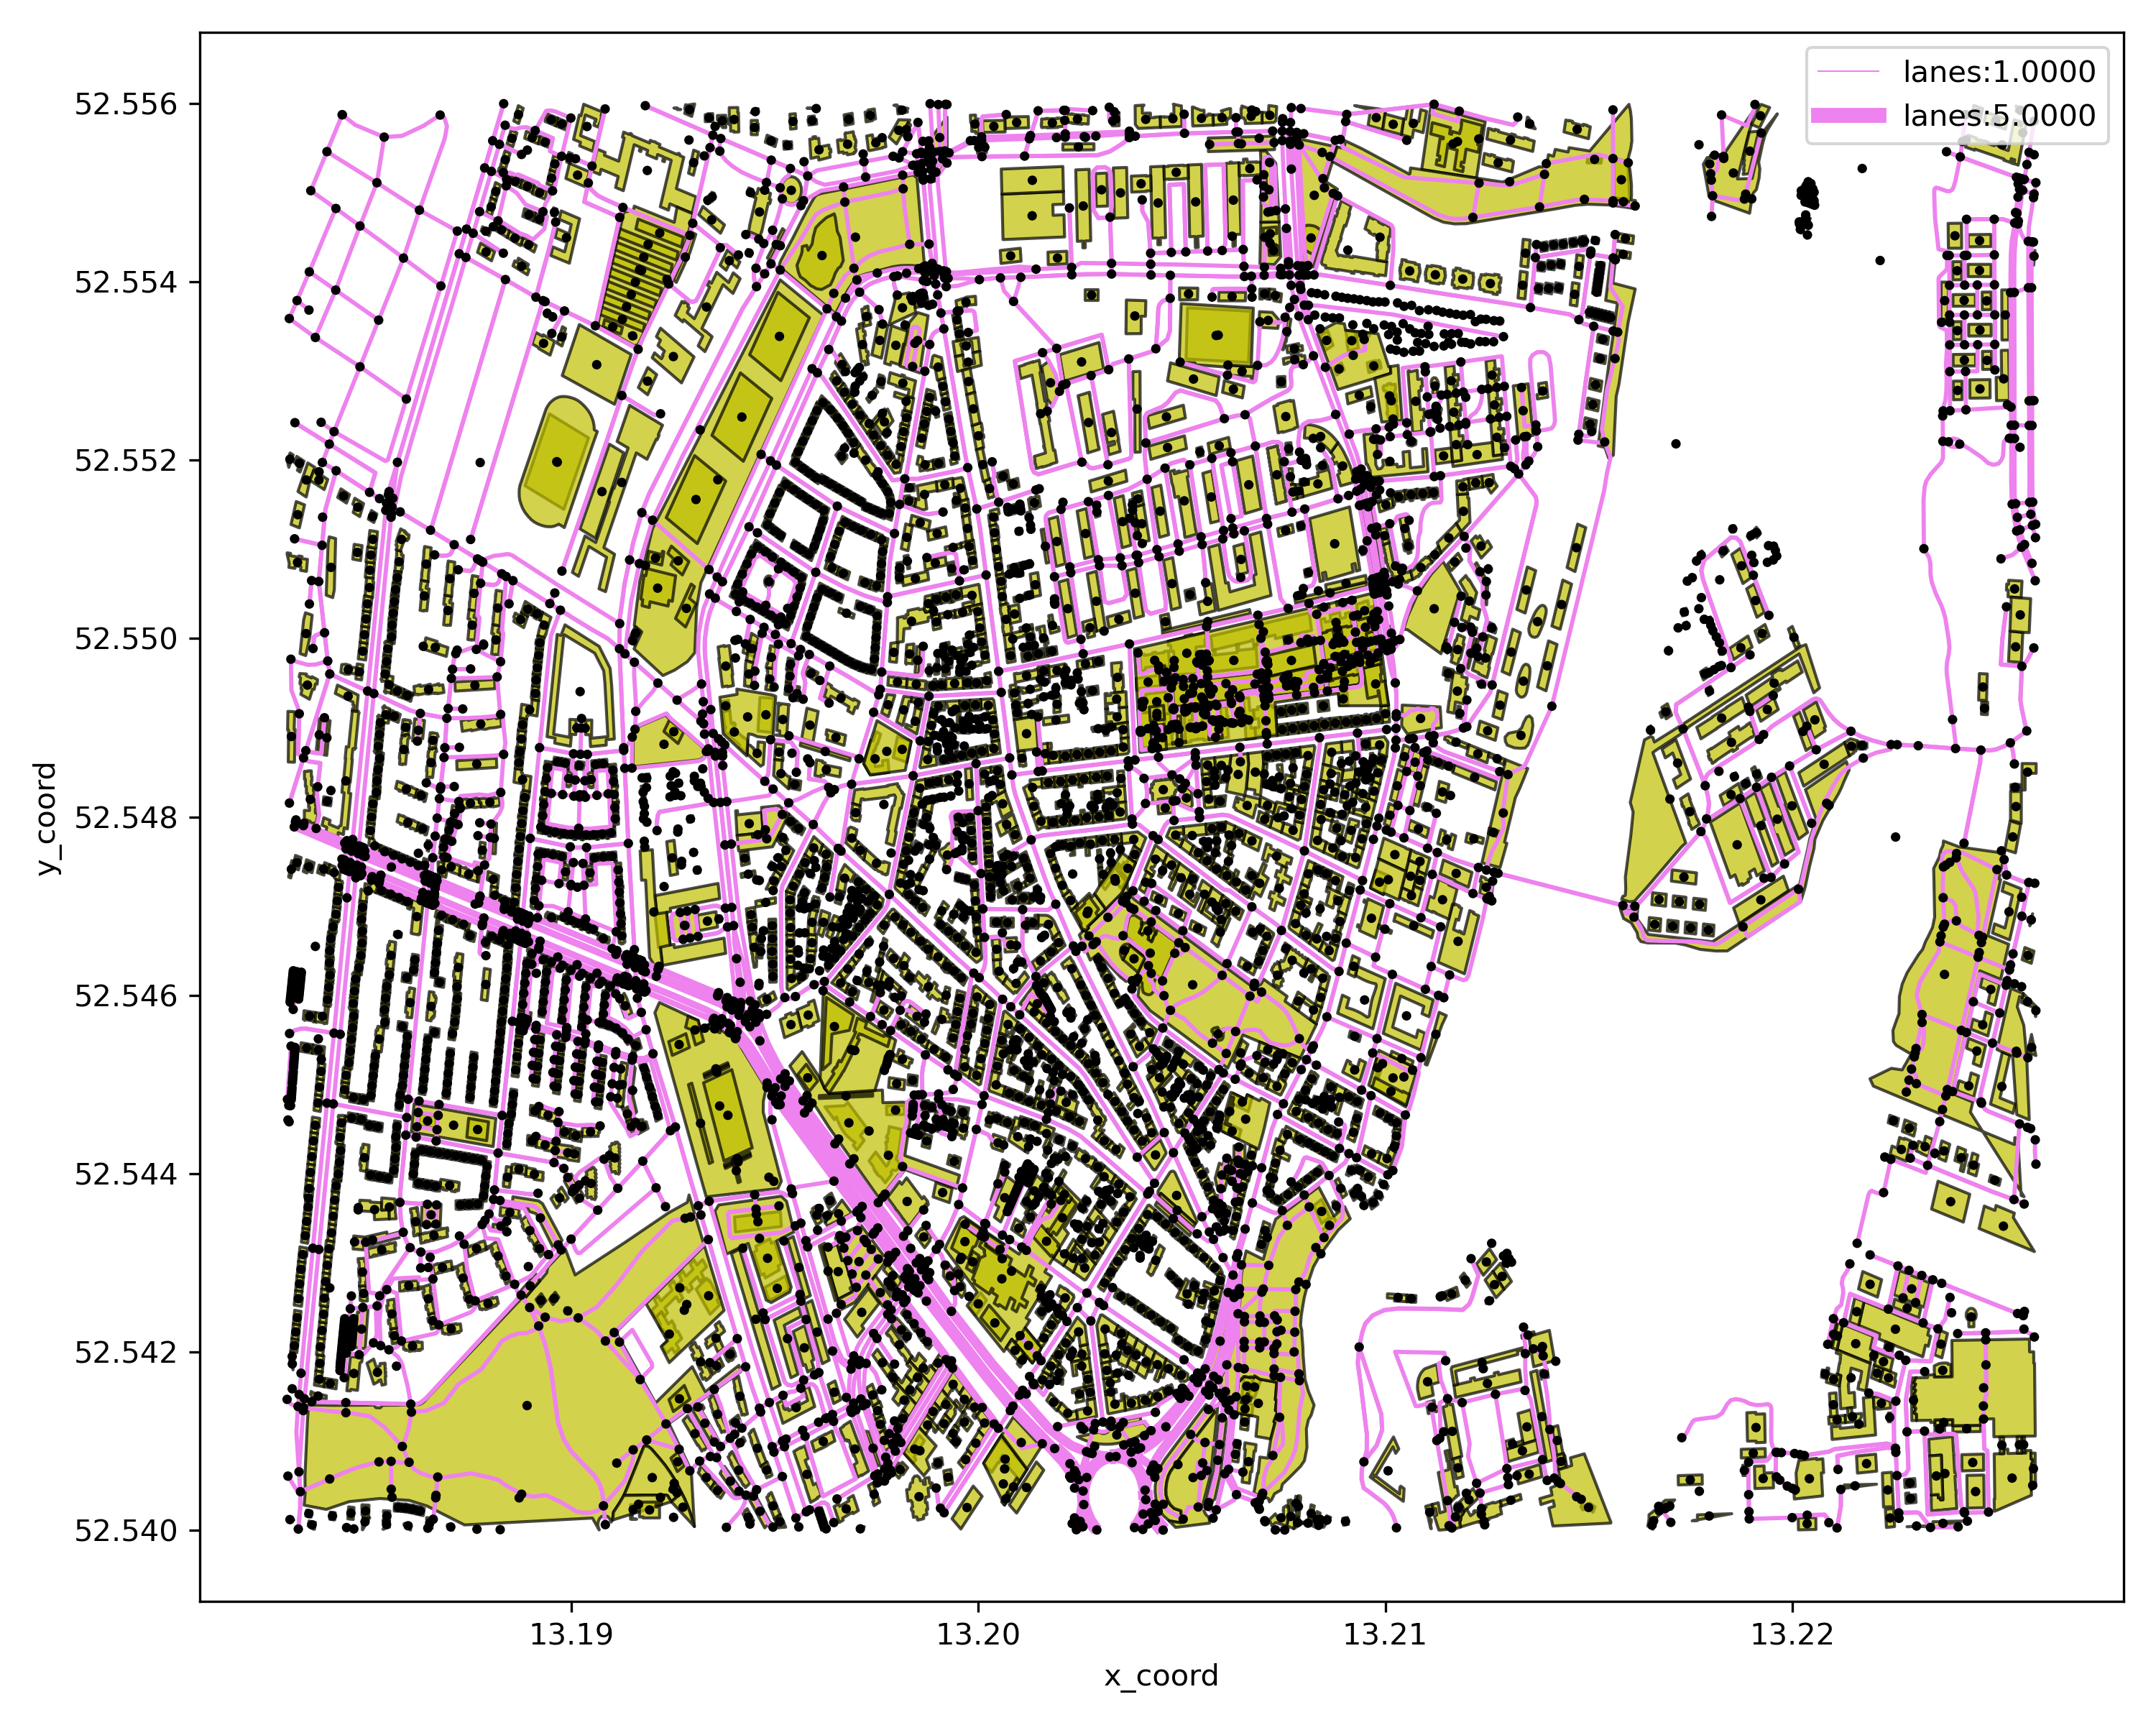
# show network by link capacity distribution
cf = p4g.show_network_by_link_capacity_distribution(mnet=mnet)
cf.show()

# show network by link free speed distribution
cf = p4g.show_network_by_link_free_speed_distribution(mnet=mnet)
cf.show()
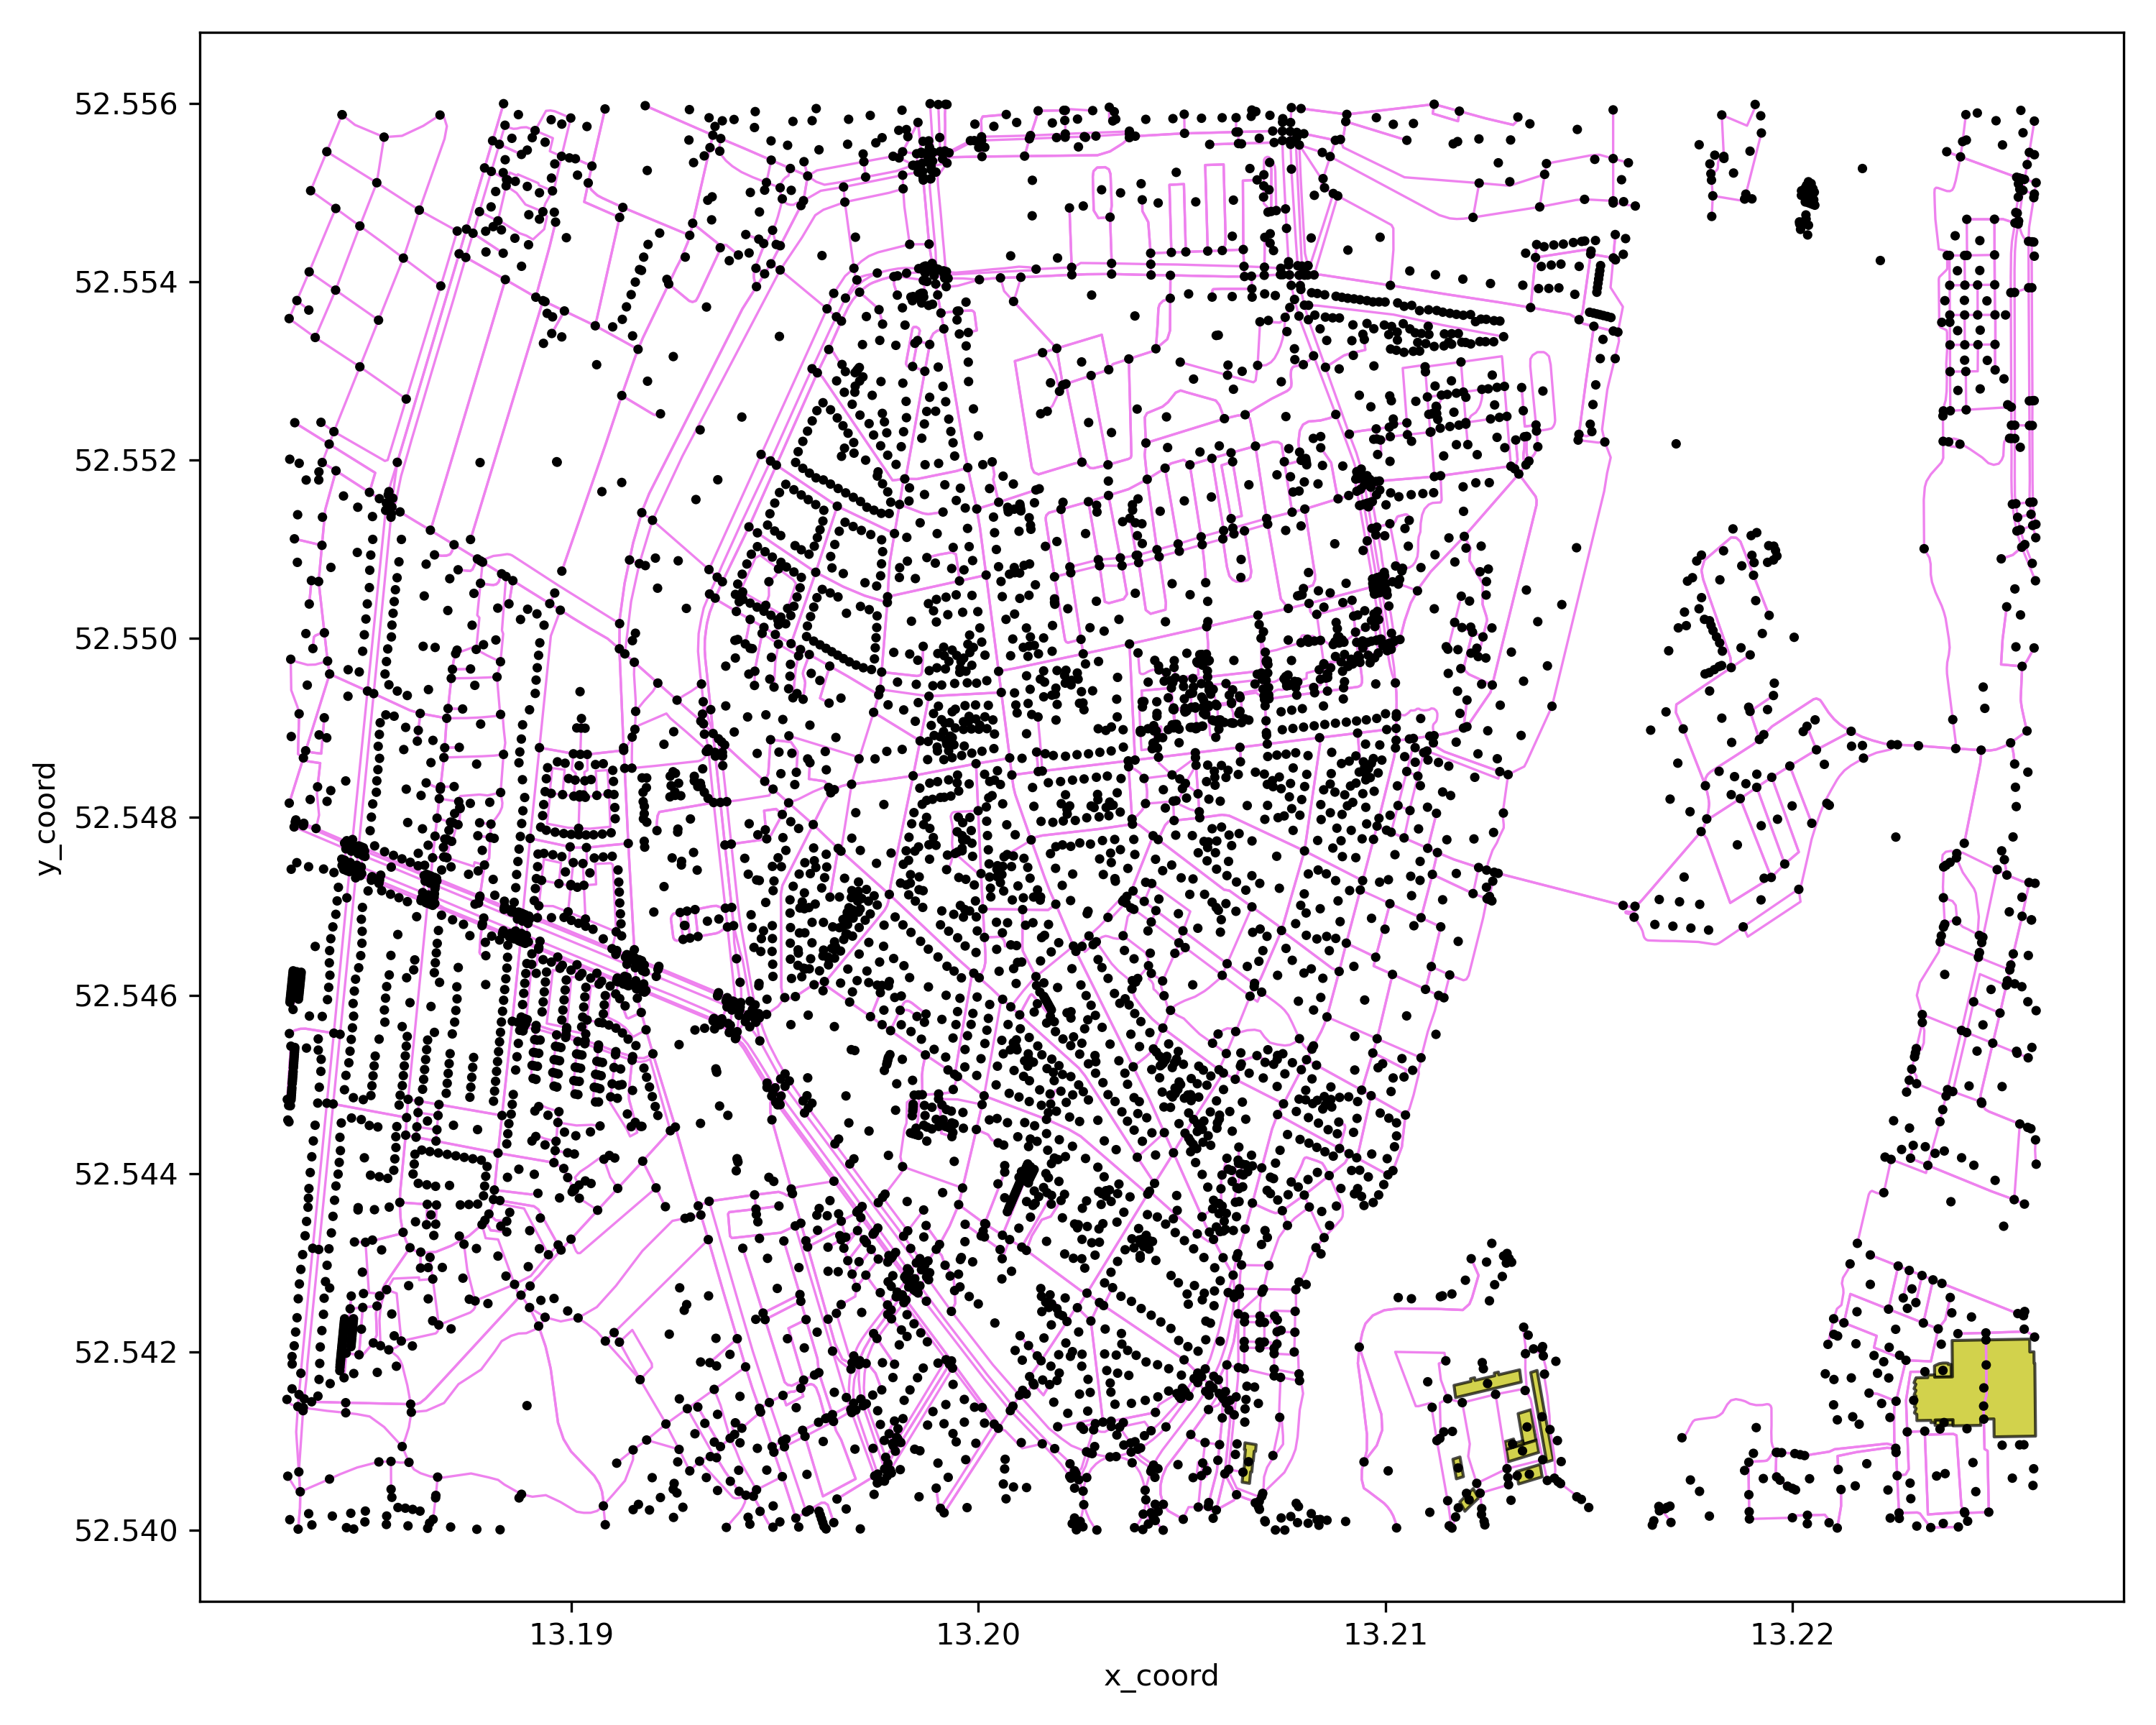
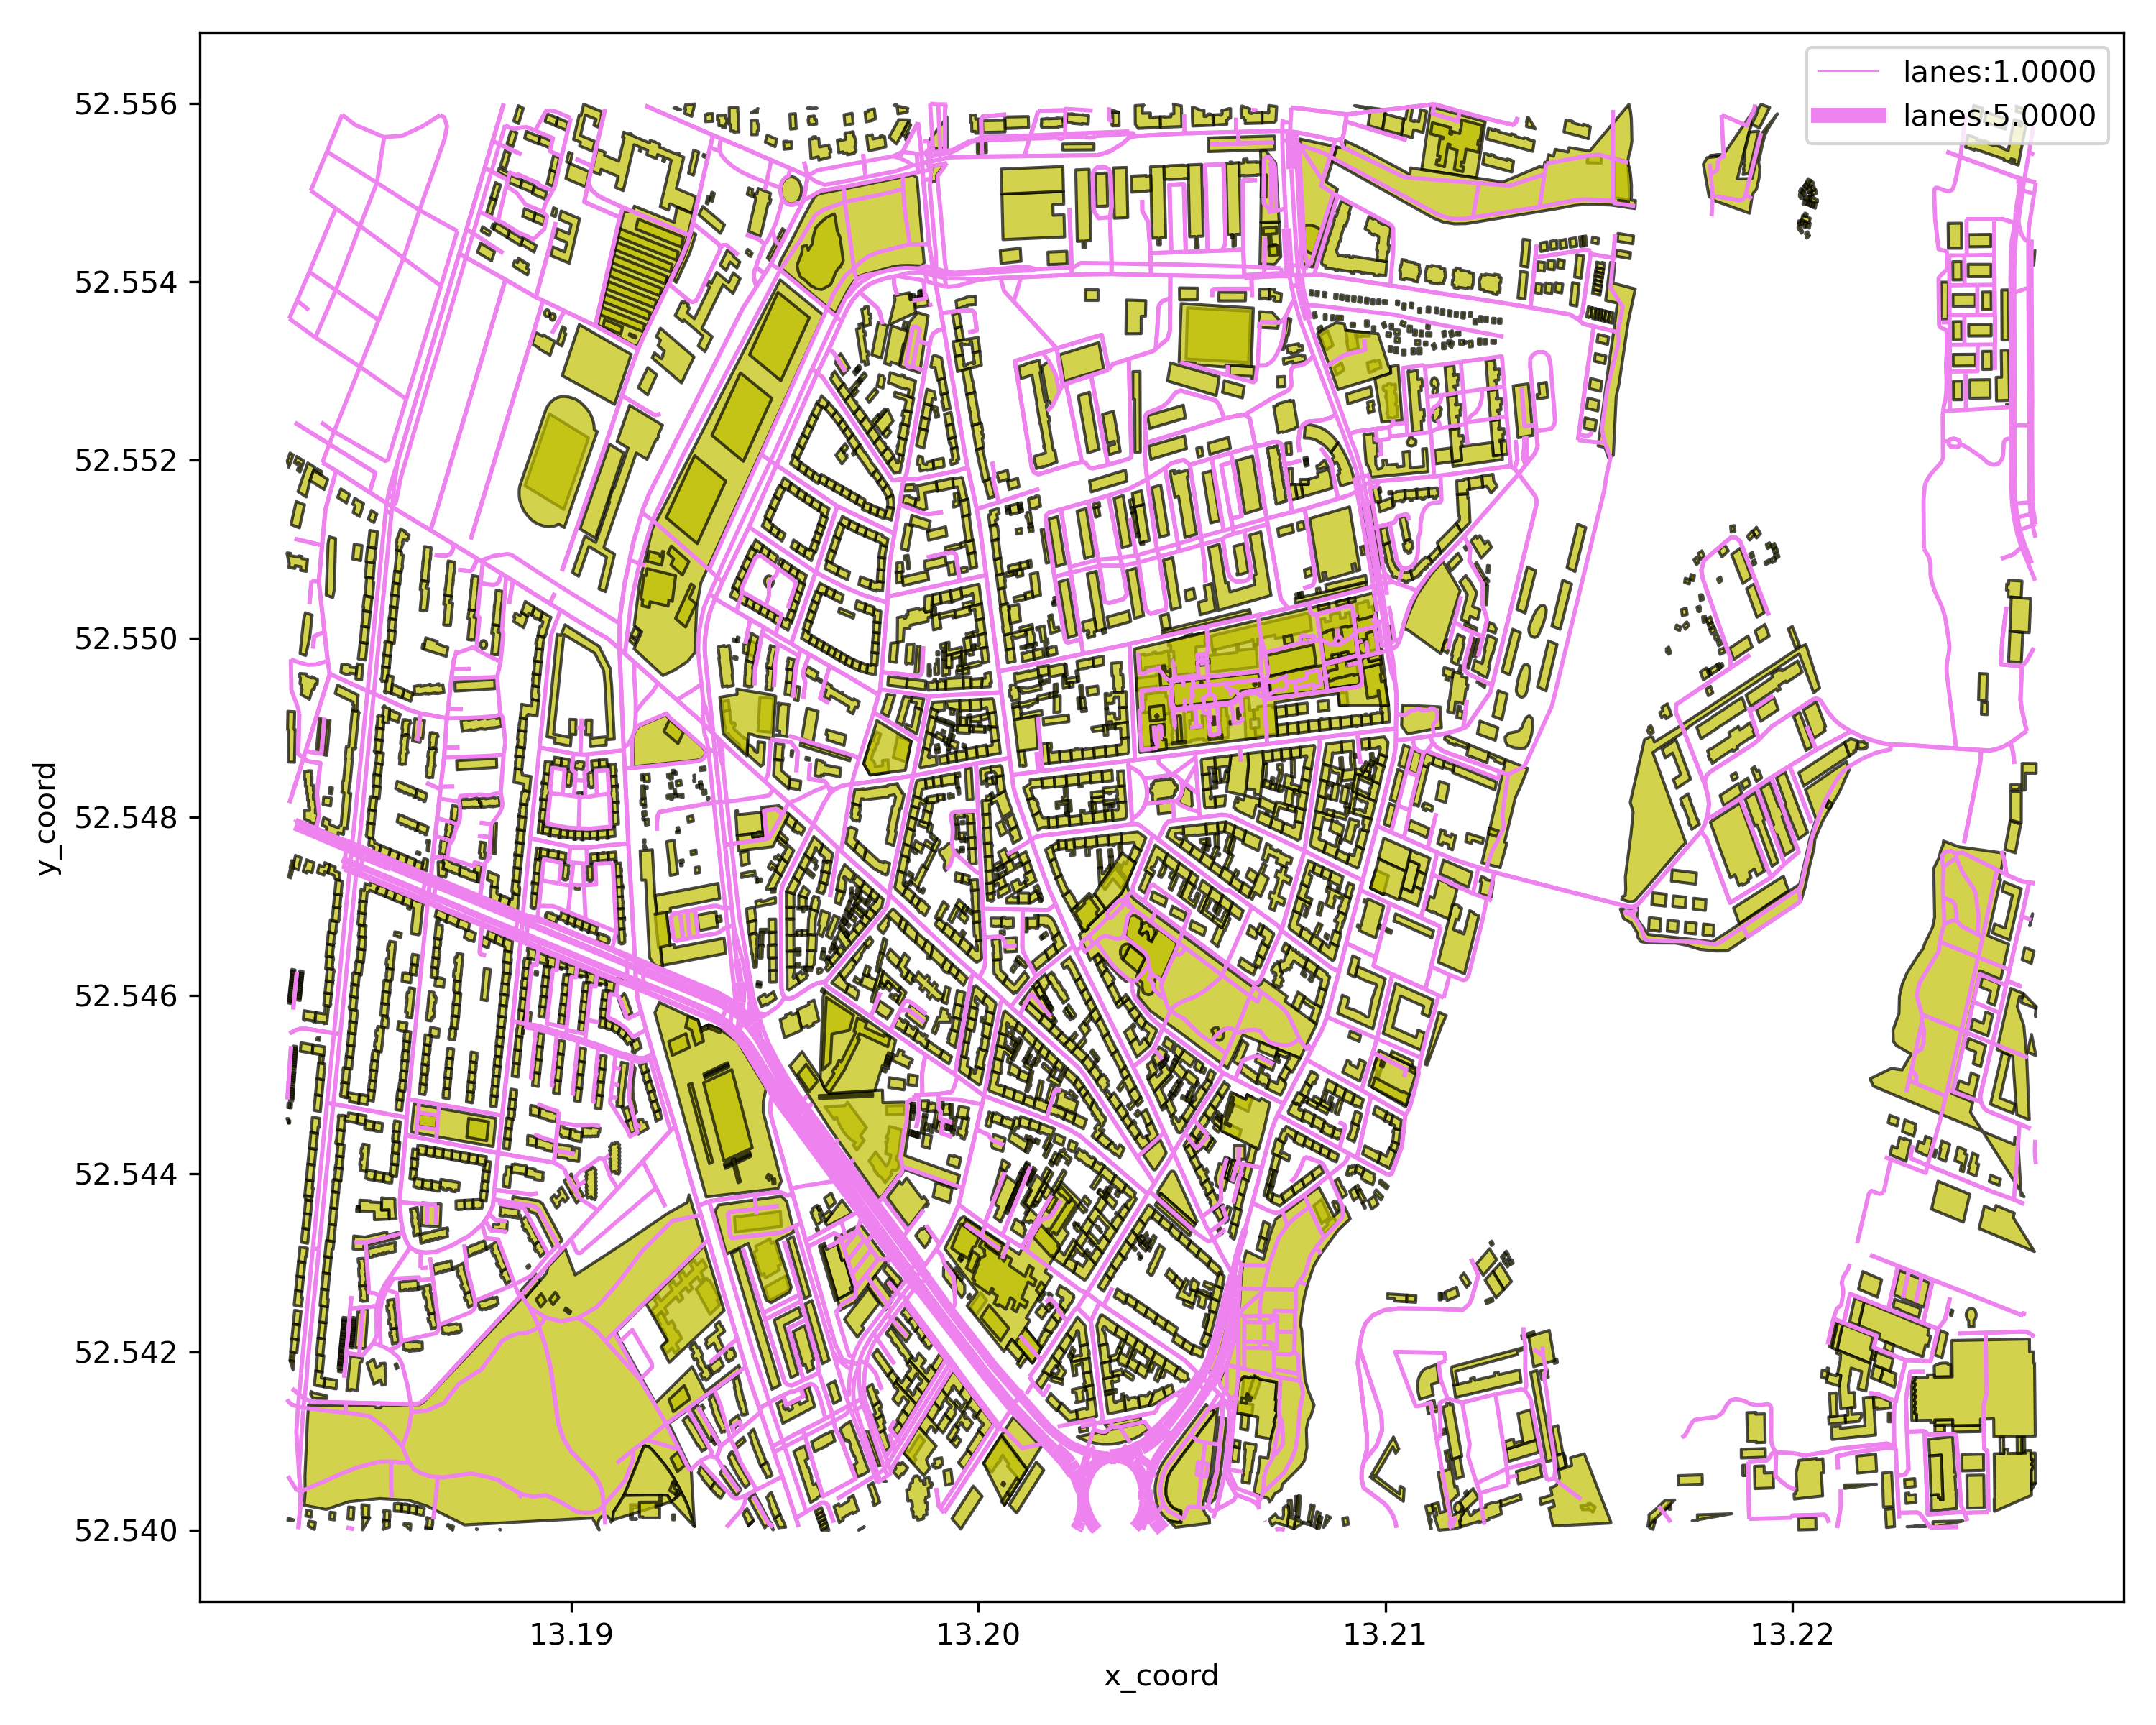
Step 7: show network with given POI types
cf = p4g.show_network_by_poi_types(mnet=mnet,poi_type=['public','industrial'])
cf.show()
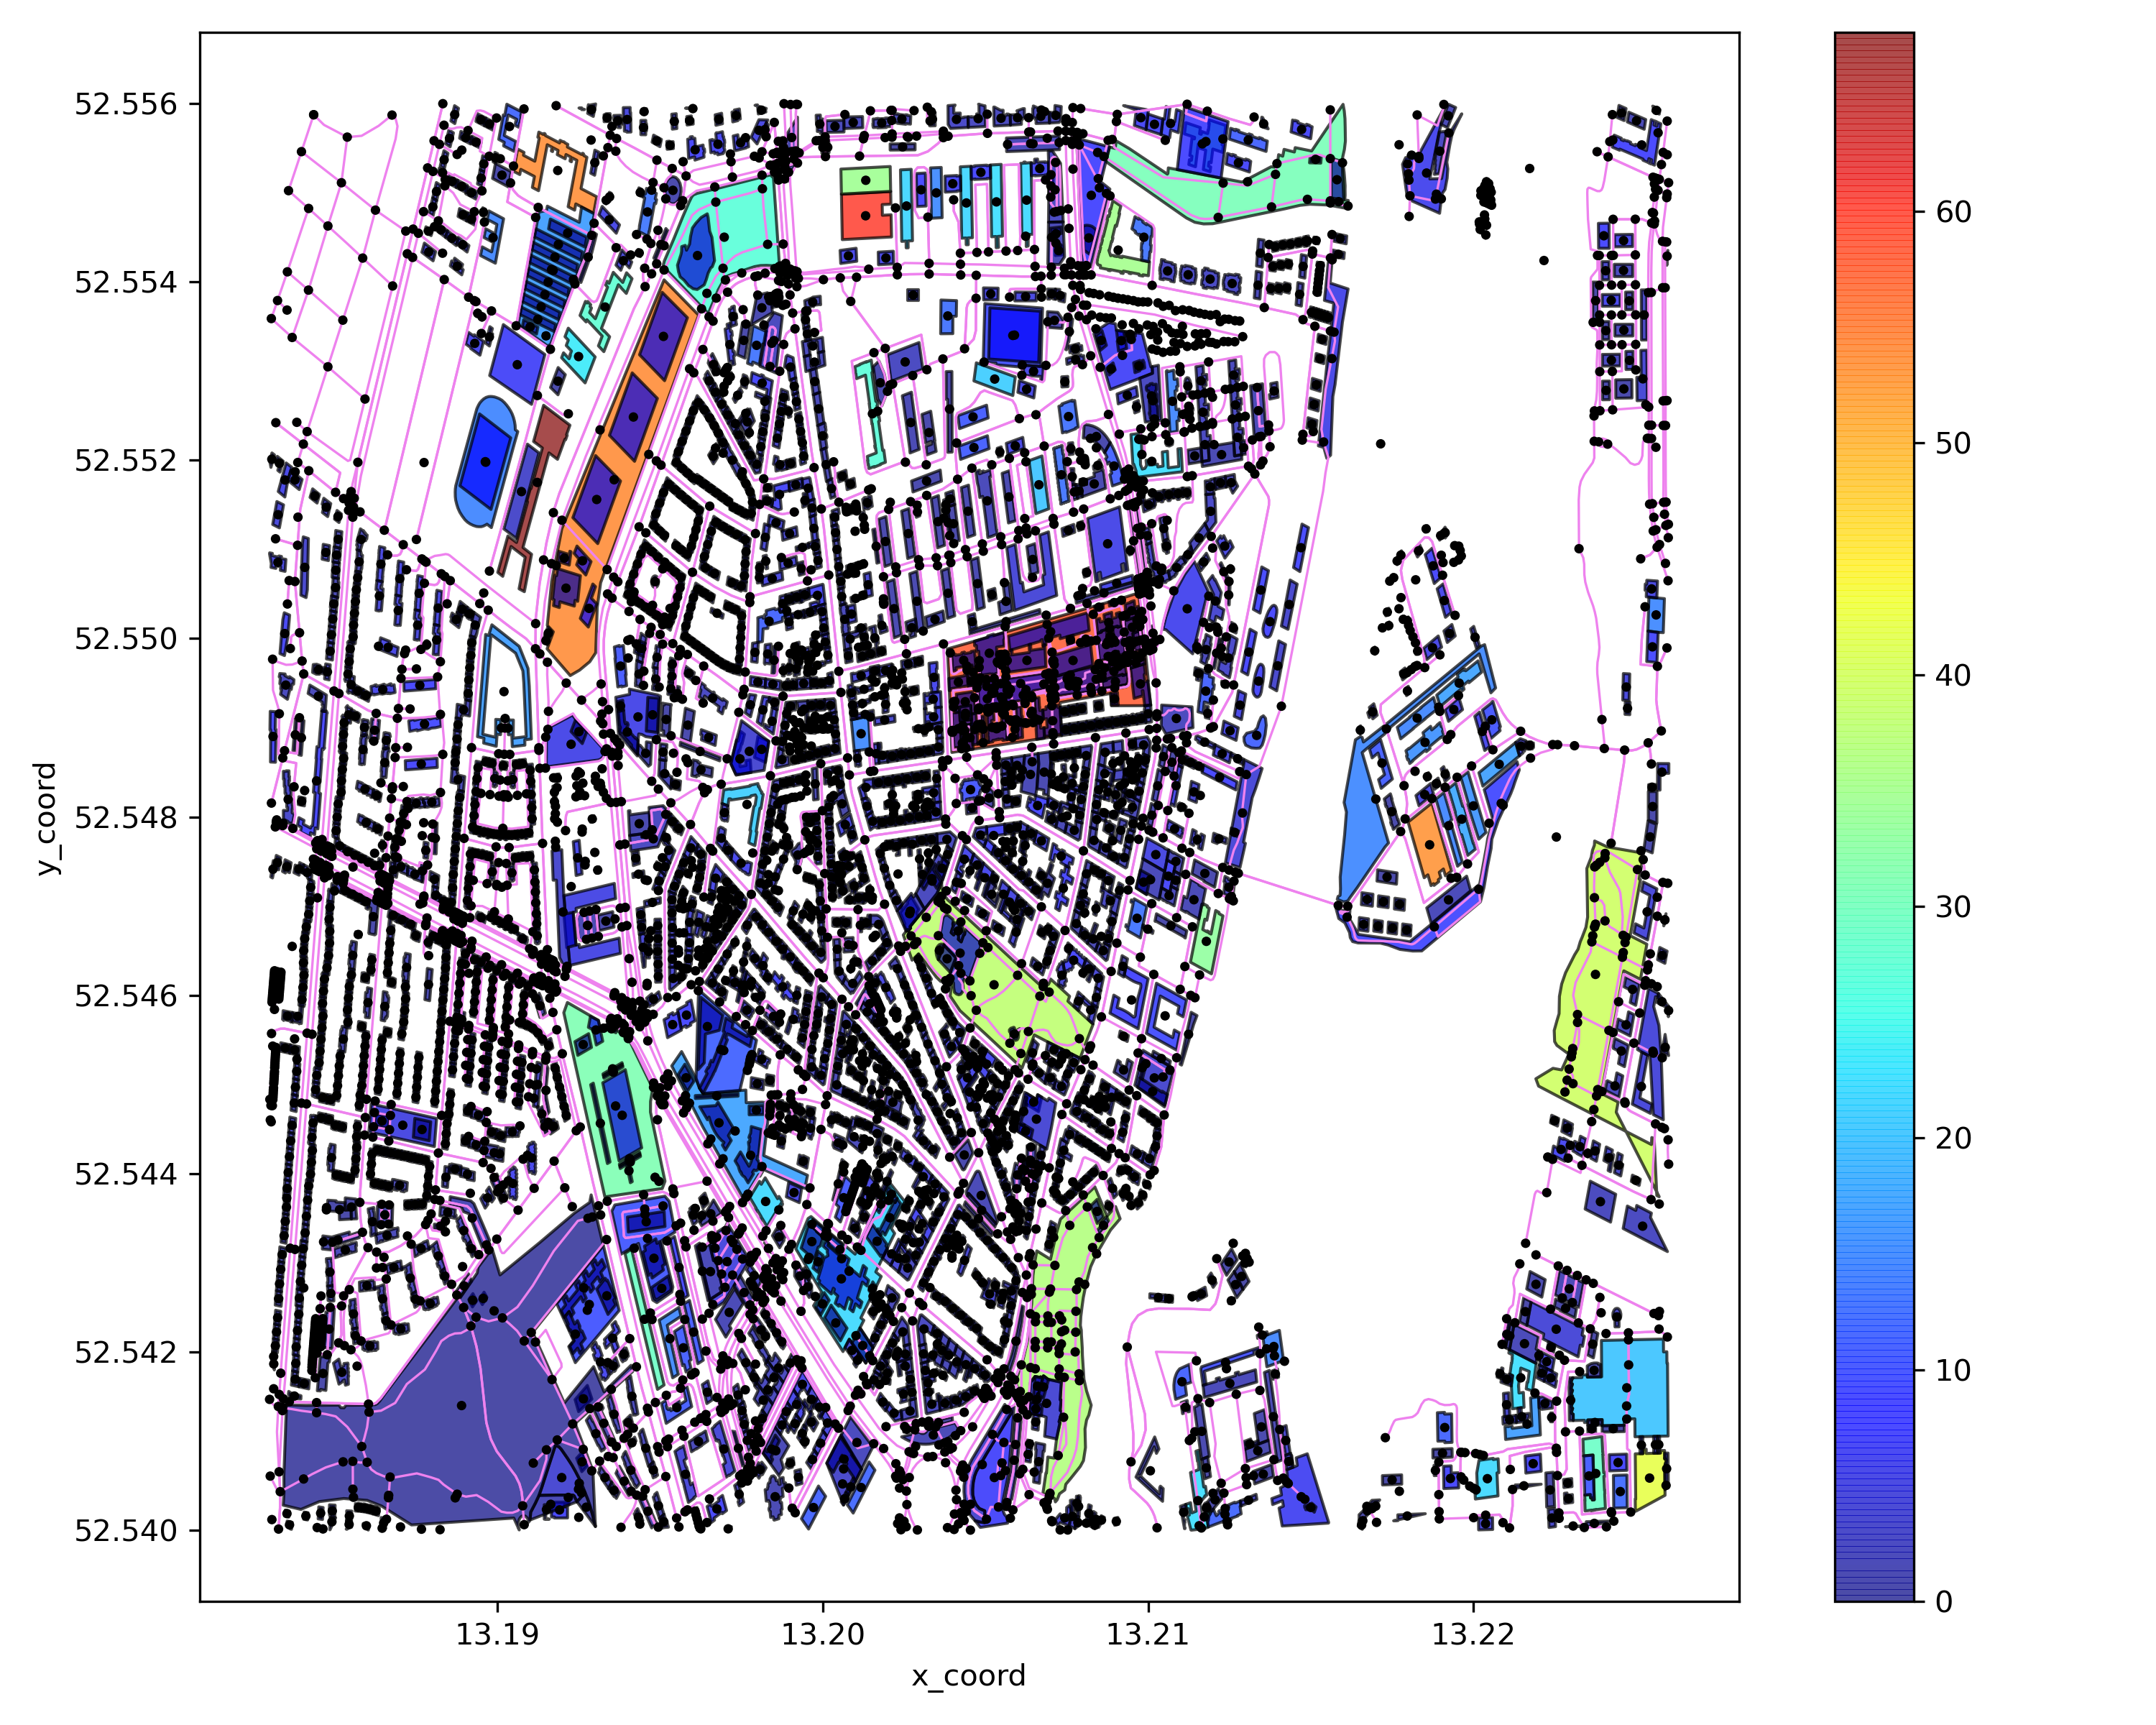
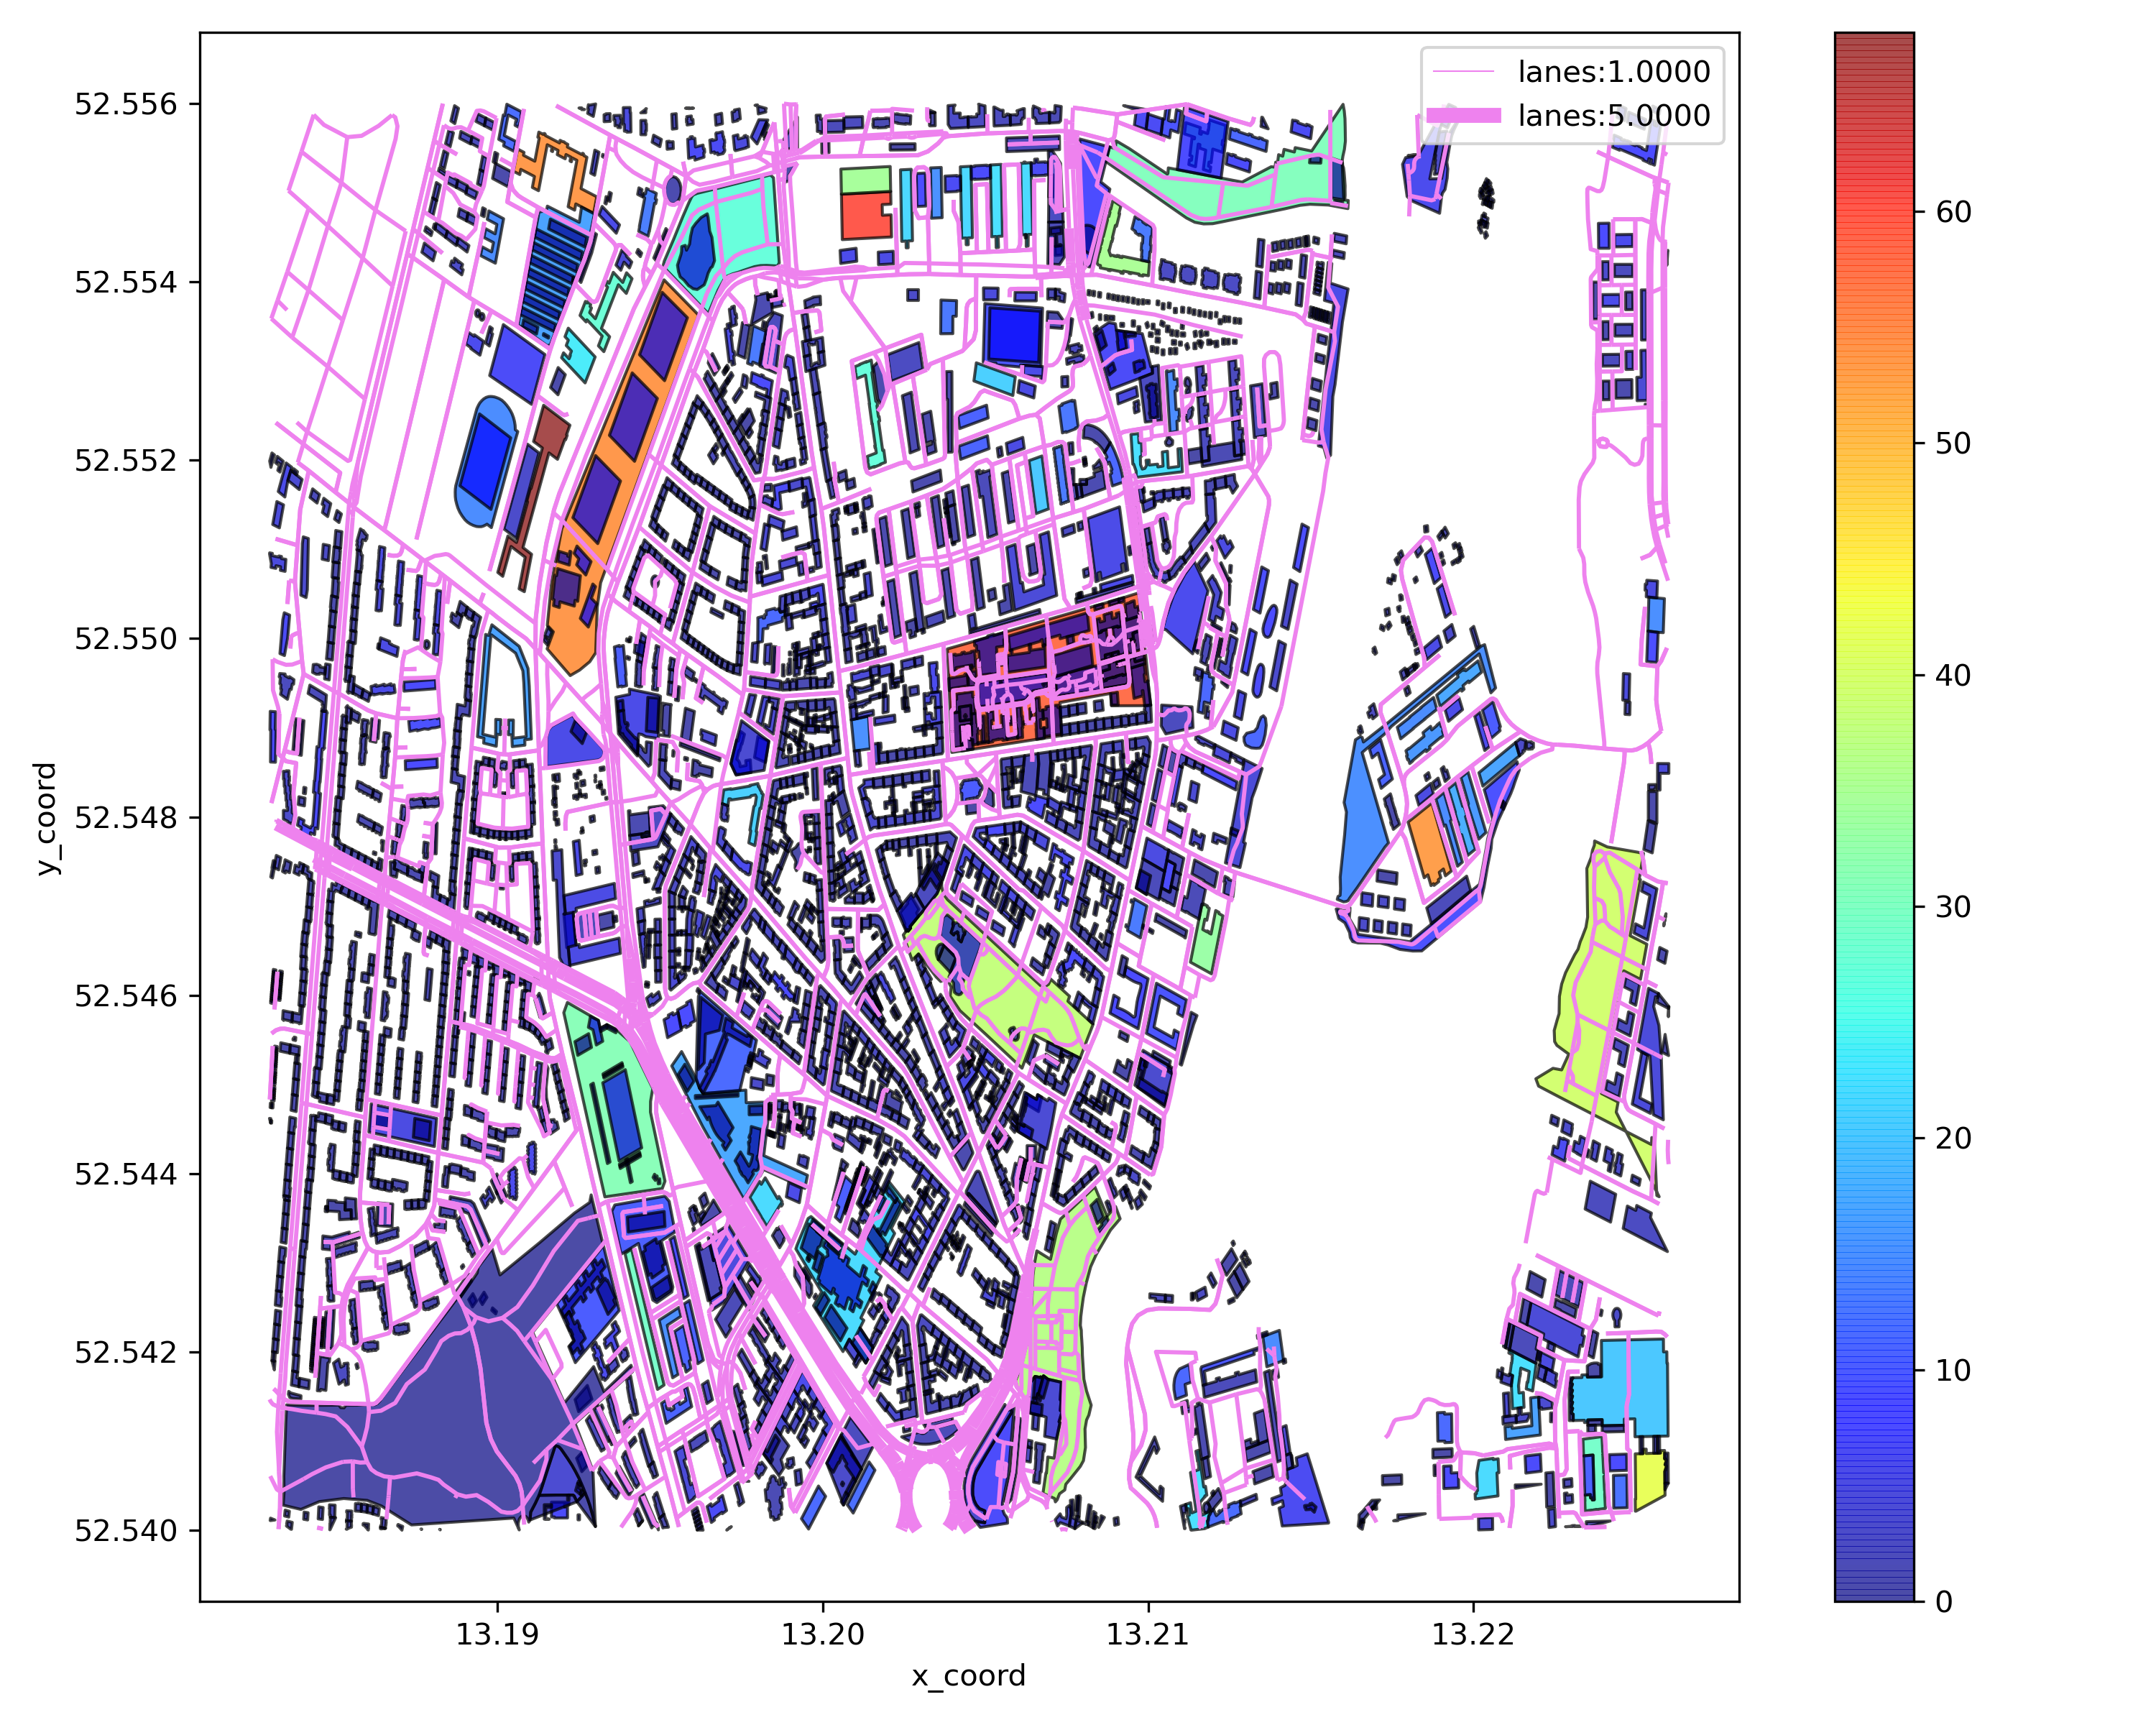
Step 8: show network by poi attributes distribution
# show network by poi attraction distribution
cf = p4g.show_network_by_poi_attraction_distribution(mnet=mnet)
cf.show()
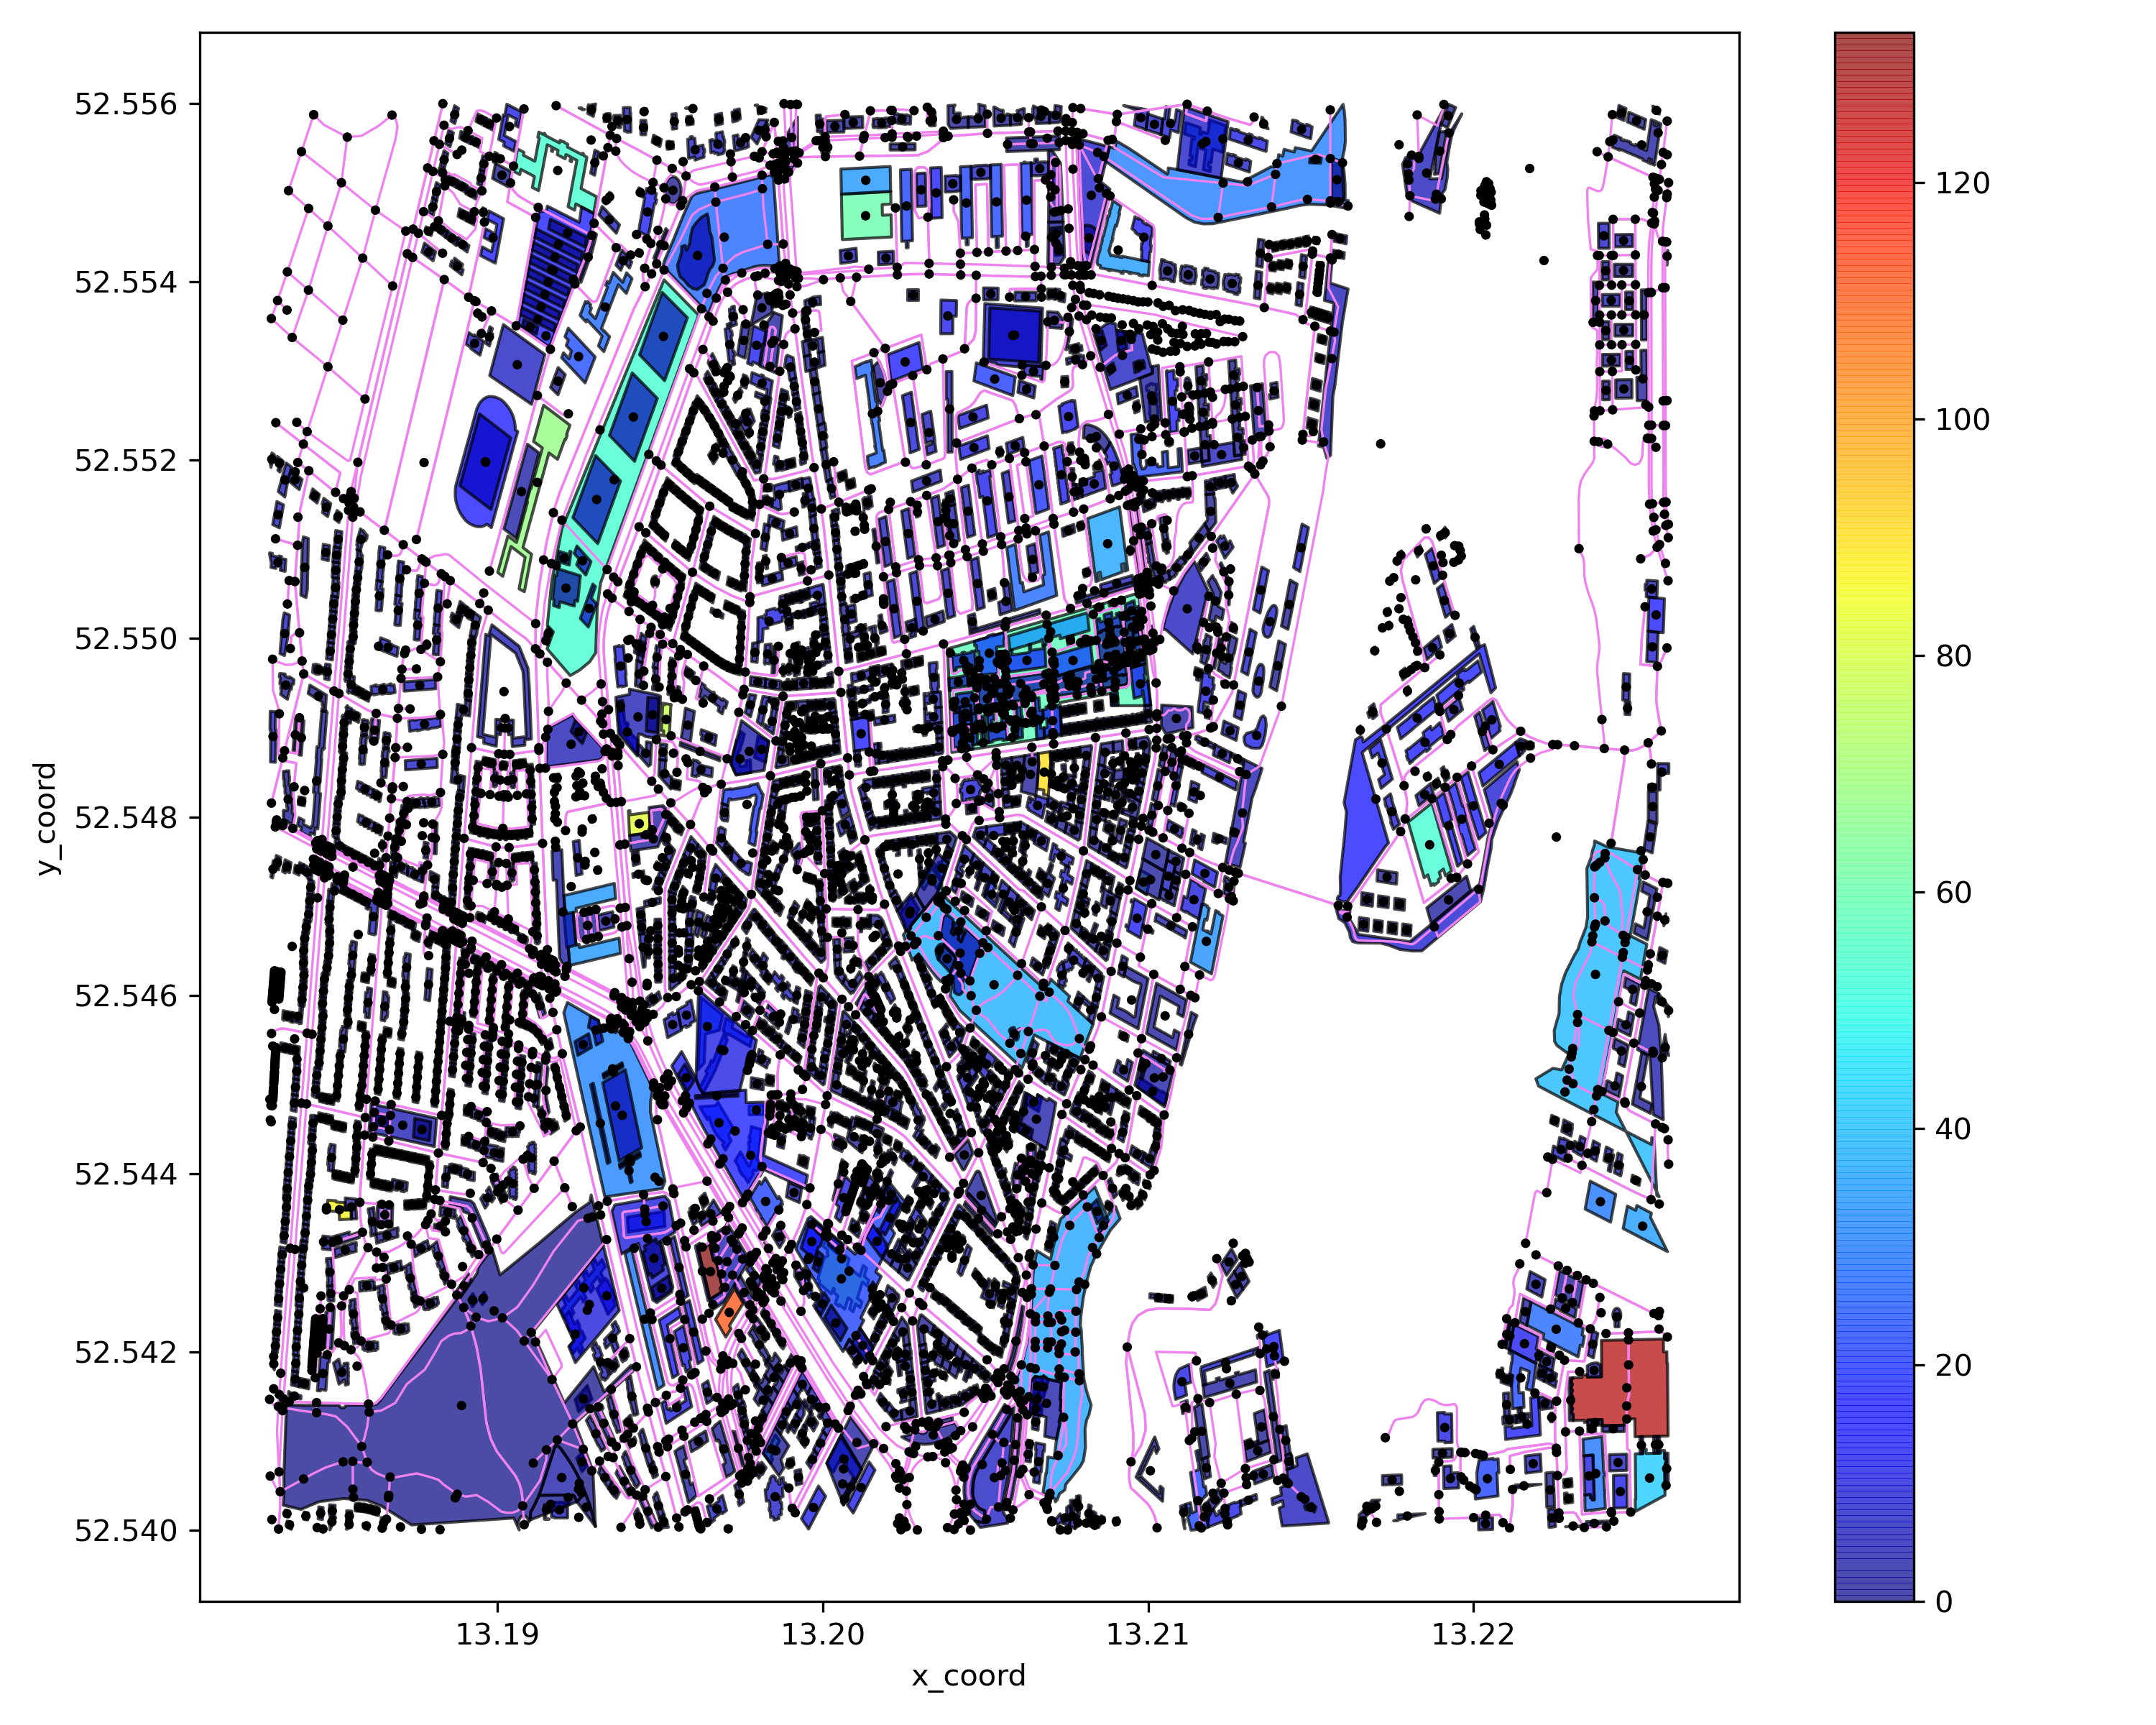
# show network by poi production distribution
cf = p4g.show_network_by_poi_production_distribution(mnet=mnet)
cf.show()
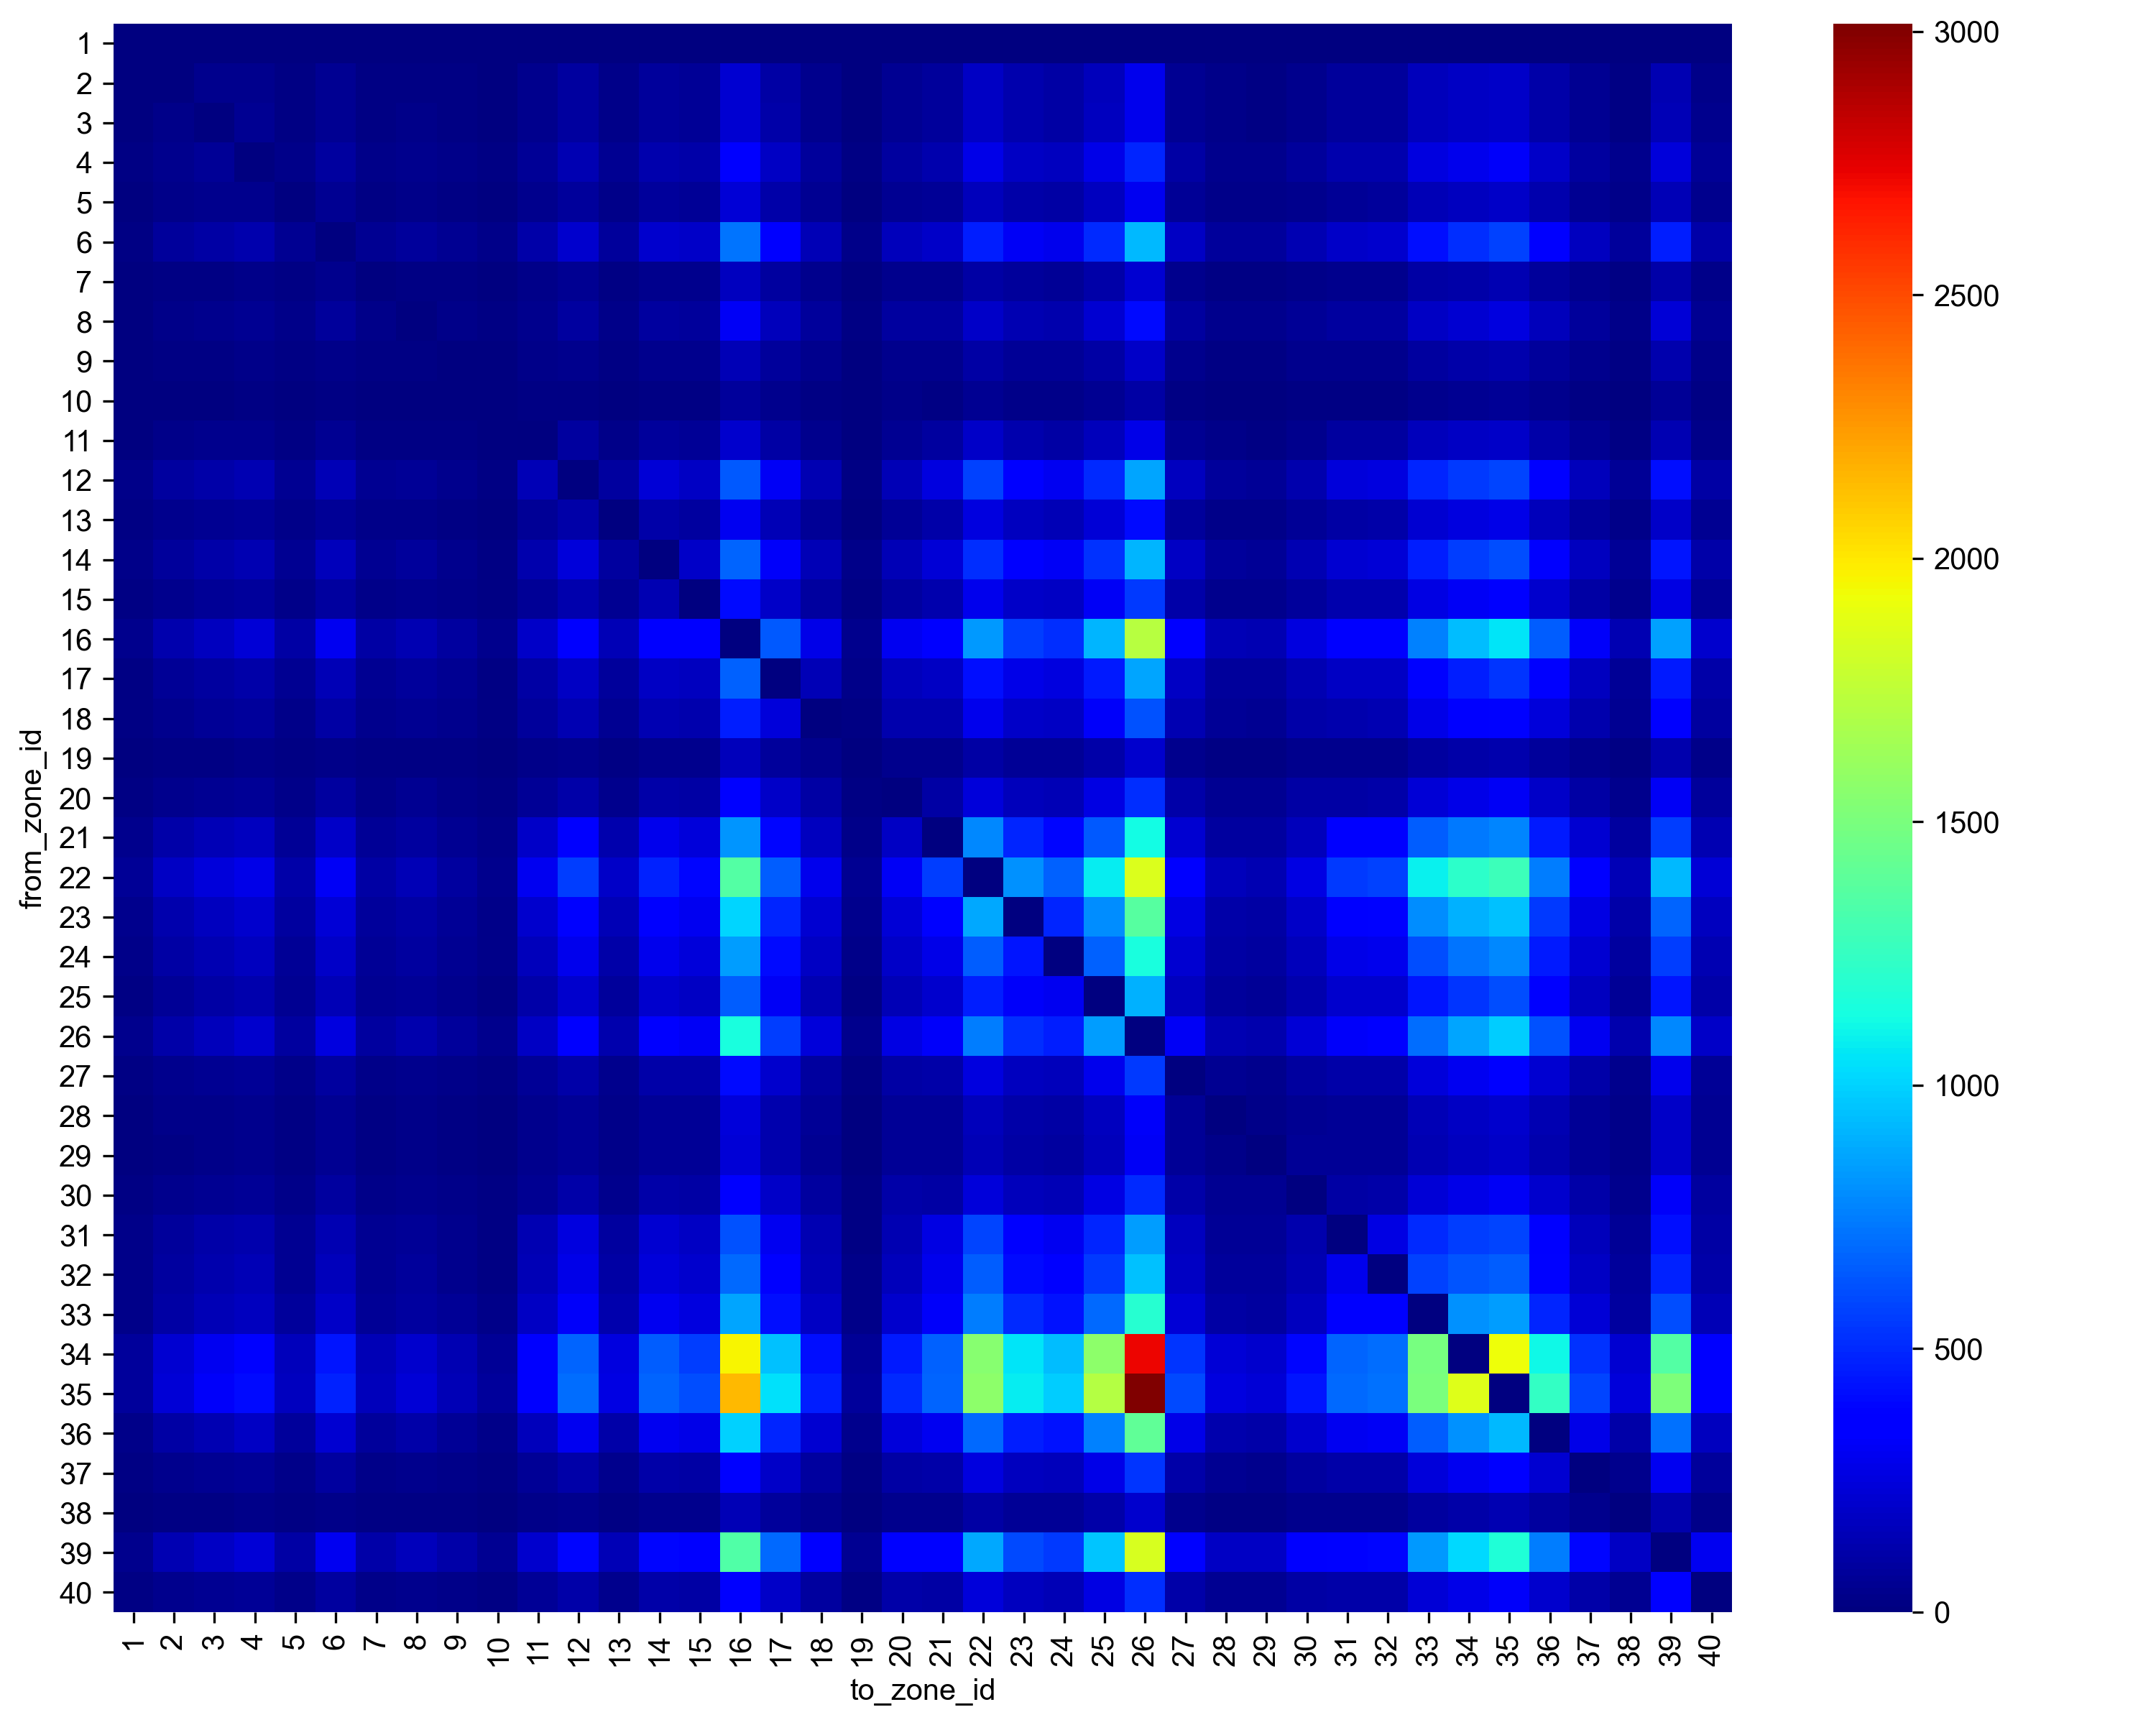
Step 9: show network demand matrix heatmap
cf = p4g.show_network_demand_matrix_heatmap(mnet)
cf.show()
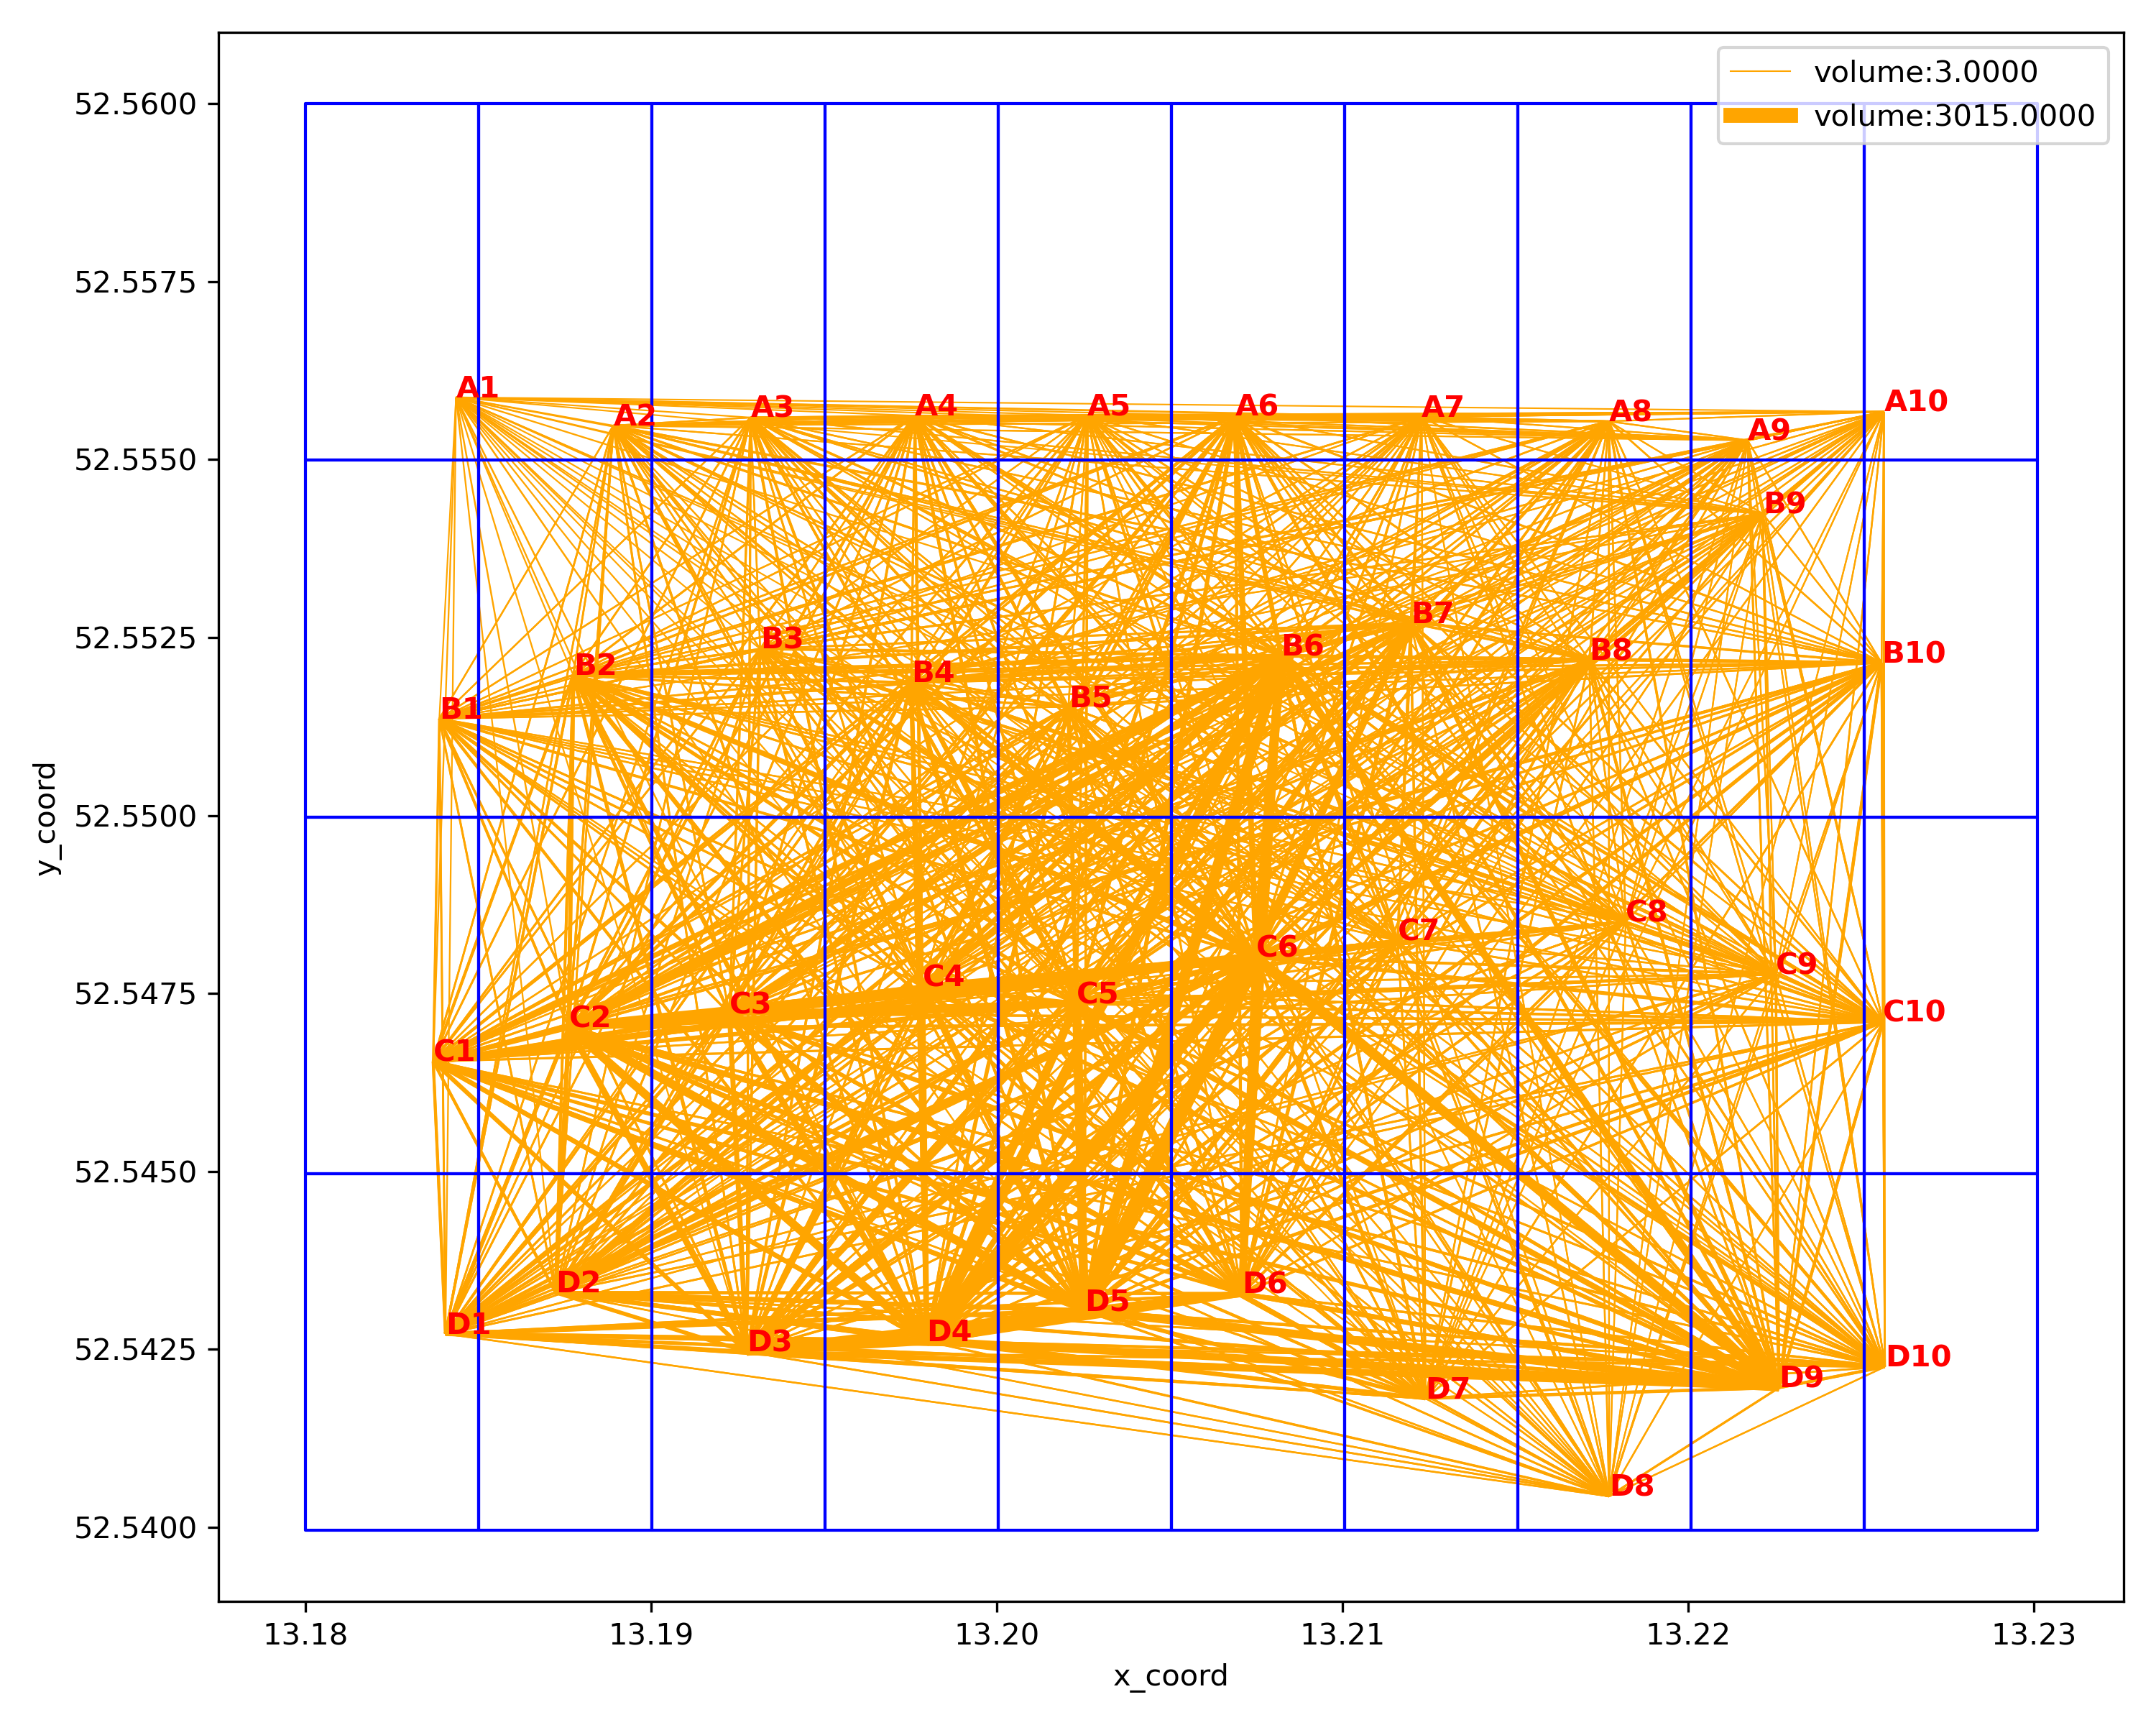
Step 10: show network demand OD
cf = p4g.show_network_by_demand_OD(mnet=mnet,load_network=True)
cf.show()
Advance Usage
Step 1: Show only network elements of interest
The tool displays all elements by default, such as nodes, links, and POIs. If you want to display only the elements of interest, you can refer to the following example to modify the state of other elements before invoking the drawing command.
# not show nodes
mnet.node_loaded = False
cf = p4g.show_network_by_link_lane_distribution(mnet=mnet)
cf.show()
Step 2: Show different networks on one diagram
By default, this tool will clear the original contents before drawing. If you want to draw different content on a graph, you can refer to the following example
mnet.node_loaded = False
mnet.POI_loaded = False
cf = p4g.show_network_by_link_lane_distribution(mnet=mnet)
mnet.link_loaded = False
mnet.POI_loaded = True
cf = p4g.show_network_by_poi_attraction_distribution(mnet,fig_obj=cf)
cf.show()
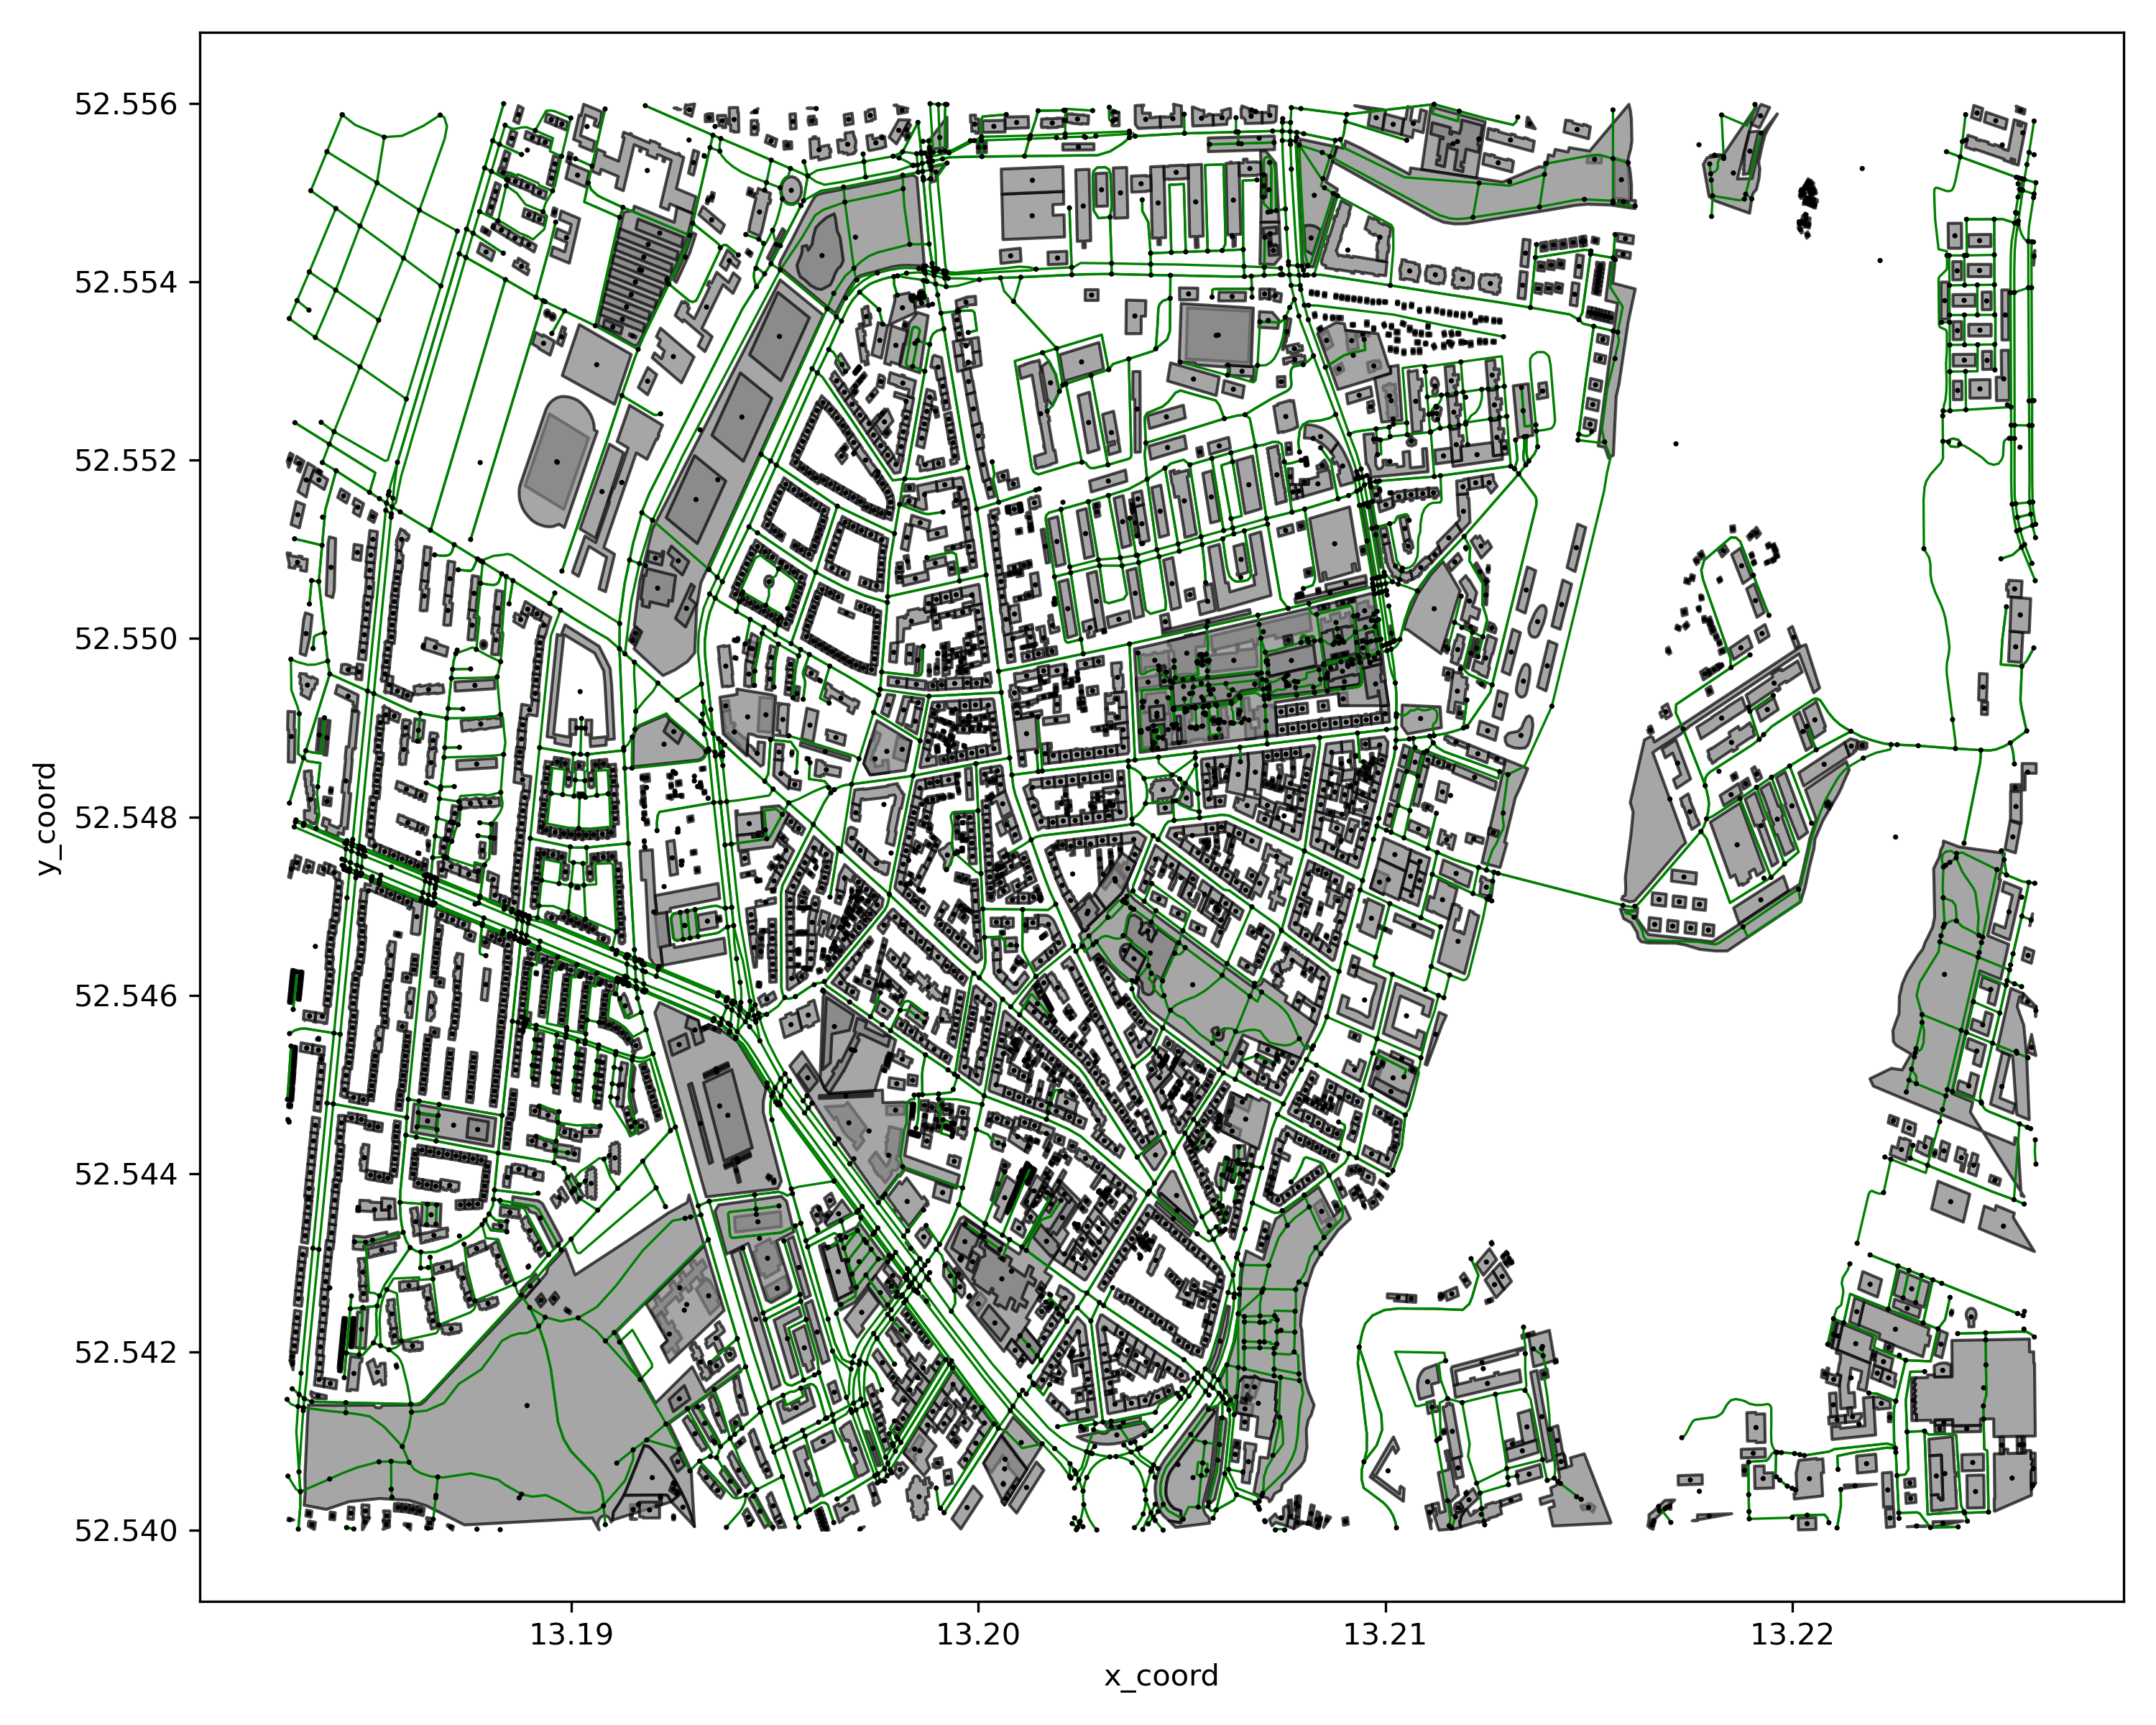
Step 3: Set the drawing style
Users can refer to the following examples to adjust the color, size and other attributes of the image before drawing.
| parameter | Value | Description |
|---|---|---|
| mnet.style.figure_size | tuple,(width,height) | Image size |
| mnet.style.dpi | int | the resolution in dots per inch. |
| mnet.style.node_style.size | int | node marker size |
| mnet.style.node_style.colors | dict,{node_type:color} | node color in different types |
| mnet.style.node_style.markers | dict,{node_type:marker} | node marker in different types |
| mnet.style.link_style.linecolor | str | link color |
| mnet.style.link_style.linewidth | float | link width |
| mnet.style.poi_style.facecolor | str | POI facecolor |
| mnet.style.poi_style.edgecolor | str | POI edgecolor |
| mnet.style.demand_style.linecolor | str | demand flow line color |
| mnet.style.demand_style.linelinewidth | float | demand flow line width |
| mnet.style.zone_style.linewidth | float | zone grid line width |
| mnet.style.zone_style.edgecolors | str | zone grid edgecolors |
| mnet.style.zone_style.fontsize | int | zone label font size |
| mnet.style.zone_style.fontcolor | str | zone label font color |
mnet.style.node_style.size = 3
mnet.style.link_style.linecolor = 'green'
mnet.style.poi_style.facecolor = 'gray'
cf = p4g.show_network_by_modes(mnet=mnet)
cf.show()
Contributing
Feel free to dive in! Open an issue.
Contributors
Changelog
2023-01-25 -- v0.1.1:
Support web-based network visualization(Kepler.gl)
TODO LIST
- Add OD 3D visualization


Download files
Download the file for your platform. If you're not sure which to choose, learn more about installing packages.
Source Distribution
Built Distribution
Filter files by name, interpreter, ABI, and platform.
If you're not sure about the file name format, learn more about wheel file names.
Copy a direct link to the current filters
File details
Details for the file plot4gmns-0.1.4.tar.gz.
File metadata
- Download URL: plot4gmns-0.1.4.tar.gz
- Upload date:
- Size: 27.0 kB
- Tags: Source
- Uploaded using Trusted Publishing? No
- Uploaded via: twine/6.1.0 CPython/3.12.7
File hashes
| Algorithm | Hash digest | |
|---|---|---|
| SHA256 |
7e8e89126cd8acf2695f35e3204c1744ed52392c9b695d1d75220b7e98fc6c8f
|
|
| MD5 |
4f4a5185e84171e2afa6859fb09b28d8
|
|
| BLAKE2b-256 |
801d512289a51cb437f0866964105dc500403c21546aa7cdd869aed8af21f6d7
|
File details
Details for the file plot4gmns-0.1.4-py3-none-any.whl.
File metadata
- Download URL: plot4gmns-0.1.4-py3-none-any.whl
- Upload date:
- Size: 23.6 kB
- Tags: Python 3
- Uploaded using Trusted Publishing? No
- Uploaded via: twine/6.1.0 CPython/3.12.7
File hashes
| Algorithm | Hash digest | |
|---|---|---|
| SHA256 |
95973e6d25e51c78e2e379966b3e62c369055d67c54569ce5d414a9b7a078445
|
|
| MD5 |
914f78b5386d0e7f7e6eb28a047bad54
|
|
| BLAKE2b-256 |
0609869583f664205fdc8db1f5a3438774cef93a8415974d21ff7a61aeaf56ca
|


