

plotEZ
Mundane plotting made easy.









plotez is a Python library that simplifies common matplotlib plotting tasks with an intuitive API. Create complex
plots
with minimal boilerplate code.
Project Status
| Item | Status |
|---|---|
| Latest version | v0.4.0 |
| Python support | 3.10 · 3.11 · 3.12 |
| Test coverage | 85%+ |
| Type hints | PEP 561 compliant (py.typed) |
| Documentation | Read the Docs |
| Changelog | CHANGELOG |
| License | MIT |
Features
- Simple API: Create complex plots with just a few lines of code
- Error Bar Plotting: Comprehensive error bar support with enhanced styling options
- Error Band Plotting: Shaded error band support via
plot_errorband,plot_errorband_relative, andErrorBandConfig - Histogram & Density Plotting:
plot_histandplot_densitywithHistogramConfig/hgc - Bar & Horizontal Bar Plotting:
plot_barandplot_barhwithBarPlotConfig, including per-bar styling via list-valued parameters - Dual-Axis Support: Easy creation of dual y-axis or dual x-axis plots
- Multi-Panel Layouts: Flexible subplot arrangements with automatic labeling
- File Integration: Direct plotting from CSV files
- Extensive Customization: Full control over plot appearance via parameter classes
- Opt-In Styling: Publication-ready style convention is off by default (importing plotez never
mutates your project's matplotlib rcParams); opt in via
plotez.enable_style()at runtime or thePLOTEZ_AUTO_STYLEenvironment variable at import time - Custom Exceptions: Domain-specific exceptions for clear, catchable error handling
- Early Input Validation: Clear
ShapeError,DataLengthError, andEmptyDataErrorfailures before matplotlib - Type Safety: Complete type hints for better IDE support and type checking (PEP 561 compliant)
- Well Tested: Comprehensive test suite with 85%+ coverage
Installation
From PyPI
pip install plotez
From Source
git clone https://github.com/syedalimohsinbukhari/plotez.git
cd plotez
pip install -e .
Development Installation
pip install -e ".[dev]"
Quick Start
import numpy as np
from plotez import plot_xy

x = np.linspace(0, 10, 100)
y = np.sin(x)
plot_xy(x, y)
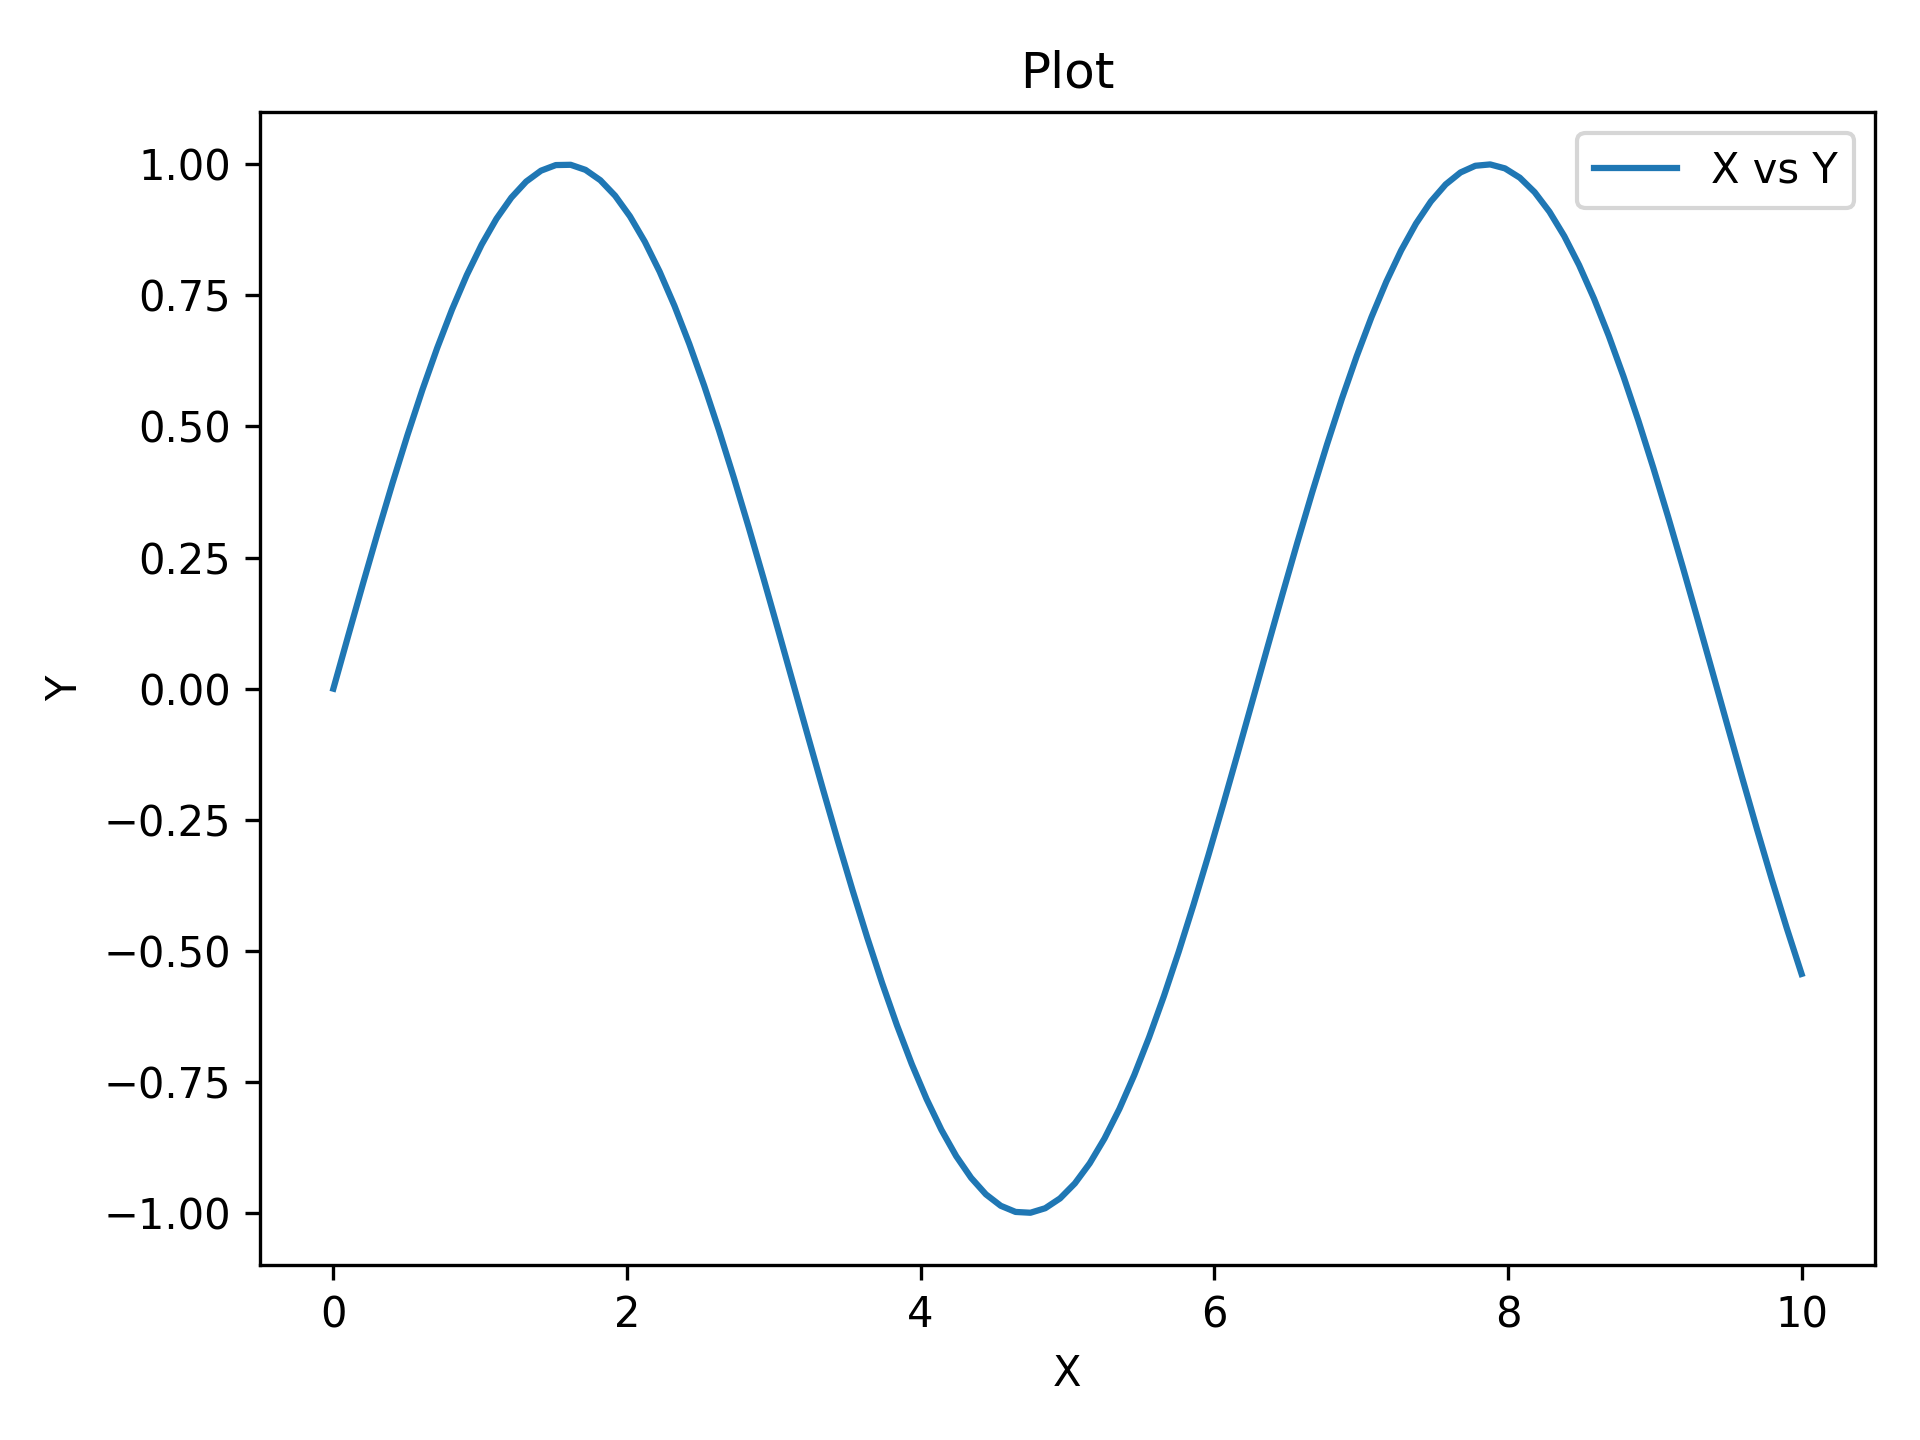
That's it. Three lines for a labeled plot.
Examples
Scientific Error Bars
import numpy as np
from plotez import ErrorPlotConfig, plot_errorbar

rng = np.random.default_rng(1234)

x = np.linspace(0, 10, 20)
y = np.sin(x)
y_err = 0.2 * rng.random(size=y.shape)

ep = ErrorPlotConfig(color="darkblue", marker="o", capsize=5, ecolor="red", markerfacecolor="lime")
plot_errorbar(x, y, y_err=y_err, errorbar_config=ep)
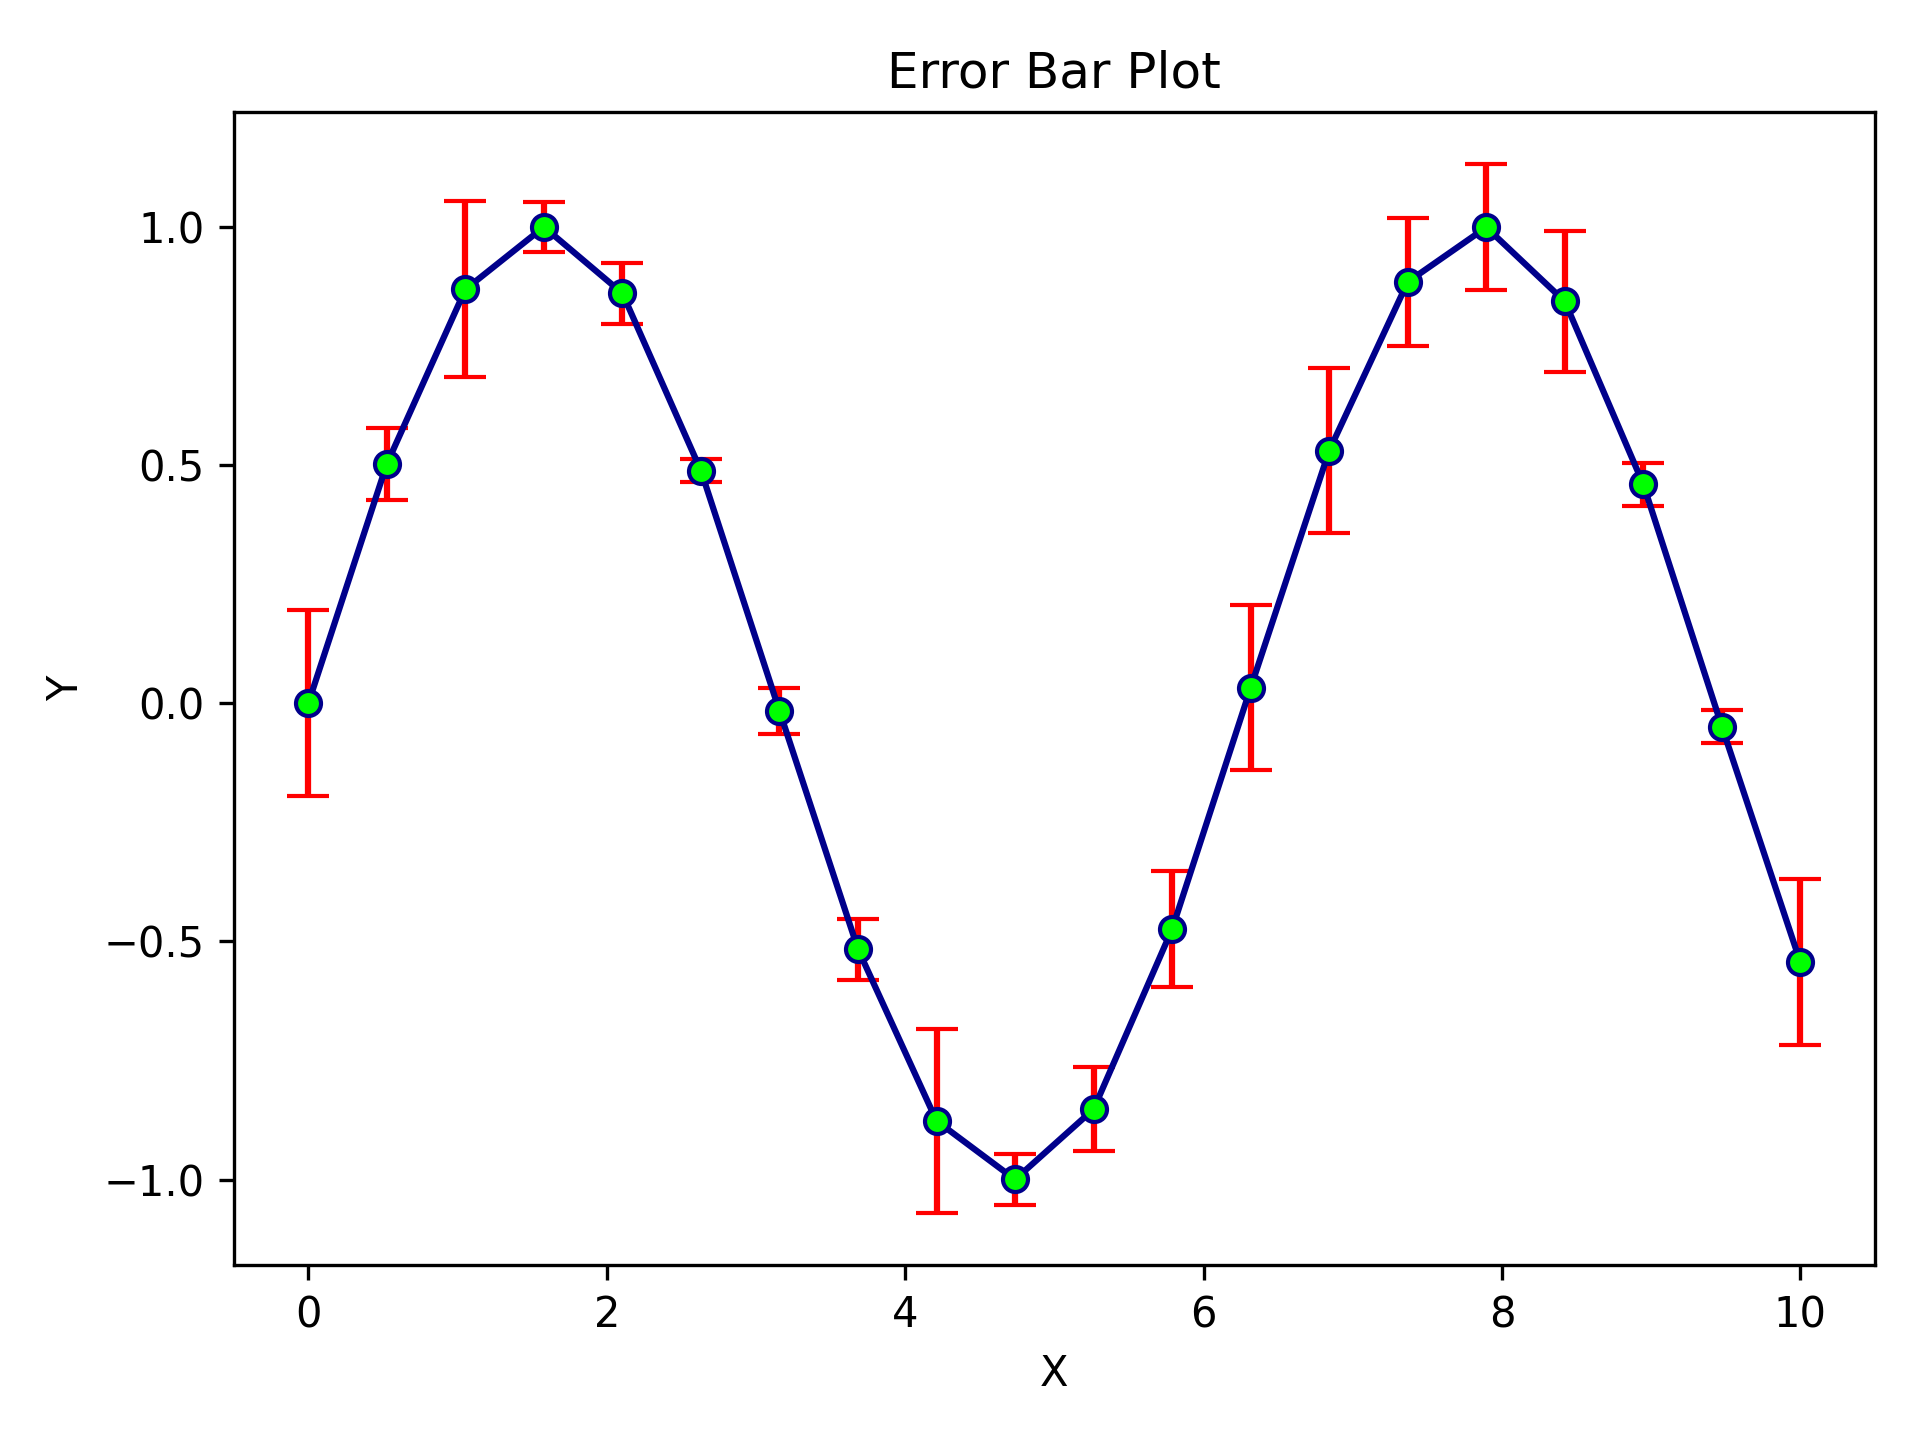
Professional error bars in a few lines of config. ecolor sets the error bar colour independently from the line colour.
Dual Y-Axis
import numpy as np
from plotez import plot_xyy

x = np.linspace(0, 10, 100)
y1 = np.sin(x)
y2 = np.exp(-x / 10)

plot_xyy(x, y1, y2, x_label="Time (s)", y1_label="Signal (V)", y2_label="Decay",
         data_labels=["Oscillation", "Envelope"])
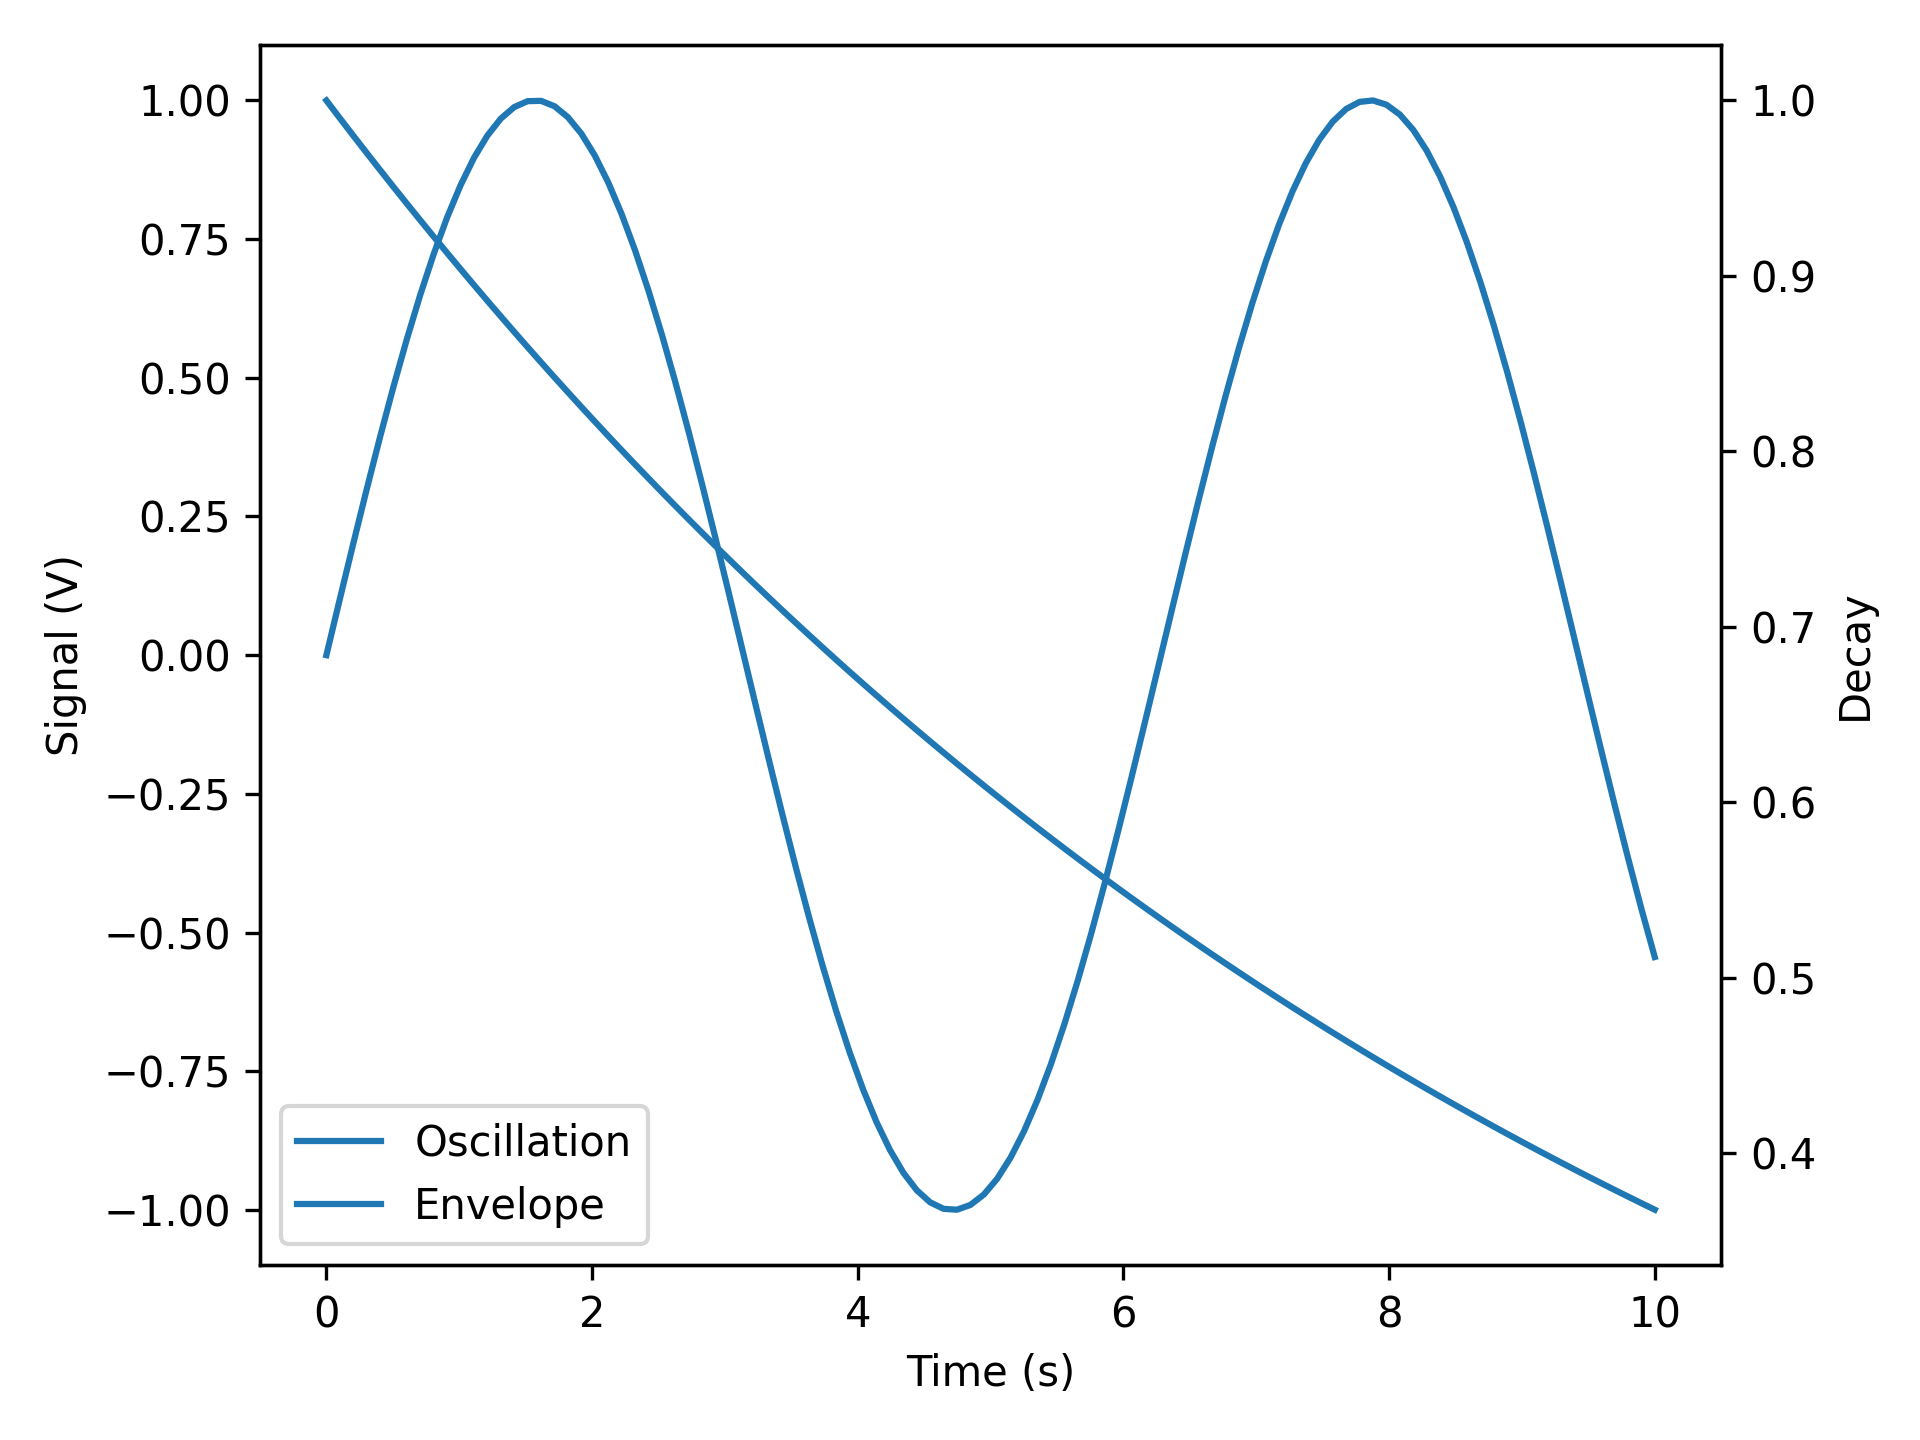
Dual axes done right. No ax.twinx() gymnastics.
Multi-Panel Grid
import numpy as np
from plotez import n_plotter

x_data = [np.linspace(0, 10, 100) for _ in range(4)]
y_data = [np.sin(x_data[0]), np.cos(x_data[1]),
          np.tan(x_data[2] / 5), x_data[3] ** 2 / 100]

n_plotter(x_data, y_data, n_rows=2, n_cols=2)
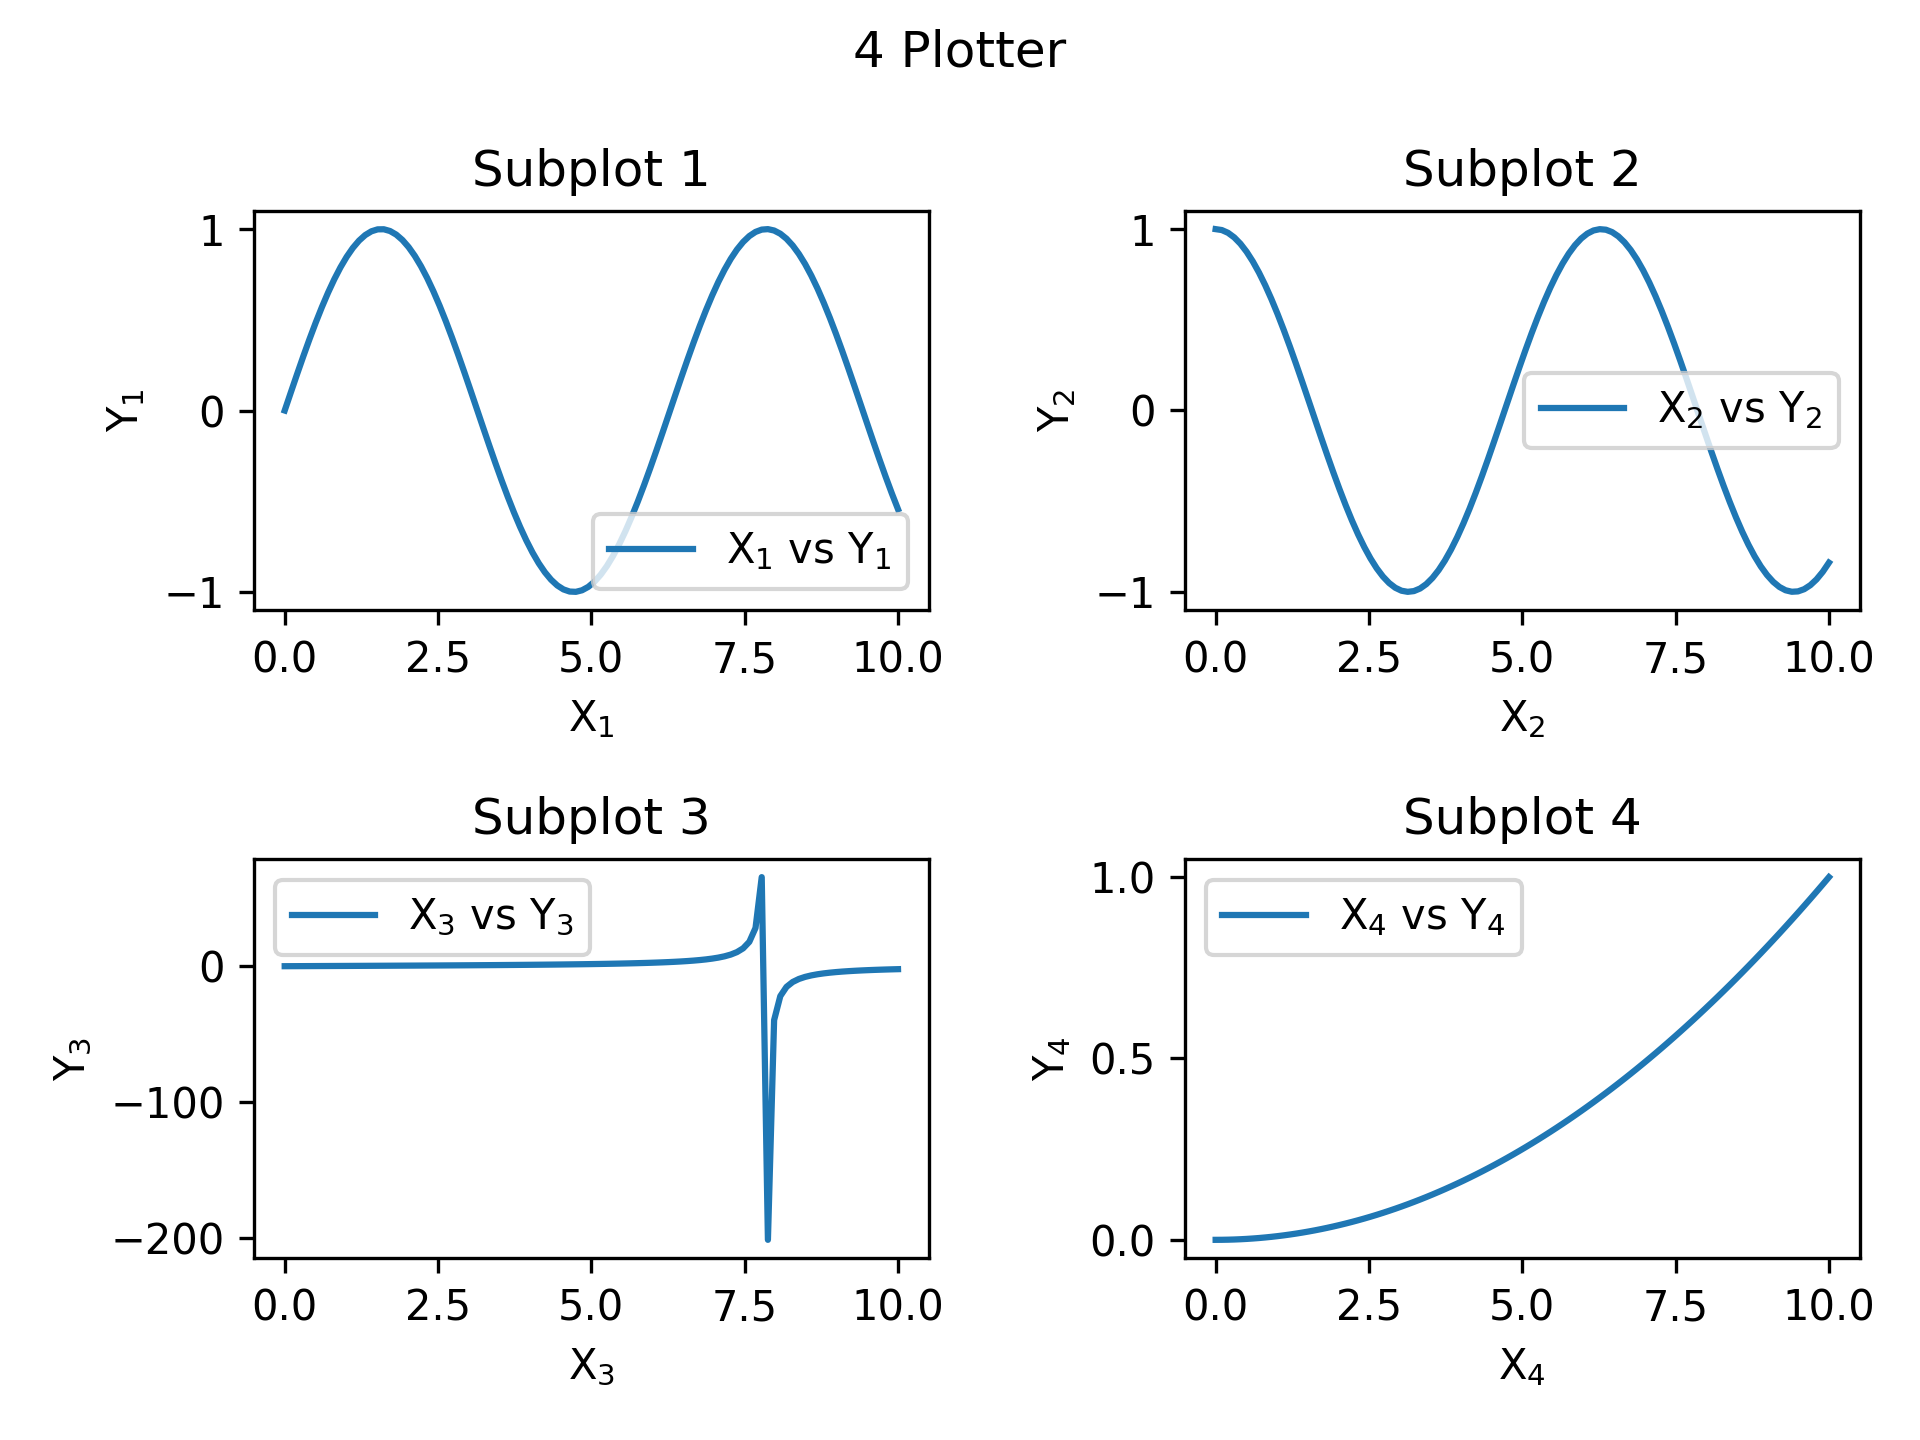
Four plots, one function call.
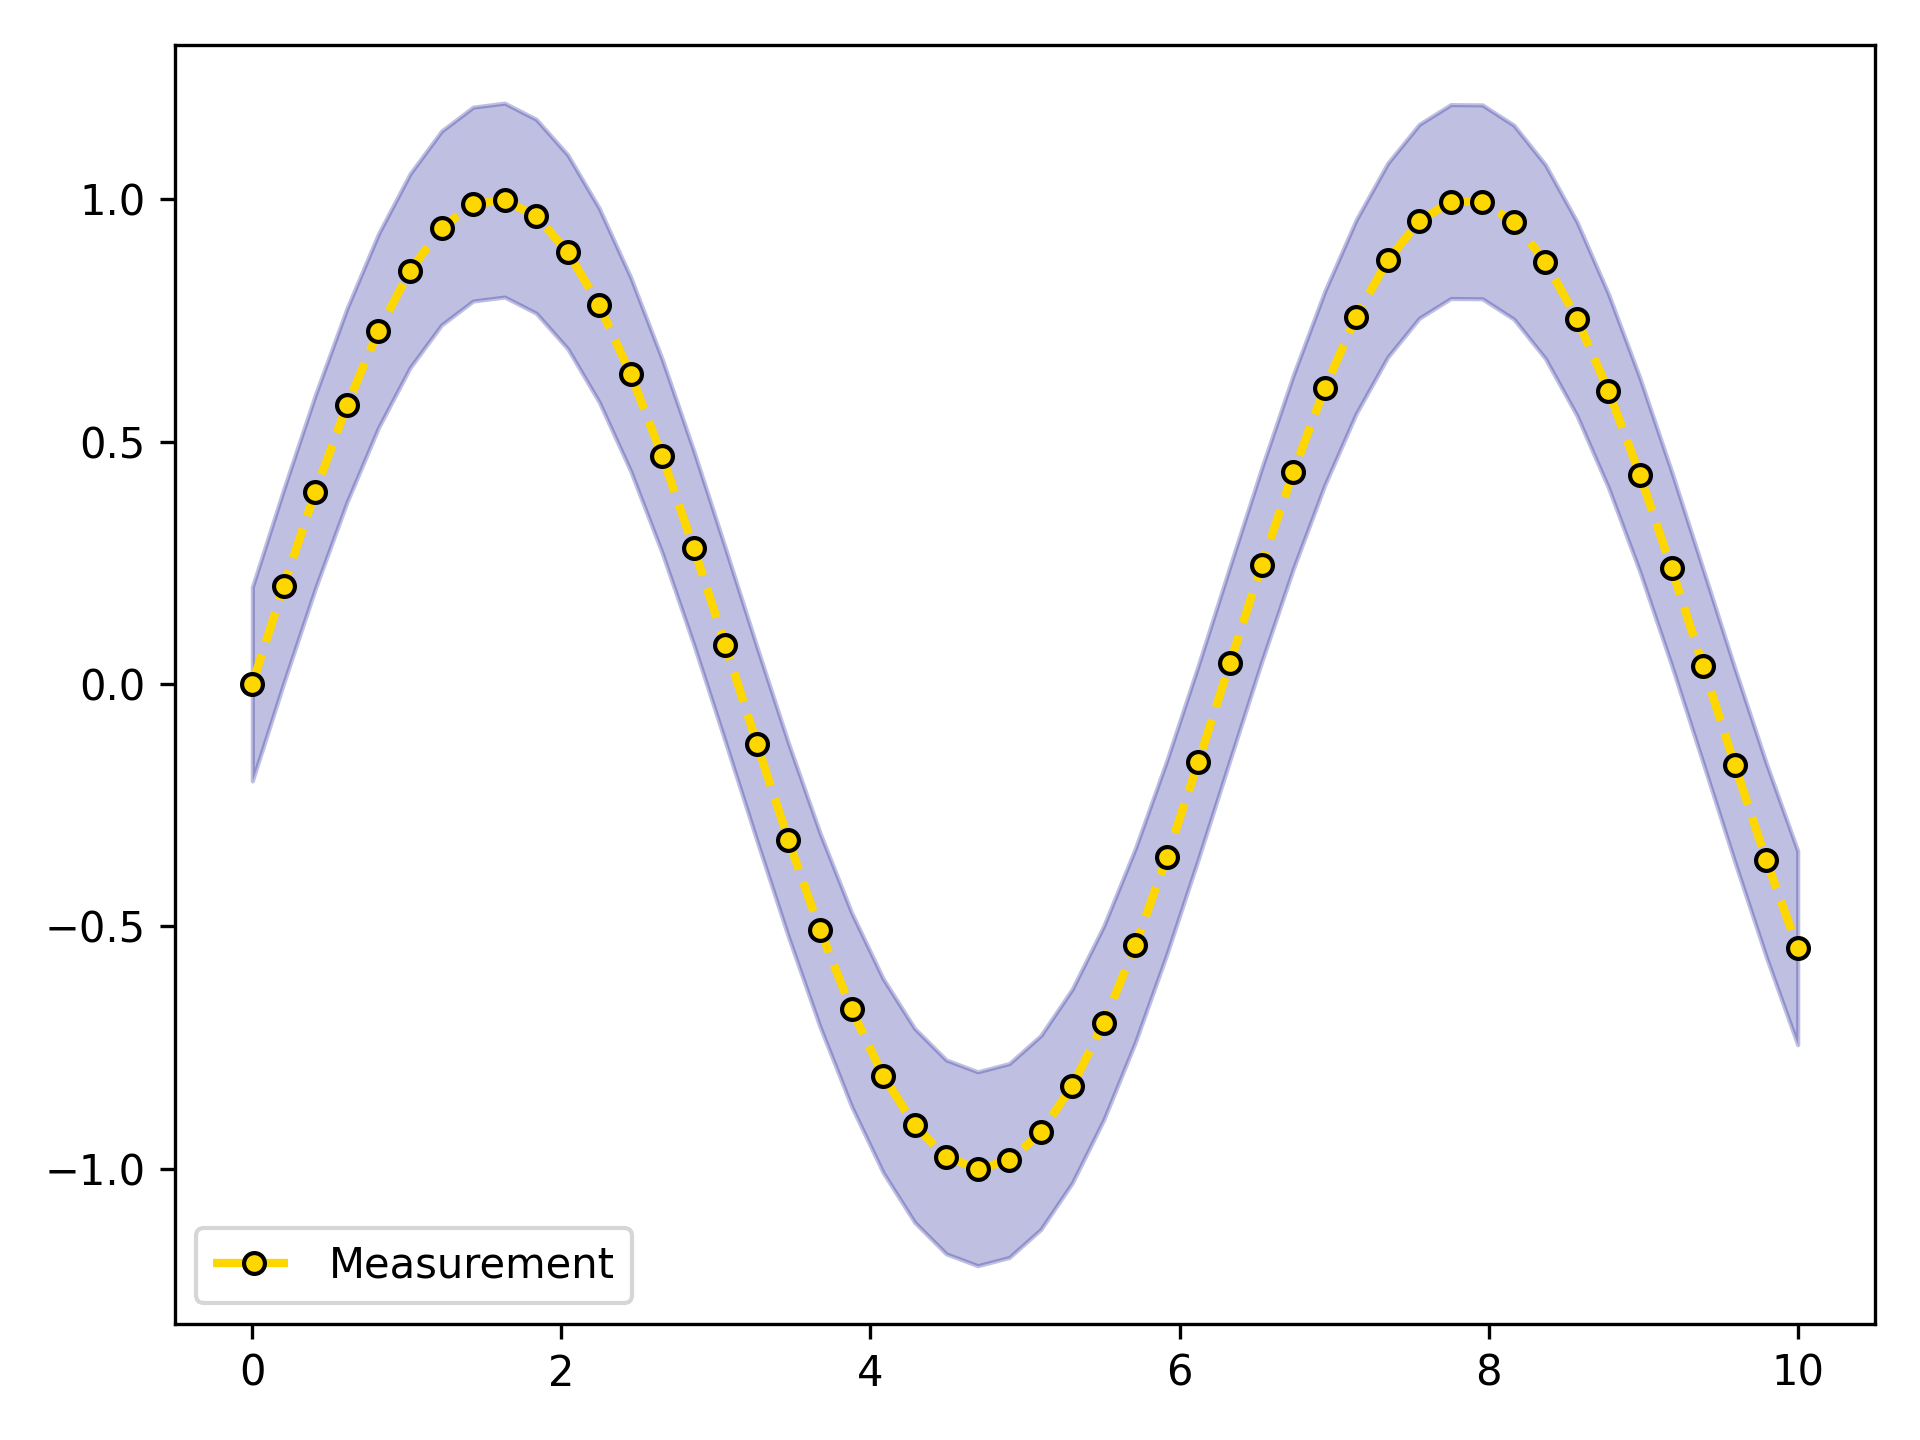
Error Bands
Use ErrorBandConfig and LinePlotConfig for explicit, IDE-friendly configuration:
import numpy as np
from plotez import ErrorBandConfig, LinePlotConfig, plot_errorband

x = np.linspace(0, 10, 50)
y = np.sin(x)
y_lower = y - 0.2
y_upper = y + 0.2

band_config = ErrorBandConfig(color="darkblue", alpha=0.25)
plot_config = LinePlotConfig(color="gold", linewidth=2, linestyle="--",
                             marker="o", markersize=5, markeredgecolor="k")

plot_errorband(x, y, y_lower, y_upper,
               data_label="Measurement", band_config=band_config, line_config=plot_config)
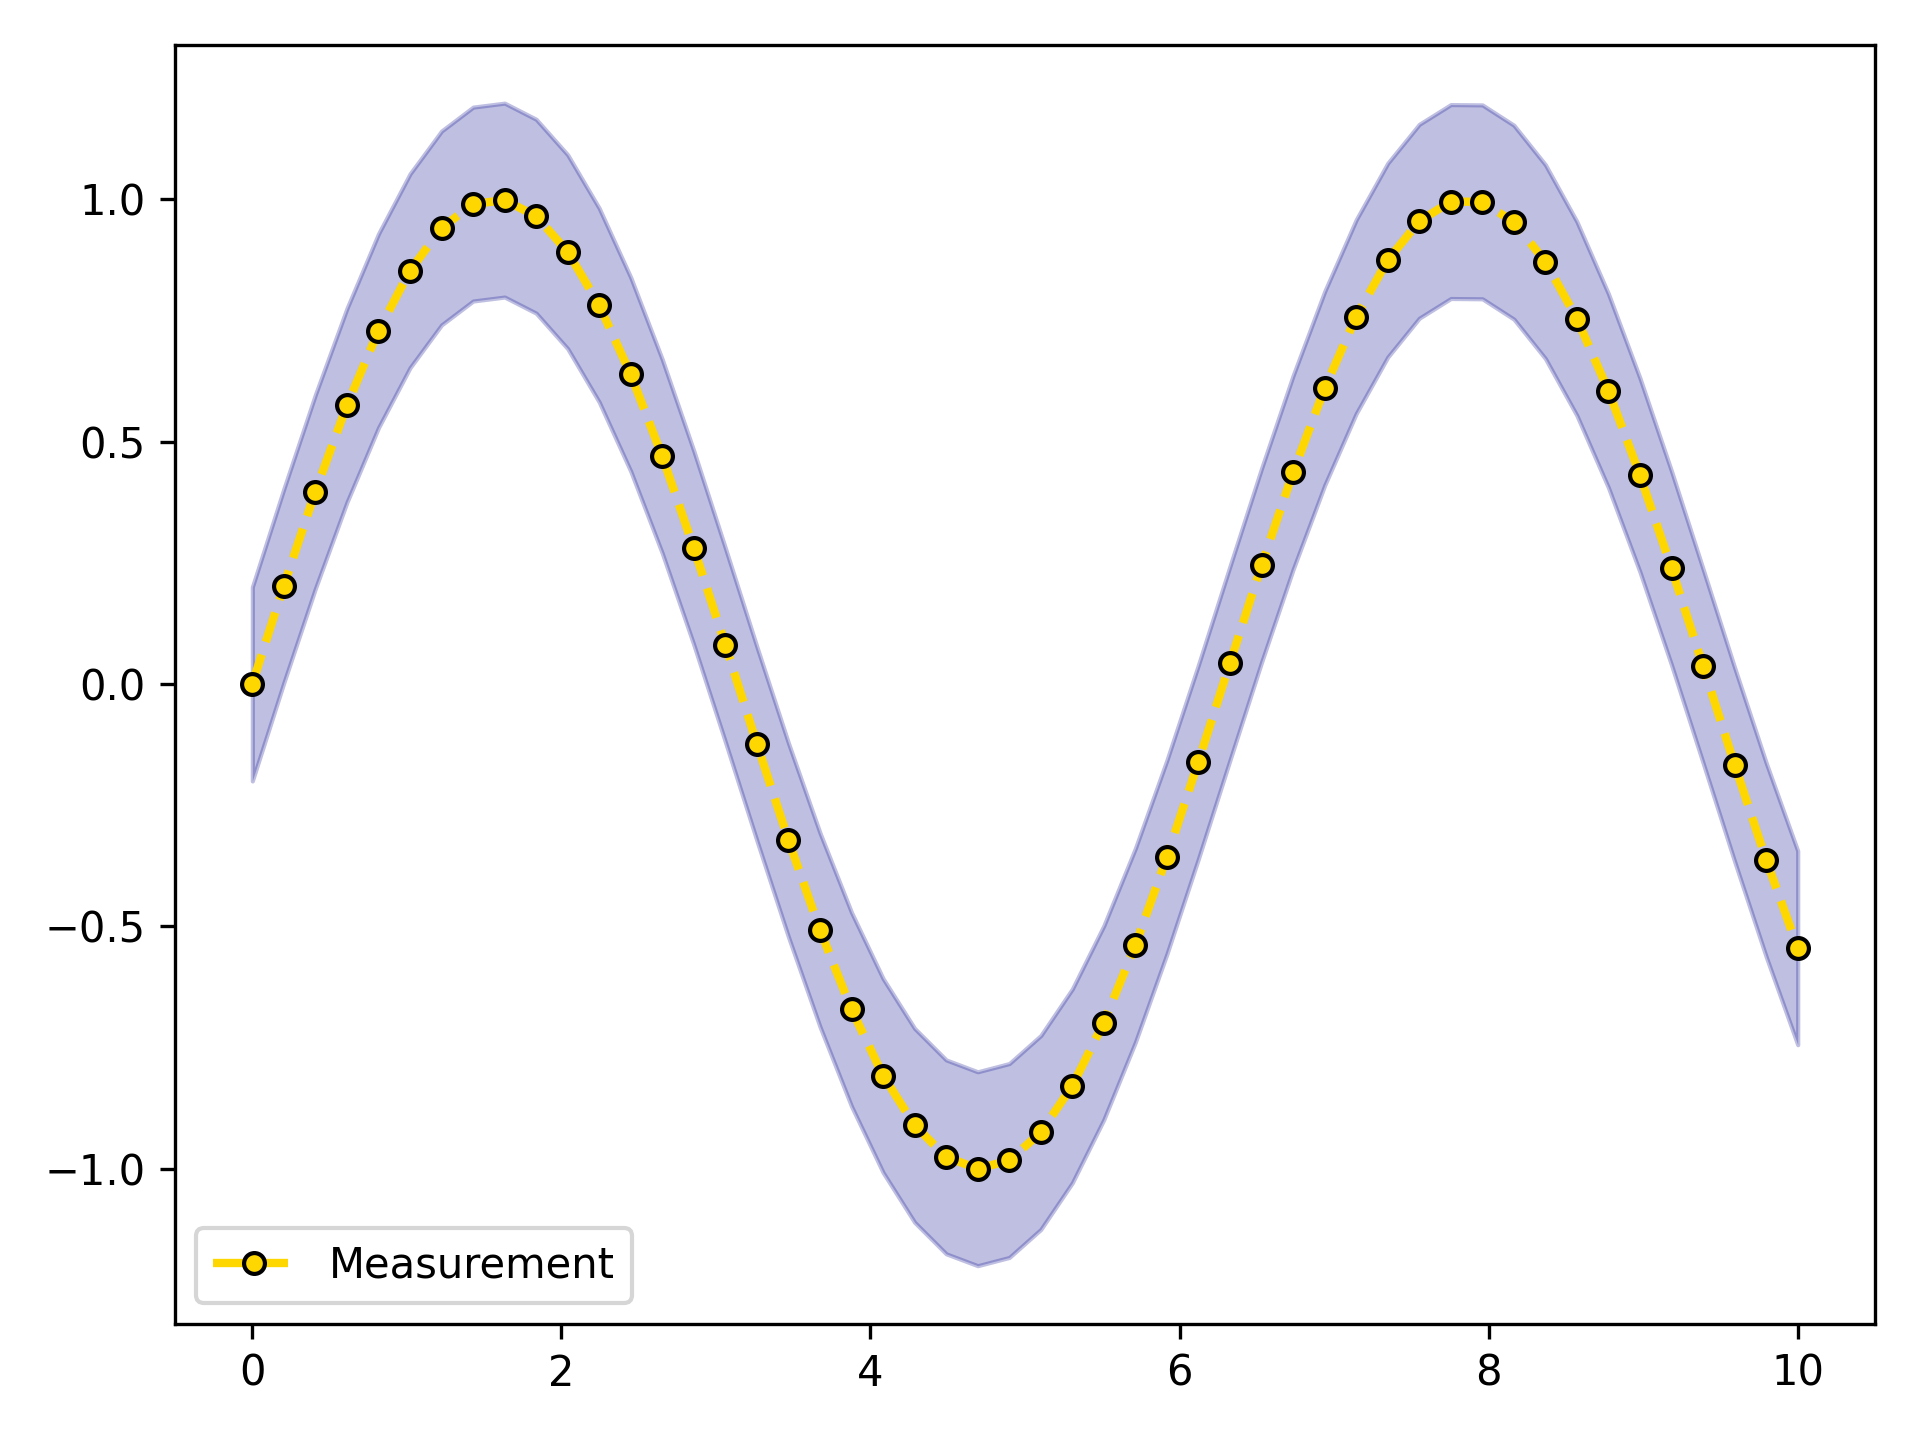
The same result using the ebc / lpc shorthand aliases — familiar matplotlib parameter names, no class imports
needed:
import numpy as np
from plotez import ebc, lpc, plot_errorband

x = np.linspace(0, 10, 50)
y = np.sin(x)
y_lower = y - 0.2
y_upper = y + 0.2

band_config = ebc(c="darkblue", alpha=0.25)
plot_config = lpc(c="gold", lw=2, ls="--", marker="o", ms=5, mec="k")

plot_errorband(x, y, y_lower, y_upper,
               data_label="Measurement", band_config=band_config, line_config=plot_config)
Full Customization
import numpy as np
from plotez import LinePlotConfig, plot_xyy

x = np.linspace(0, 10, 50)
y1, y2 = np.sin(x), np.cos(x)

config = LinePlotConfig(
    linestyle=["--", "-."],
    color=["crimson", "gold"],
    marker=["o", "s"],
    markersize=[8, 8],
    markeredgecolor=["black", "black"],
    _extra={"markevery": [5, 5]},
)

plot_xyy(x, y1, y2, plot_config=config)
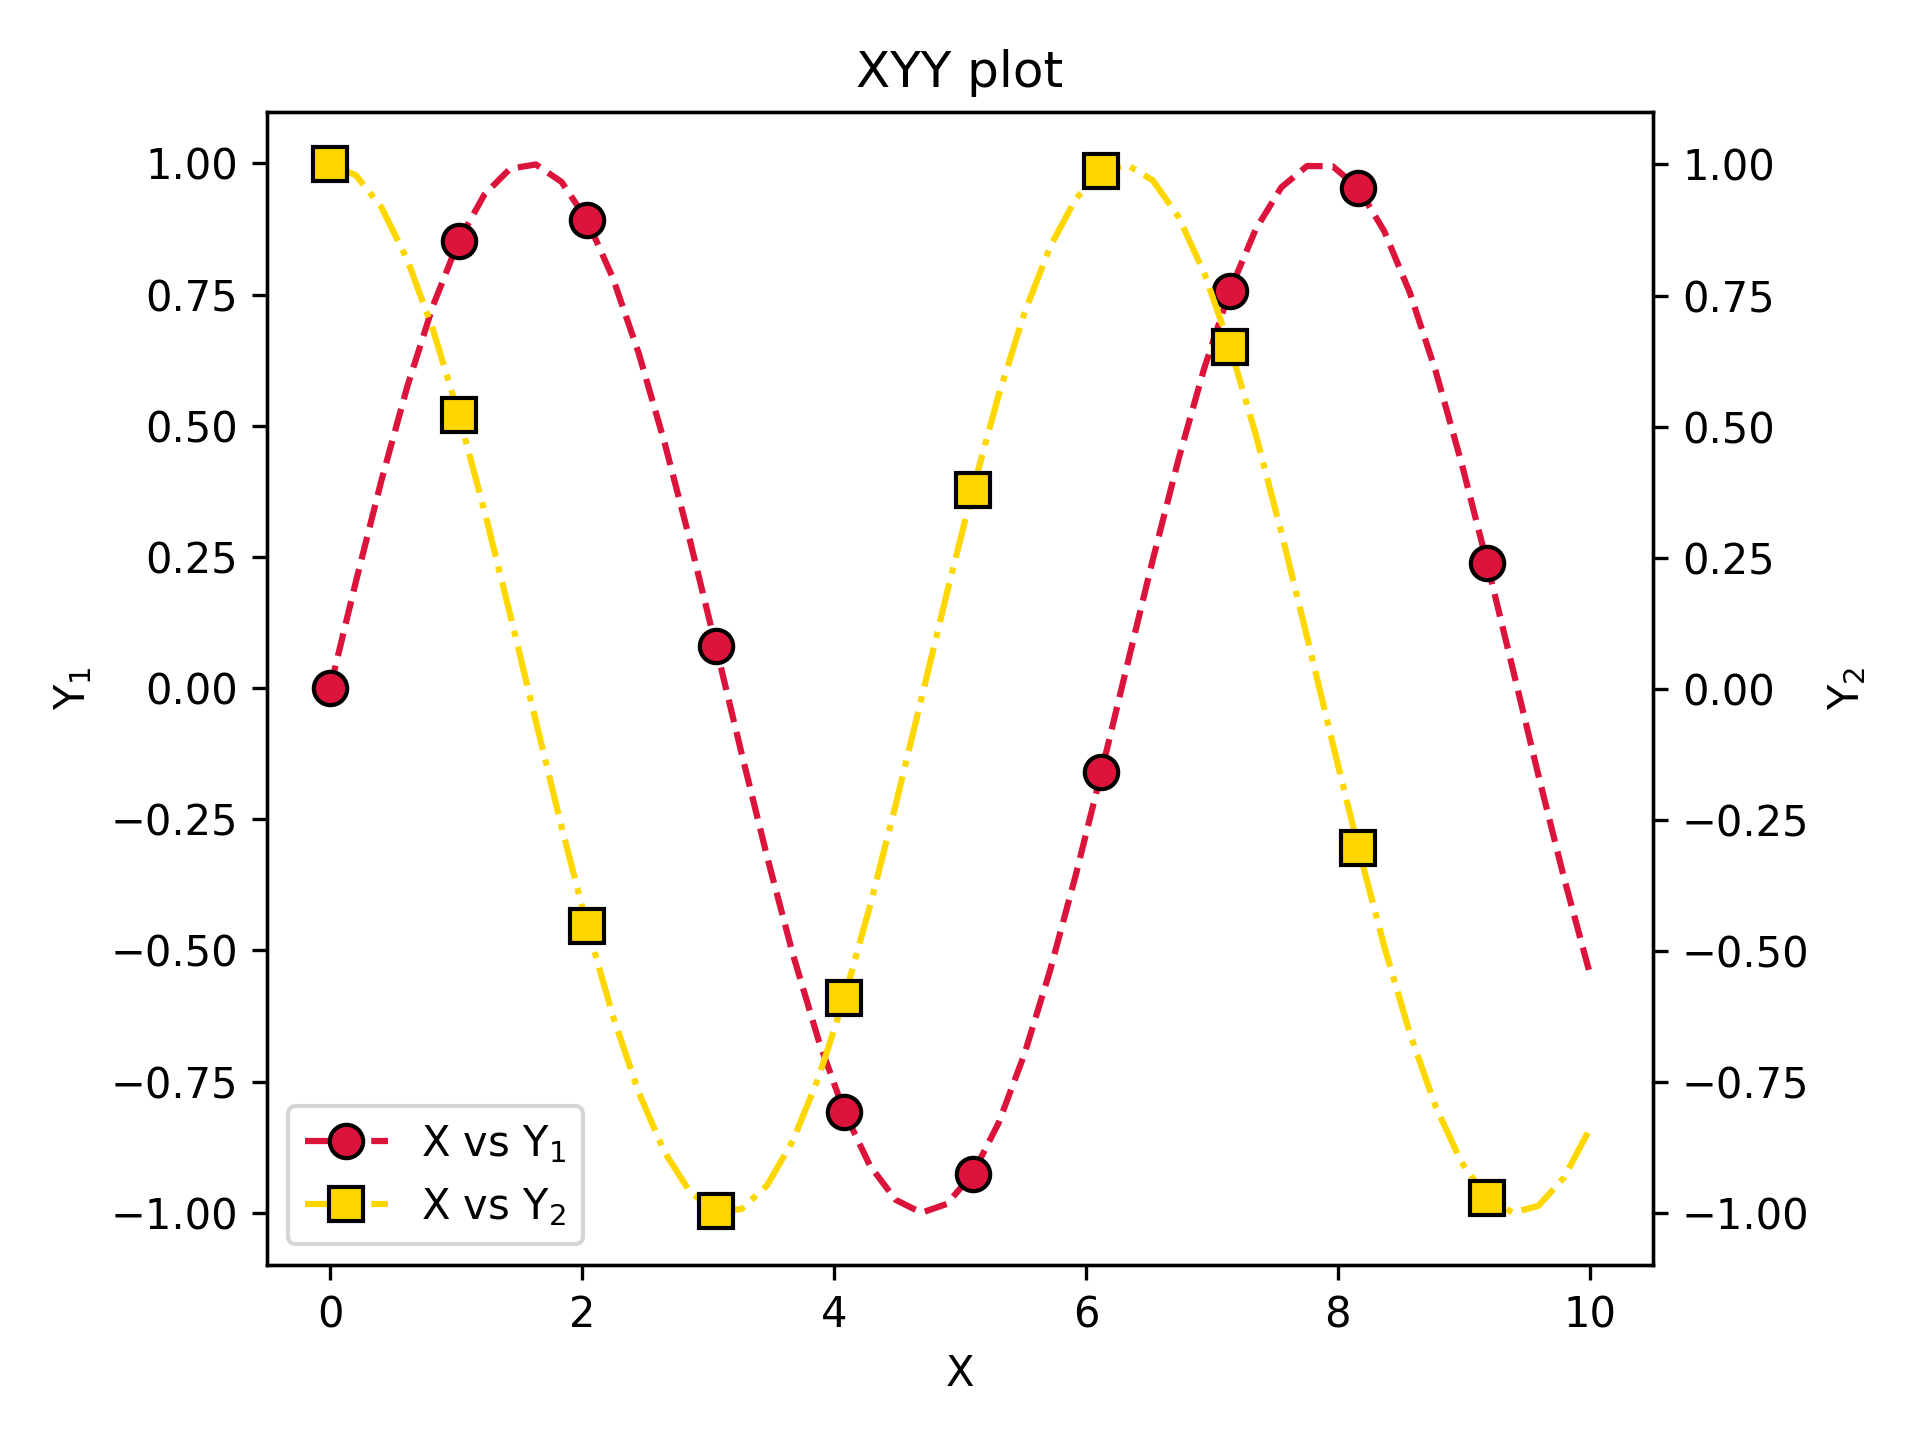
Config classes for when defaults aren't enough. Use _extra to pass any matplotlib parameter not covered by the
dataclass fields.
Histogram / Density
Use plot_hist with the hgc shorthand to configure and plot a histogram in one go.
Switch to plot_density to get normalised probability density instead of raw counts — everything else stays the same.
Both functions accept one 1D dataset per call.
import numpy as np
from plotez import hgc, plot_hist

rng = np.random.default_rng(42)
data = rng.normal(loc=0, scale=1, size=5000)

h_cfg = hgc(bins=40, color="steelblue", ec="white", alpha=0.8)
plot_hist(data, x_label="Value", y_label="Counts",
          plot_title="Histogram of Normal Distribution",
          data_label="Normal", hist_config=h_cfg)
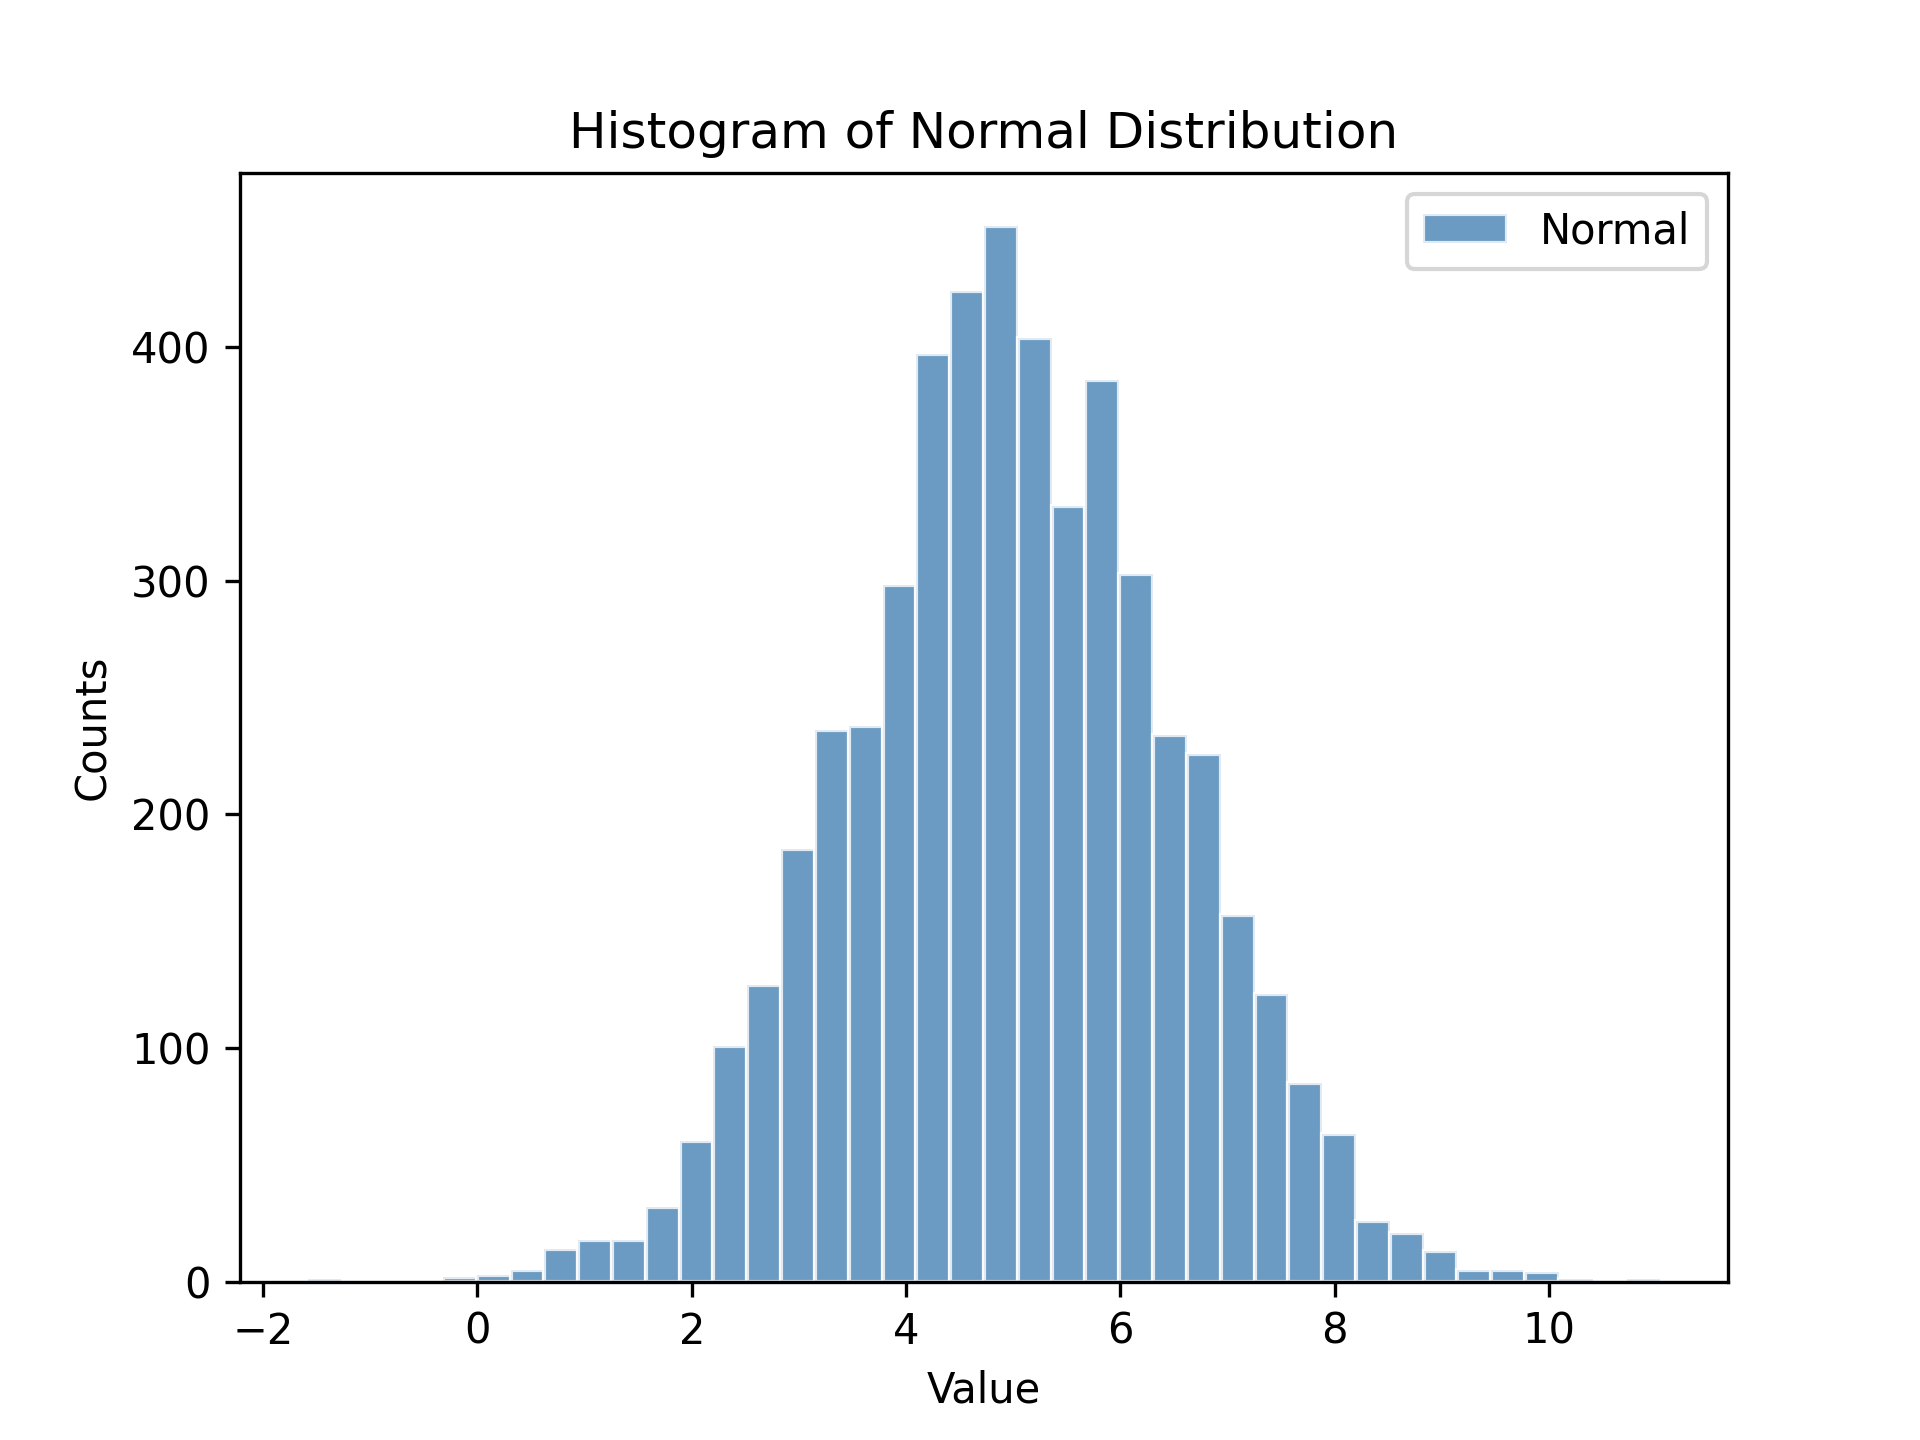
Swap plot_hist for plot_density to get the probability density on the y-axis.
Bar Plots
plot_bar and plot_barh share a BarPlotConfig; pass a list for color, edgecolor, linewidth, alpha,
width, or hatch to style each bar individually.
import numpy as np
from plotez import BarPlotConfig, plot_bar

categories = ["A", "B", "C", "D", "E"]
values = np.array([23, 45, 12, 39, 28])

b_cfg = BarPlotConfig(color="steelblue", edgecolor="black", alpha=0.85)
plot_bar(categories, values, x_label="Category", y_label="Value", bar_config=b_cfg)
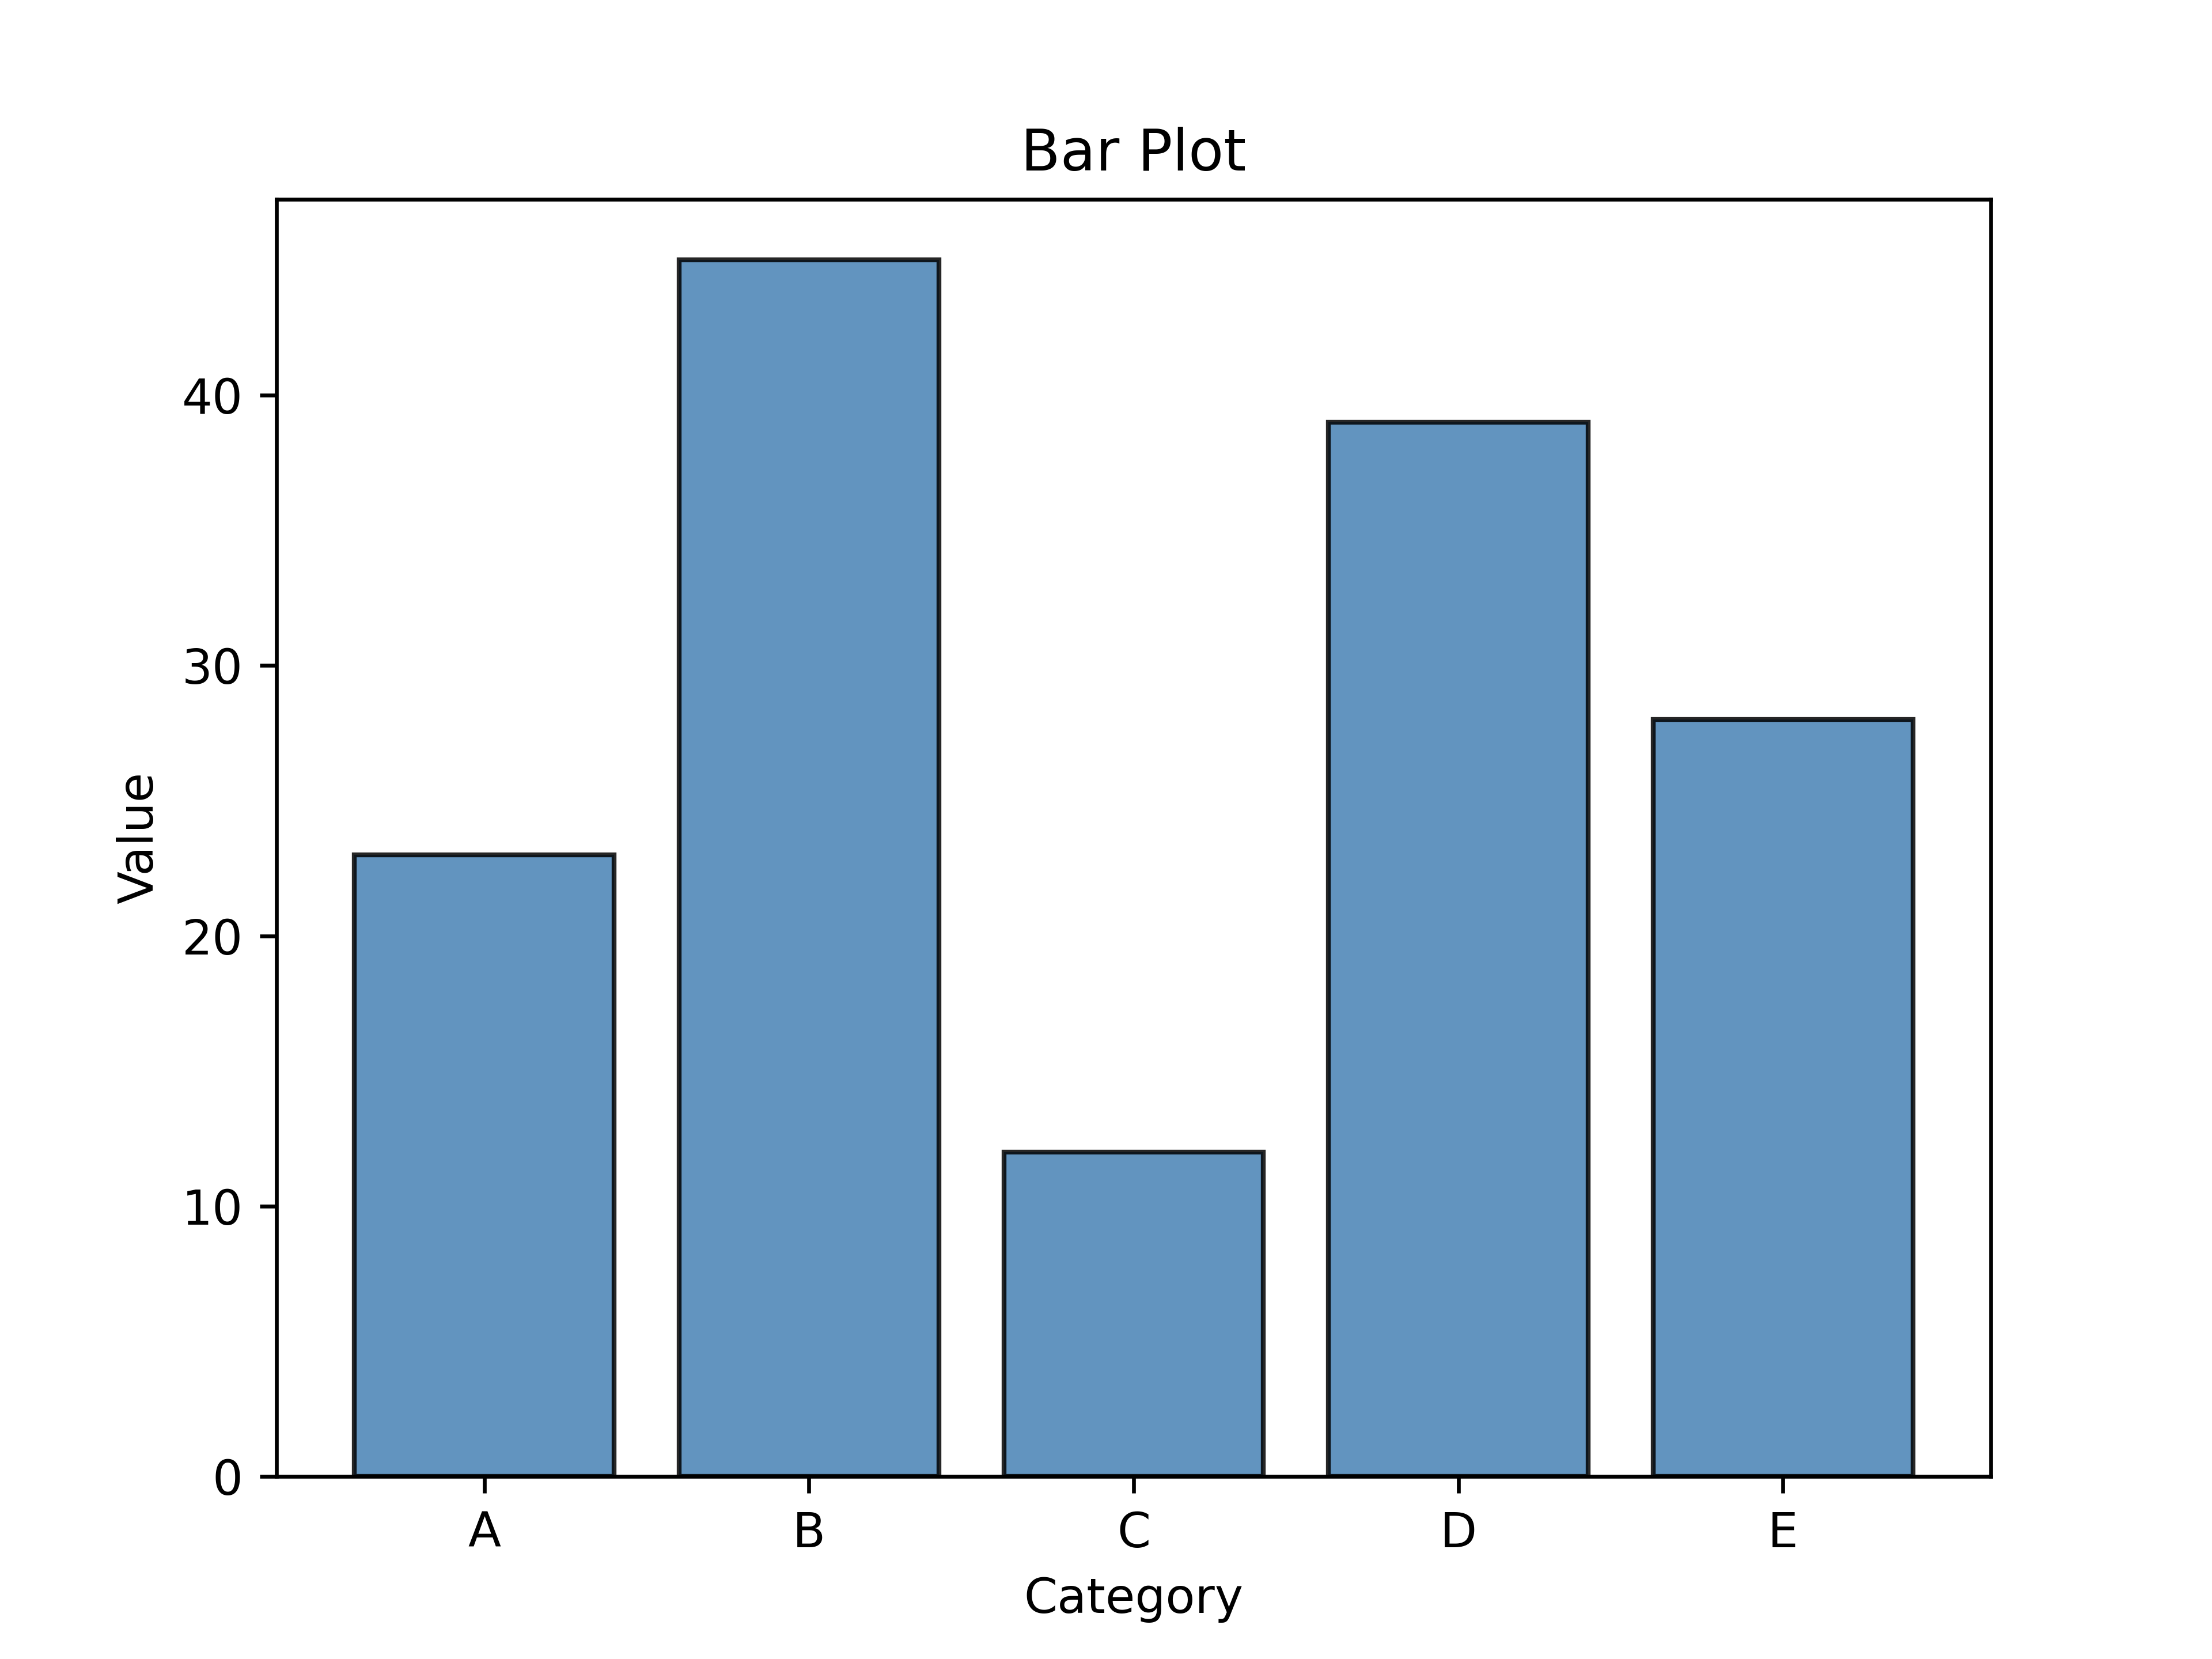
Swap plot_bar for plot_barh to flip to horizontal bars — x_data stays the categories, y_data stays the bar
lengths.
Opt-In Styling
plotez never changes your project's global matplotlib style just because you imported it. Call
plotez.enable_style() to apply its publication-ready convention (serif fonts, grid, tick geometry) at
runtime, and plotez.disable_style() to revert to matplotlib's own defaults — or set
PLOTEZ_AUTO_STYLE=1 in the environment before import plotez to apply it automatically.
import matplotlib.pyplot as plt
import numpy as np

import plotez
from plotez import plot_errorbar

rng = np.random.default_rng(7)

x = np.linspace(0, 10, 20)
y = np.sin(x)
y_err = 0.2 * rng.random(size=y.shape)


fig = plt.figure(figsize=(15, 4.5))

ax1 = fig.add_subplot(1, 3, 1)
plot_errorbar(x, y, y_err=y_err,
              plot_title="Default (no plotez style)", axis=ax1)

plotez.enable_style()
ax2 = fig.add_subplot(1, 3, 2)
plot_errorbar(x, y, y_err=y_err,
              plot_title="After enable_style()", axis=ax2)

plotez.disable_style()
ax3 = fig.add_subplot(1, 3, 3)
plot_errorbar(x, y, y_err=y_err,
              plot_title="After disable_style()", axis=ax3)
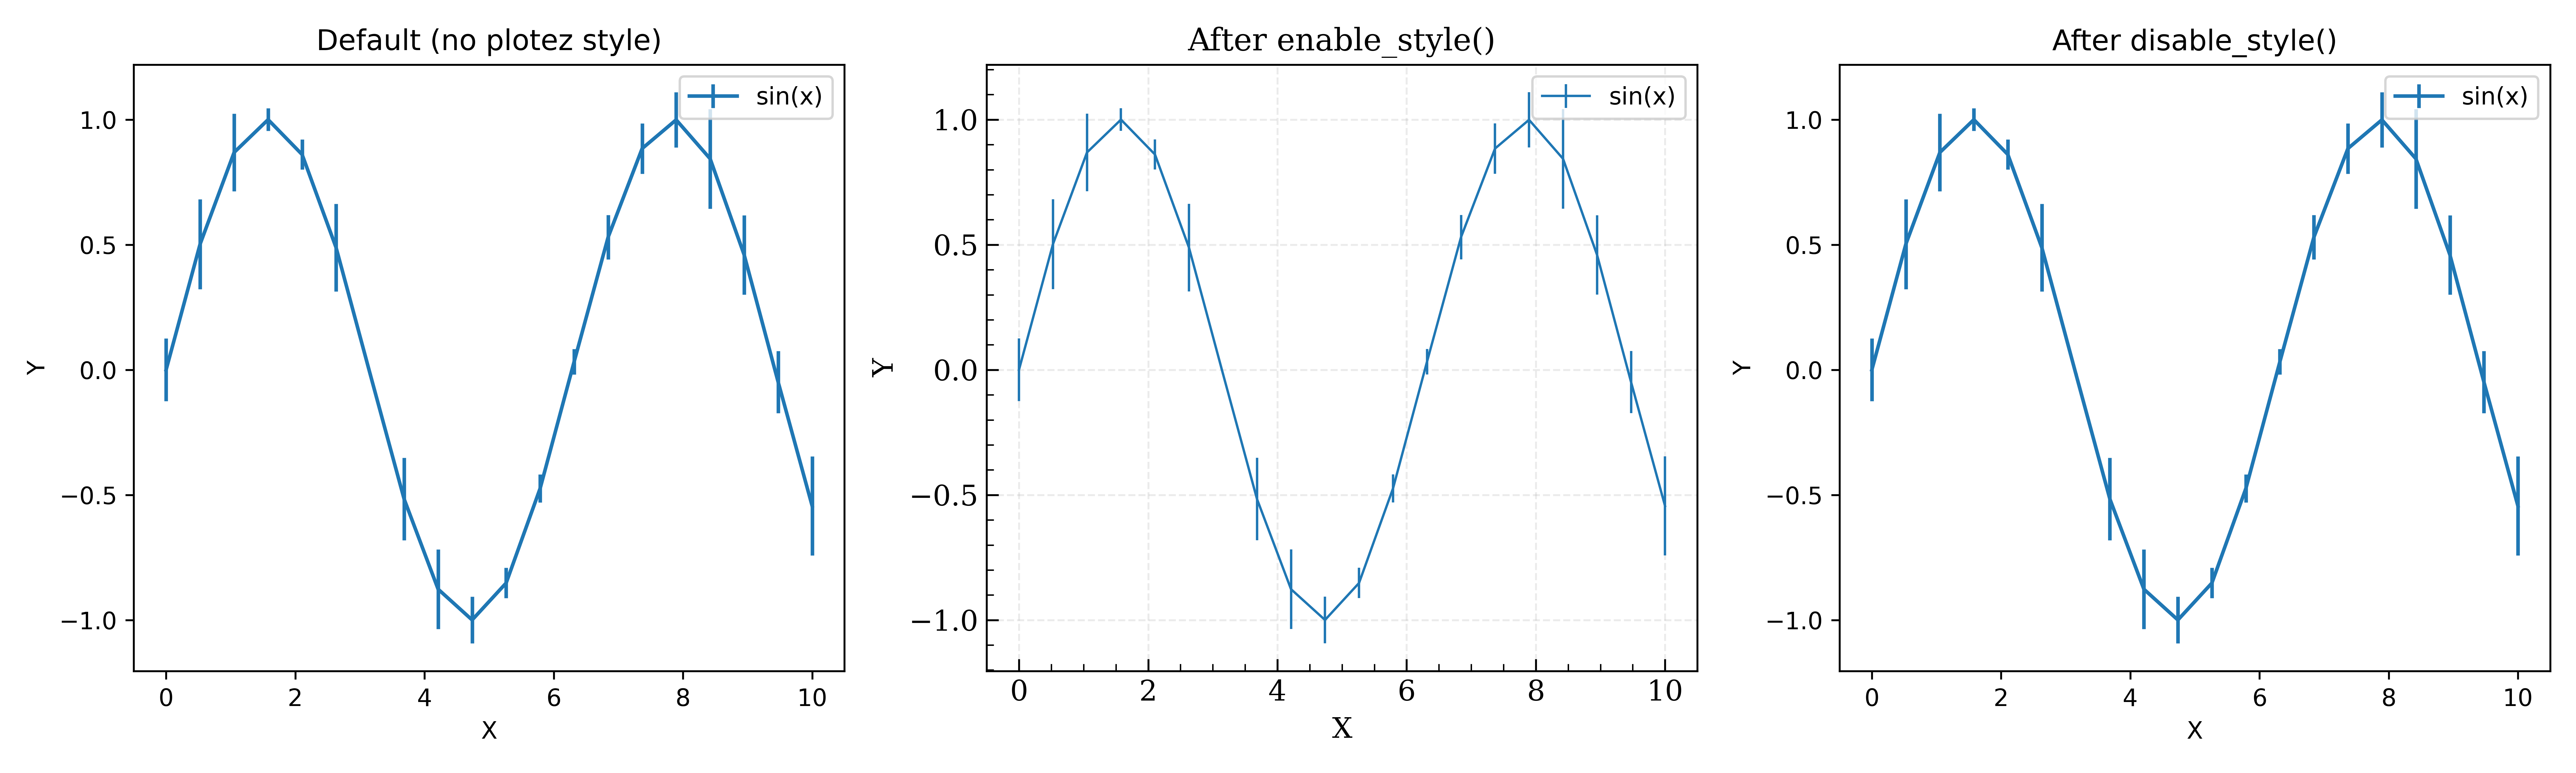
Set PLOTEZ_AUTO_STYLE=1 before import plotez to skip the explicit enable_style() call and apply the
convention globally for the process.
Development
Running Tests
pytest
With Coverage Report
pytest --cov=src/plotez --cov-report=html
Type Checking
mypy src/plotez
Building Documentation
cd docs
make html
Contributing
Contributions are welcome! Please feel free to submit a Pull Request.
License
MIT License – see LICENSE file for details.
Authors
- Syed Ali Mohsin Bukhari - ali.mohsin@ist.edu.pk
Links
1 maintainer

Download files
Download the file for your platform. If you're not sure which to choose, learn more about installing packages.
Source Distribution
Built Distribution
Filter files by name, interpreter, ABI, and platform.
If you're not sure about the file name format, learn more about wheel file names.
Copy a direct link to the current filters
File details
Details for the file plotez-0.4.0.tar.gz.
File metadata
- Download URL: plotez-0.4.0.tar.gz
- Upload date:
- Size: 42.1 kB
- Tags: Source
- Uploaded using Trusted Publishing? No
- Uploaded via:
twine/6.2.0 CPython/3.9.25
File hashes
| Algorithm | Hash digest | |
|---|---|---|
| SHA256 |
ebee8f4a886cf58ed5fe10dd318c2fda7c92e49a562f658bd76b399031fed9a8
|
|
| MD5 |
27c69f863c551f79338c23569e4e3252
|
|
| BLAKE2b-256 |
1ab01ae0940c1bffffb015505dc0ab3199ef5ab5ab0b6b1dc781413fc5d22e81
|
File details
Details for the file plotez-0.4.0-py3-none-any.whl.
File metadata
- Download URL: plotez-0.4.0-py3-none-any.whl
- Upload date:
- Size: 25.6 kB
- Tags: Python 3
- Uploaded using Trusted Publishing? No
- Uploaded via:
twine/6.2.0 CPython/3.9.25
File hashes
| Algorithm | Hash digest | |
|---|---|---|
| SHA256 |
1da94825671267b0afe82b7a42667bf282a353f32fa7bf1d28c33c5e81334502
|
|
| MD5 |
11bb925f22009ae14671308056fbd5de
|
|
| BLAKE2b-256 |
17d5caccb91c15f44f55e980aa2431f51d6d3a79ecc89b7f007196070efc7a71
|














