
plotilleresample
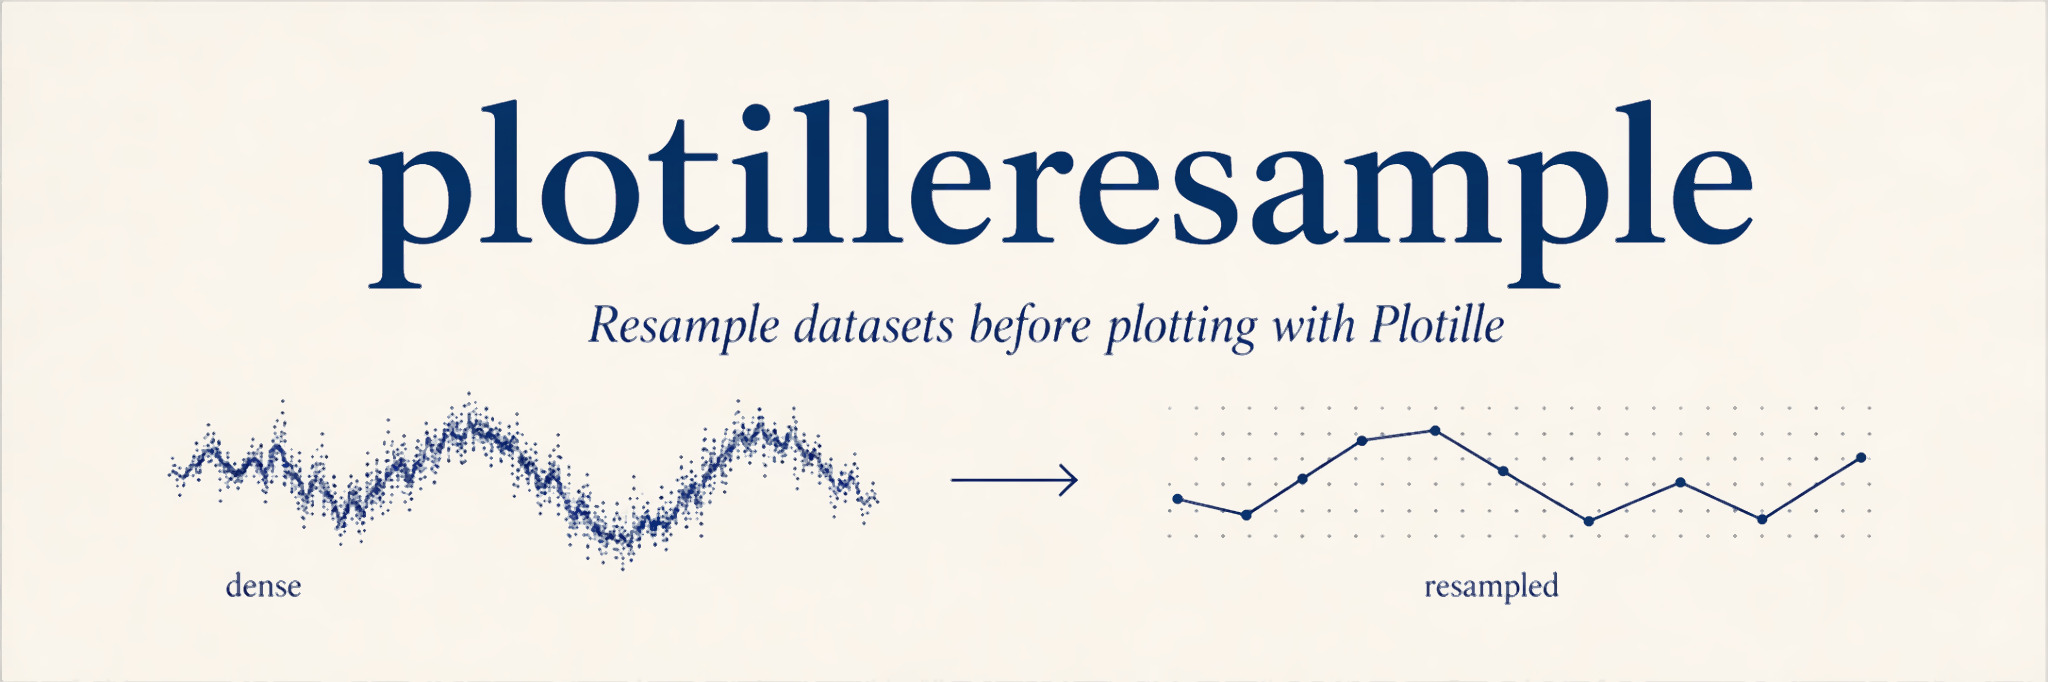
Python module to resample datasets before plotting with Plotille.




Why resample?
Plotille rasterizes to a terminal canvas of braille dots: width * 2 columns by height * 4 rows. Feeding it far more points than that costs interpolation time on detail the canvas cannot show. Plotille rasterizes; plotilleresample decides what information deserves to reach the rasterizer:
| Function | Strategy | Best for |
|---|---|---|
resample_plot |
uniform stride | smooth lines, cheapest reduction |
resample_plot_minmax |
min/max per bucket | peaks, oscillations, time series |
resample_plot_lttb |
largest triangle per bucket | shape-faithful single line |
resample_plot_minmax_lttb |
minmax preselection + LTTB | shape-faithful line, large inputs |
resample_scatter |
uniform stride | large scatter inputs |
resample_scatter_minmax |
stride + min/max per bucket | scatter inputs with outliers |
The uniform stride keeps one point every N: fast and predictable, but a narrow peak that falls between two kept points disappears from the plot. resample_plot_minmax instead makes one bucket per braille dot column and keeps the minimum and the maximum Y of each bucket, so the envelope of the signal, spikes included, always survives:
X = list(range(10000))
Y = [0.0] * 10000
Y[33] = 1000.0  # a narrow spike

_, y_stride = plotilleresample.resample_plot(X, Y)
_, y_minmax = plotilleresample.resample_plot_minmax(X, Y)

1000.0 in y_stride  # False: the spike vanished
1000.0 in y_minmax  # True: the envelope survives
resample_plot_lttb implements Largest-Triangle-Three-Buckets (Steinarsson, 2013): it always keeps the first and the last point and picks the most shape-representative point of each bucket, giving a single clean line that looks like the original. It keeps one point per bucket, so (unlike min/max) one of two opposing extremes falling in the same bucket can be dropped: shape fidelity instead of envelope guarantee.
resample_plot_minmax_lttb is the hybrid (MinMaxLTTB, Van der Donckt et al., 2023; the plotly-resampler default): on large inputs a minmax pass preselects the per bucket extremes and LTTB runs over those candidates only. Visually close to pure LTTB and faster, with a gap that grows with input size (about 1.6x end to end at 100,000 points, and about 3.4x on the resampling pass alone at 1,000,000), and the true extremes are always among the candidates.
All four plot resamplers work in sample order: they bucket by index, so X is expected to be already sorted, as in a time series (resample_scatter makes no ordering assumption). X may hold numbers or dates: the min/max and stride resamplers only index it, and the LTTB ones measure their triangles on the spacing between its values. They keep at most width * 4 points and resample_scatter keeps at most width * 2 * height, so plotille only receives what the canvas can actually display. resample_scatter_minmax adds the minimum and the maximum of every bucket, and the last point, to that stride: an isolated outlier survives and the axes keep their true range, for at most width * 4 + 1 points more.
Benchmark
End to end times: building the plot string with plotille alone versus resampling first. Measured with benchmarks/bench.py (canvas 80x40, best of 3) on Python 3.14, Linux, Intel Core i5-1135G7:
| Points | plotille alone | stride + plotille | minmax + plotille | lttb + plotille | mmlttb + plotille |
|---|---|---|---|---|---|
| 10,000 | 202 ms | 23 ms | 22 ms | 27 ms | 24 ms |
| 100,000 | 1.75 s | 39 ms | 52 ms | 90 ms | 56 ms |
Reproduce it from the repository root with:
uv run --group bench benchmarks/bench.py
The resampling-pass figure quoted in Why resample? (pure LTTB vs MinMaxLTTB at 1,000,000 points) has its own script:
uv run benchmarks/bench_resamplers.py
Installation
Install with UV:
uv add plotilleresample
Install with pip:
pip install plotilleresample
plotilleresample has no runtime dependencies, not even plotille: it only reduces sequences. To run the example below, install plotille as well (uv add plotille or pip install plotille).
Usage
import math

import plotille

from plotilleresample import resample_plot_minmax_lttb

r = 100_000
X = list(range(r))
Y = [math.sin(i / 500) * 100 for i in range(r)]

X, Y = resample_plot_minmax_lttb(X, Y, width=80, height=40)
print(plotille.plot(X, Y, width=80, height=40))
The full interactive demo, running every resampler on the same dataset, lives in examples/demo.py.
Acknowledgements
plotilleresample has a narrow purpose, giving Tammo Ippen's plotille only the points its terminal canvas can actually show. plotille now points back to this project from its own README. The min/max strategy came out of the discussion in plotille#22, opened in 2019.
1 maintainer

Metadata
1 maintainer
Release files for plotilleresample 1.2.0
For a detailed explanation of source distributions (sdists) and built distributions (wheels), please see the package formats documentation.
Source distribution (sdist)
| File | Size | Uploaded | |
|---|---|---|---|
| plotilleresample-1.2.0.tar.gz | 9.9 kB | Details |
Built distribution (wheel)
| File | Interpreter | ABI | Platform | Reset |
|---|---|---|---|---|
| plotilleresample-1.2.0-py3-none-any.whl | Python 3 | none | any | Details |
Total release size: 17.6 kB
Release files / plotilleresample-1.2.0.tar.gz
| Download URL | plotilleresample-1.2.0.tar.gz |
|---|---|
| Size | 9.9 kB |
| Tags | Source |
|
SHA-256 checksum How to use checksums |
986e71381ea51907299829ec94f43b01f752bd35ce6ad2ff52cab8e18adc3fae
|
|
BLAKE2b-256 checksum How to use checksums |
12080000b45c1753adf2ddec252847297de9d0dc0582aee6c4a3789df48c2f4b
|
| Upload date | |
|
Uploaded using Trusted Publishing? What is trusted publishing? |
Yes |
| Uploaded via |
uv/0.12.13 {"installer":{"name":"uv","version":"0.12.13","subcommand":["publish"]},"python":null,"implementation":{"name":null,"version":null},"distro":{"name":"Ubuntu","version":"24.04","id":"noble","libc":null},"system":{"name":null,"release":null},"cpu":null,"openssl_version":null,"setuptools_version":null,"rustc_version":null,"ci":true}
|
Provenance
Provenance describes where a file came from. On PyPI, provenance is shared via attestations, which provide a verifiable record of the build or publishing details. View details, limitations and caveats.


PyPI Publish Attestation
PyPI verified that this artifact, at this checksum, originated from the publisher listed below.
Signed by GitHub Actions, verified by PyPI on Sep 15, 2026.
Transparency logRelease files / plotilleresample-1.2.0-py3-none-any.whl
| Download URL | plotilleresample-1.2.0-py3-none-any.whl |
|---|---|
| Size | 7.7 kB |
| Tags | Python 3 |
|
SHA-256 checksum How to use checksums |
721ffedf2b1a44dd1586647eea21347e18128a085e954fac9b533366bfdb0a3c
|
|
BLAKE2b-256 checksum How to use checksums |
87bbd96a0f7a83f5e081f37af933c19e996f38c7f1f0eaf4c49ece10bf4455e6
|
| Upload date | |
|
Uploaded using Trusted Publishing? What is trusted publishing? |
Yes |
| Uploaded via |
uv/0.12.13 {"installer":{"name":"uv","version":"0.12.13","subcommand":["publish"]},"python":null,"implementation":{"name":null,"version":null},"distro":{"name":"Ubuntu","version":"24.04","id":"noble","libc":null},"system":{"name":null,"release":null},"cpu":null,"openssl_version":null,"setuptools_version":null,"rustc_version":null,"ci":true}
|
Provenance
Provenance describes where a file came from. On PyPI, provenance is shared via attestations, which provide a verifiable record of the build or publishing details. View details, limitations and caveats.
PyPI Publish Attestation
PyPI verified that this artifact, at this checksum, originated from the publisher listed below.
Signed by GitHub Actions, verified by PyPI on Sep 15, 2026.
Transparency log













