
plotly-print


Export Plotly figures to SVG, PNG, JPEG, or WebP without launching Chrome.
plotly-print runs a bundled Plotly.js 2D build in QuickJS, then uses resvg-py for raster output. It works offline, has no browser process to install or manage, and can replace Plotly's image-export methods with one call.
- Browser-free: no Chrome, Chromium, or Playwright.
- Fast: avoids browser startup; see the measured benchmarks.
- Familiar: use the direct API or patch Plotly's existing
to_imageandwrite_imagemethods.
Install | Direct API | Plotly integration | Benchmarks
Installation
pip install plotly-print
Requires Python 3.12 or newer.
Direct API
import plotly.express as px
import plotly_print

fig = px.scatter(x=[1, 2, 3, 4], y=[10, 11, 12, 13], title='Sales Growth')

svg = plotly_print.to_svg(fig)
png = plotly_print.to_image(fig, format='png', scale=2)
plotly_print.write_image(fig, 'chart.png')
to_image returns bytes. write_image writes to a path or binary file object. Supported formats are SVG, PNG, JPEG, and WebP.
Plotly integration
Patch Plotly's existing image-export methods:
import plotly_print

plotly_print.register()
After registration, existing calls such as fig.write_image("chart.png") use plotly-print. Call plotly_print.unregister() to restore Plotly's original methods.
plotly-print targets 2D static charts. The bundled Plotly.js build and its licenses are documented in THIRD_PARTY_NOTICES.md.
Benchmarks
On this run, plotly-print exported all 29 chart types 11x to 33x faster than Kaleido.
These are mean per-image PNG export times after both engines were warmed up. Timings are machine-specific; use the side-by-side images below to evaluate rendering differences.
See the raw results or run the benchmark locally.
| Category | Chart Type | plotly-print | Kaleido | Speedup |
|---|---|---|---|---|
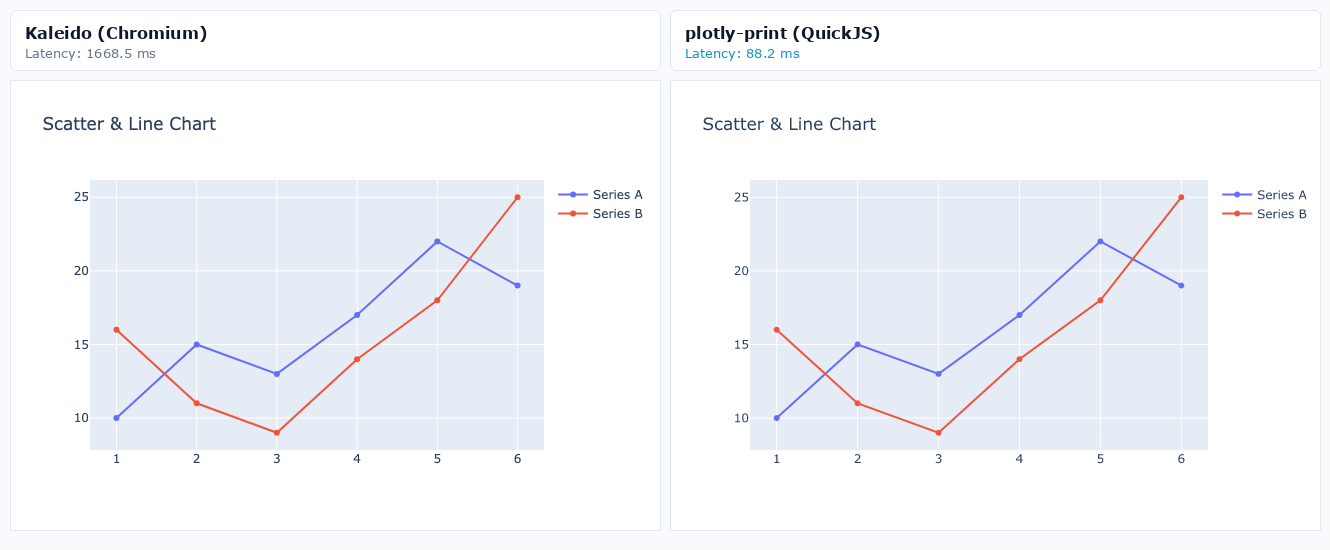
| Core Cartesian | Scatter & Line Chart | 88.9 ms | 1524.7 ms | 17.1x |
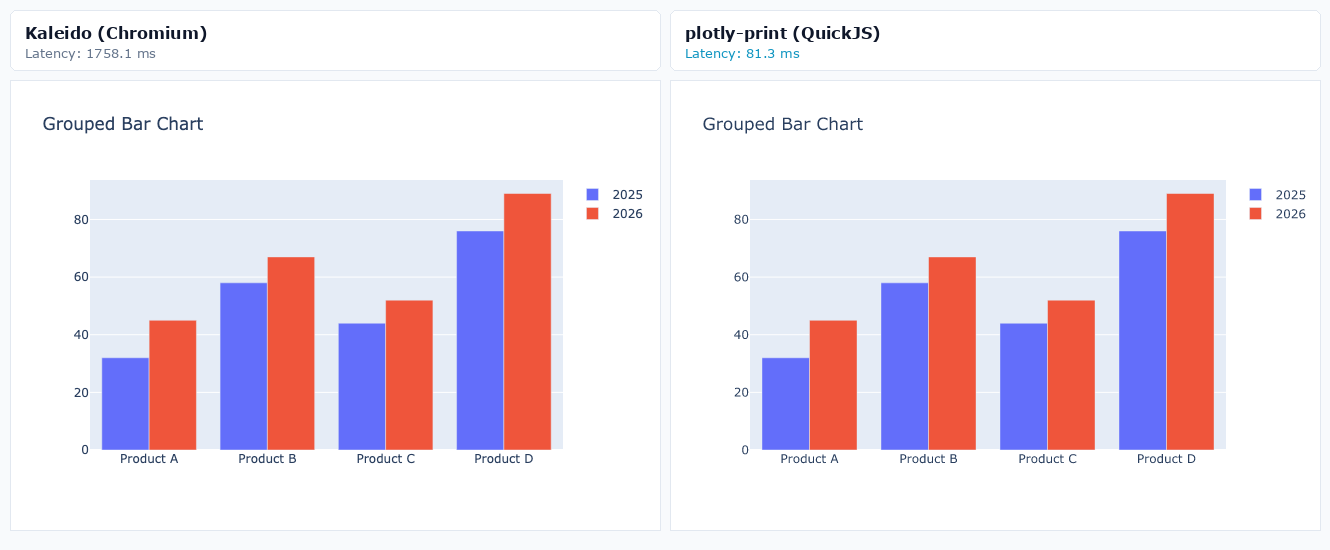
| Core Cartesian | Grouped Bar Chart | 93.5 ms | 1642.3 ms | 17.6x |
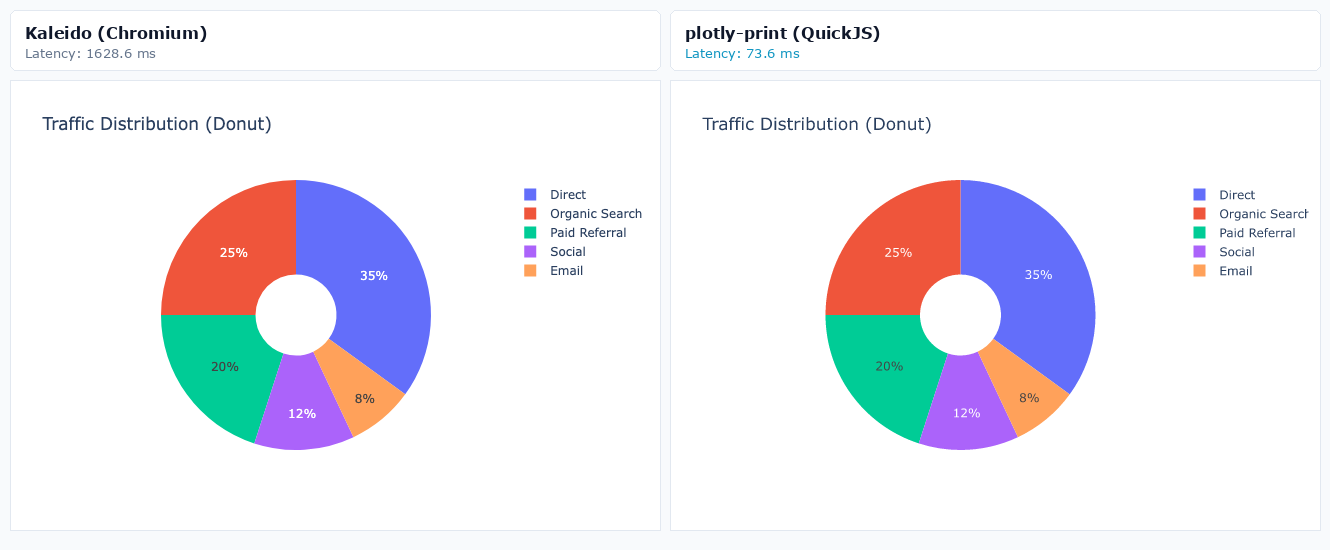
| Core Cartesian | Donut / Pie Chart | 74.4 ms | 1812.6 ms | 24.4x |
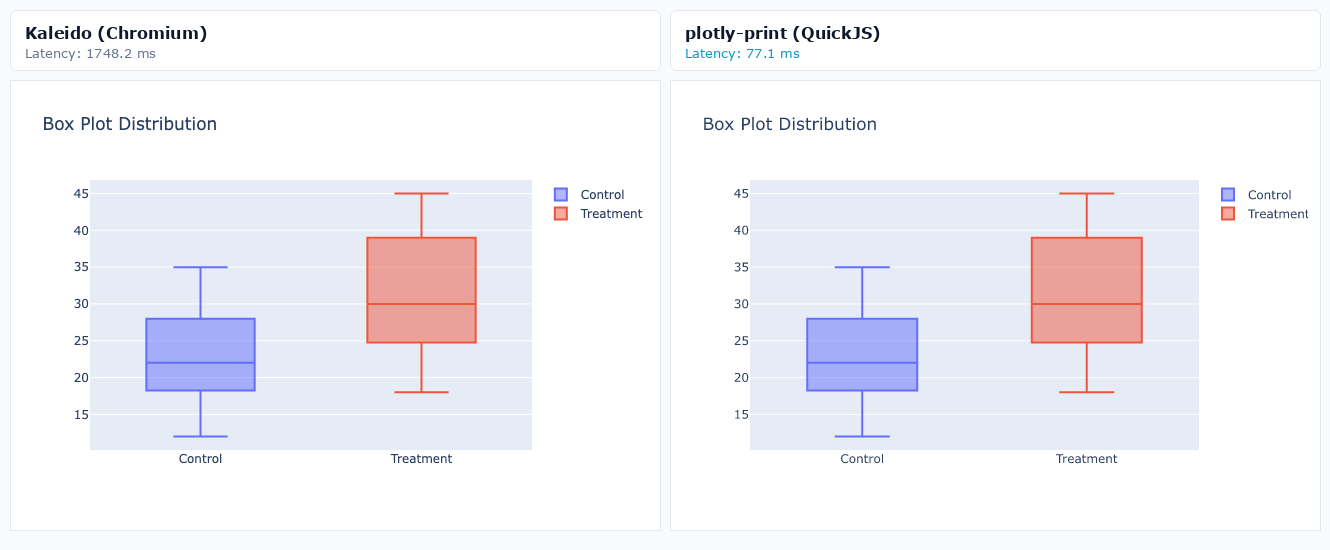
| Core Cartesian | Box Plot | 93.5 ms | 1714.4 ms | 18.3x |
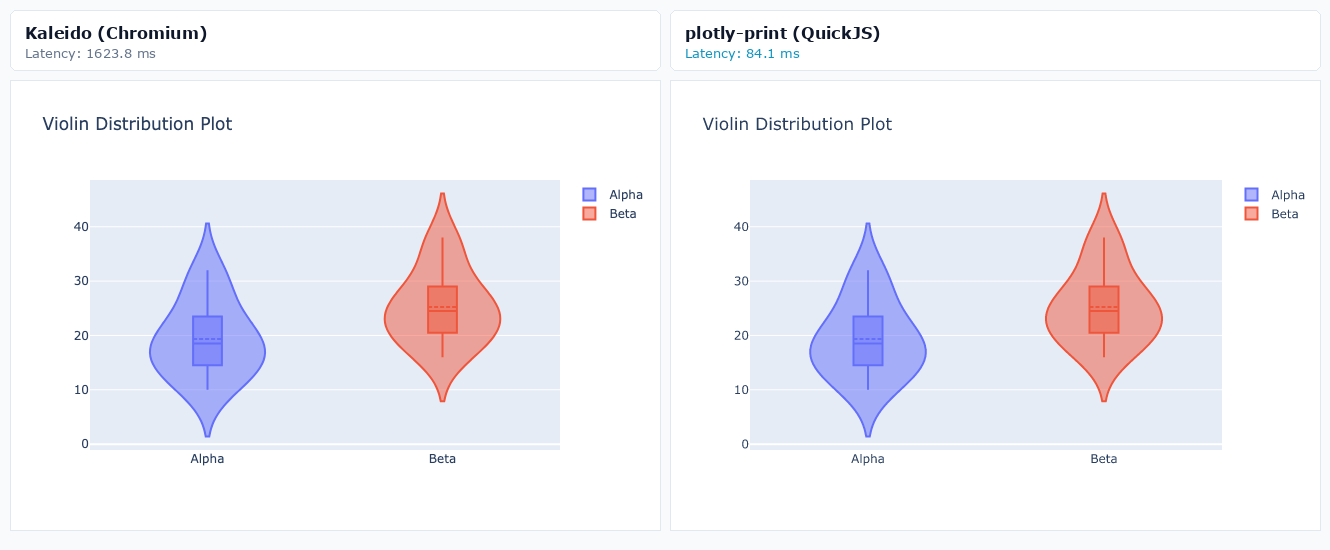
| Core Cartesian | Violin Plot | 86.5 ms | 1626.1 ms | 18.8x |
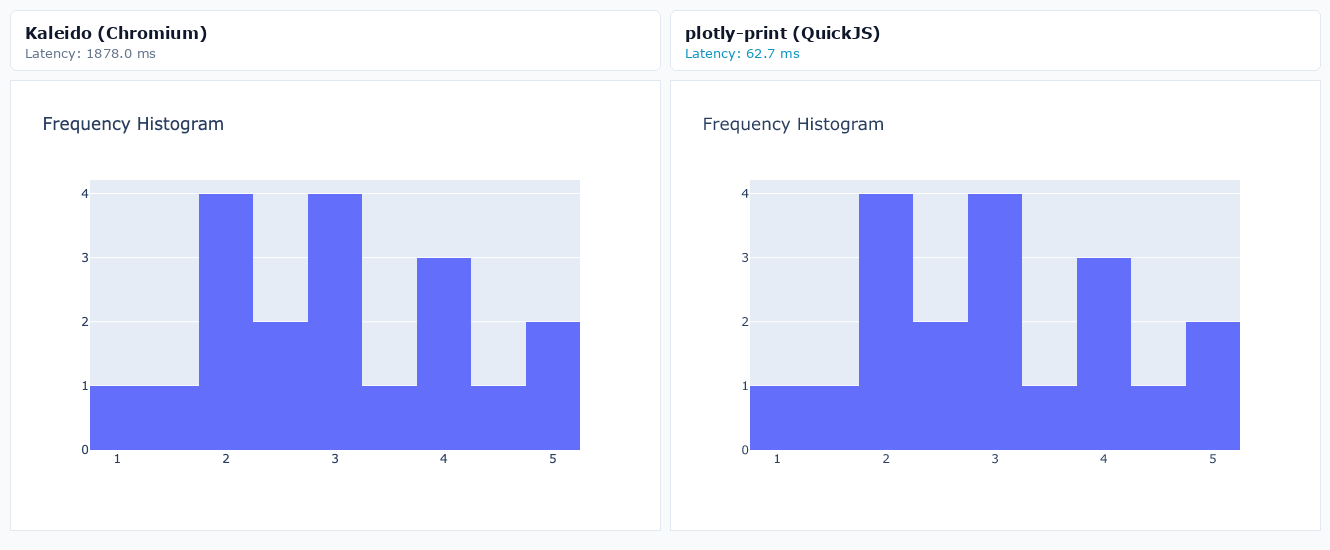
| Core Cartesian | Frequency Histogram | 105.5 ms | 1556.6 ms | 14.8x |
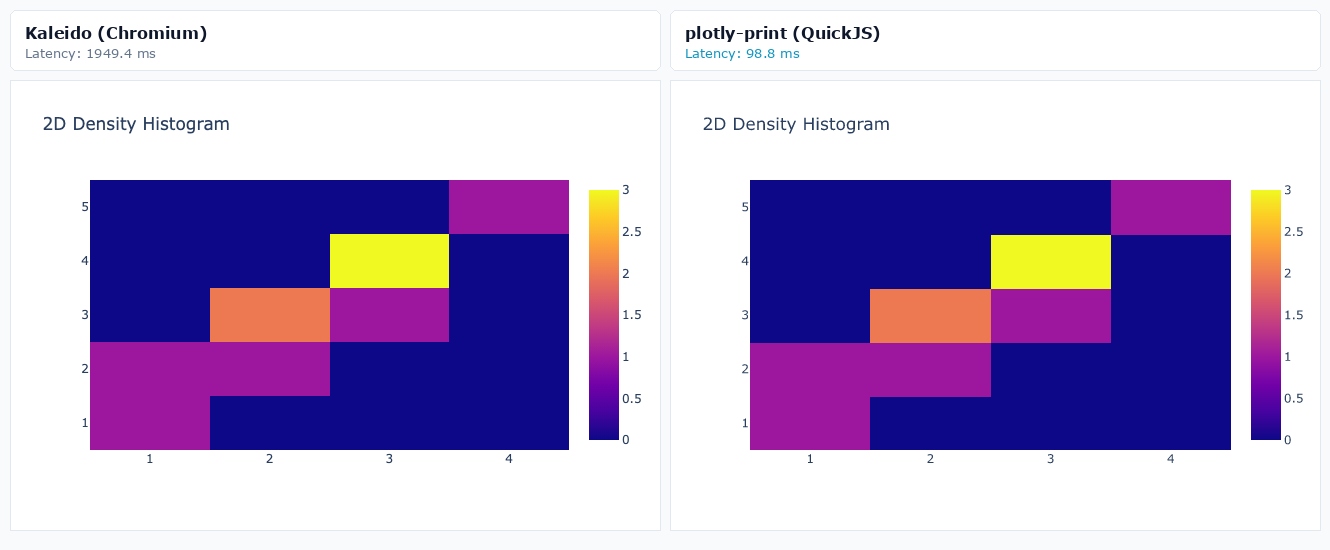
| Core Cartesian | 2D Density Histogram | 105.5 ms | 1696.5 ms | 16.1x |
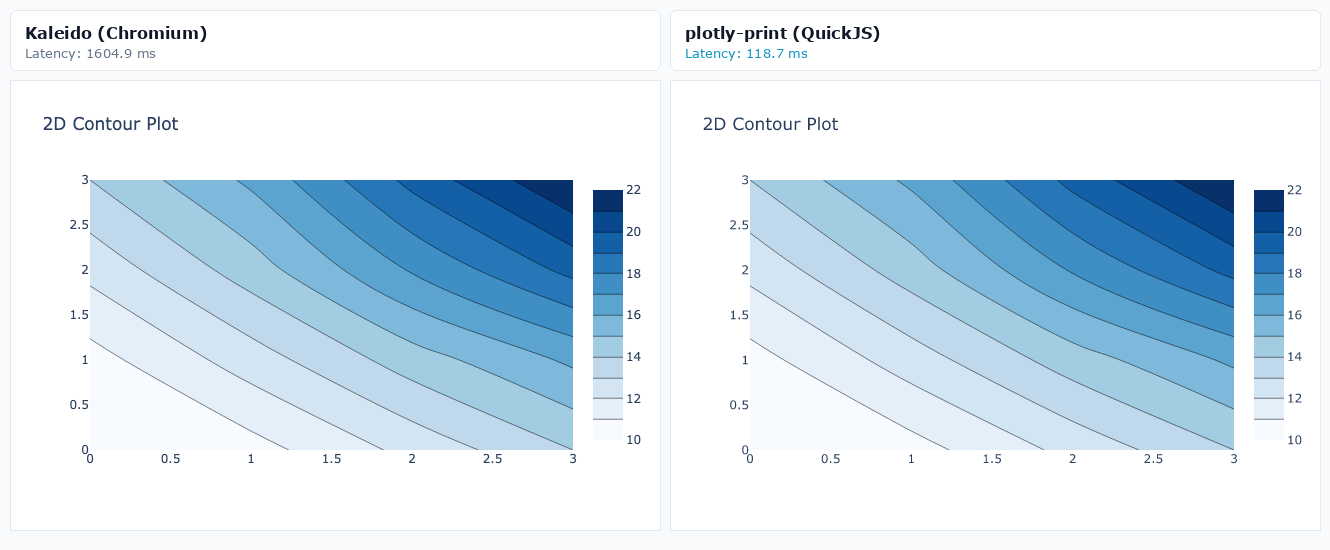
| Core Cartesian | 2D Contour Plot | 135.8 ms | 1744.5 ms | 12.8x |
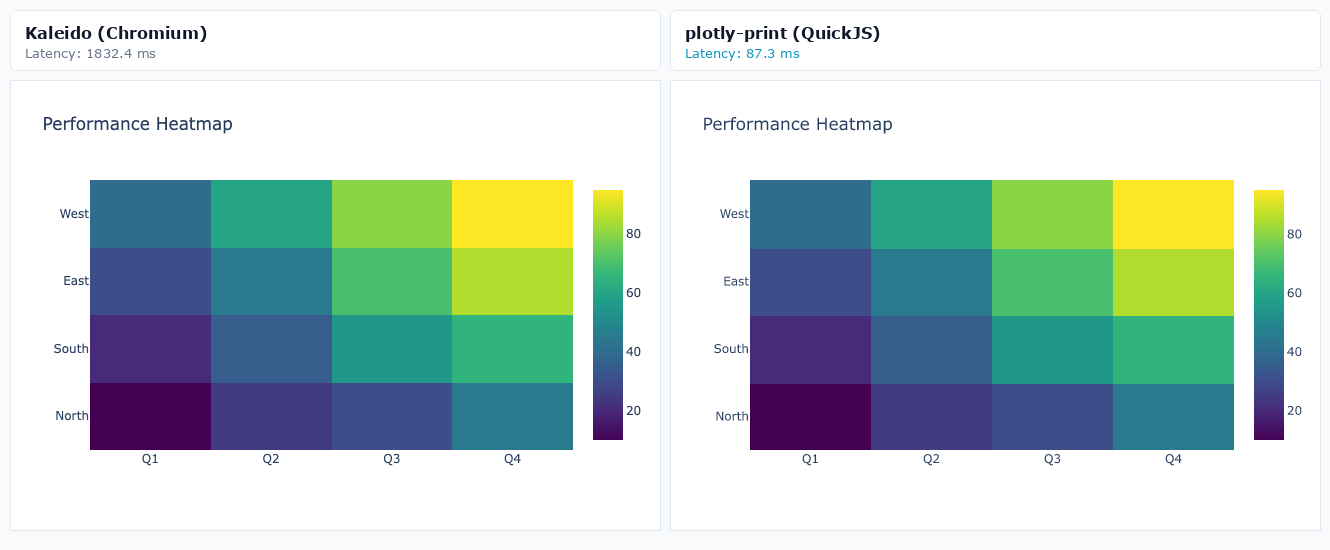
| Core Cartesian | Performance Heatmap | 95.4 ms | 1647.1 ms | 17.3x |
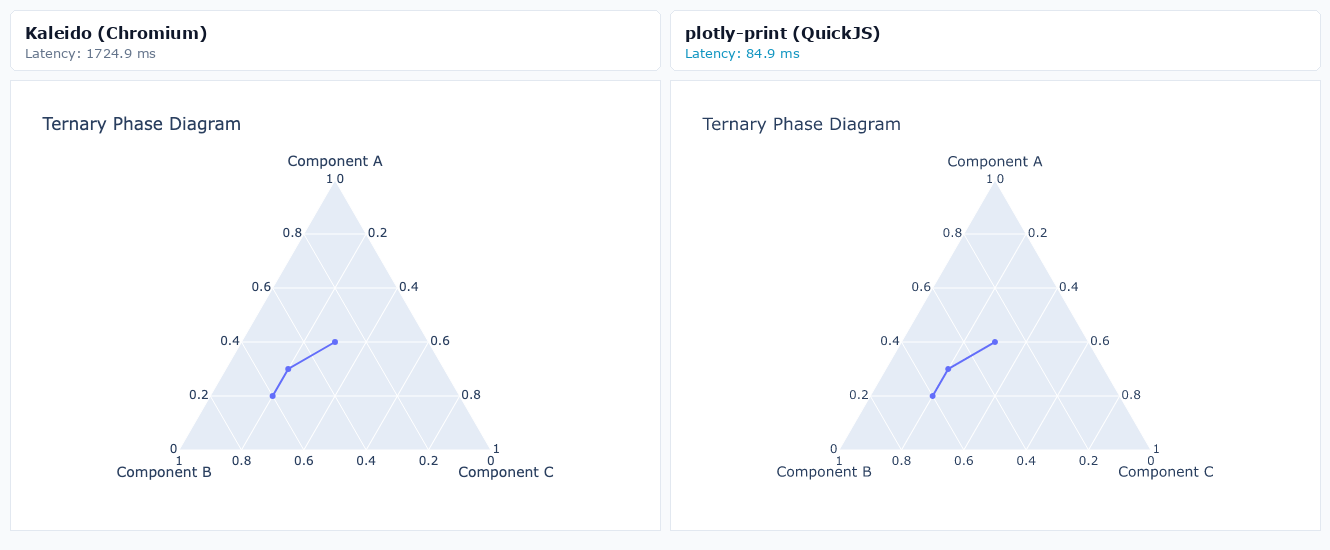
| Core Cartesian | Ternary Phase Diagram | 95.8 ms | 1639.1 ms | 17.1x |
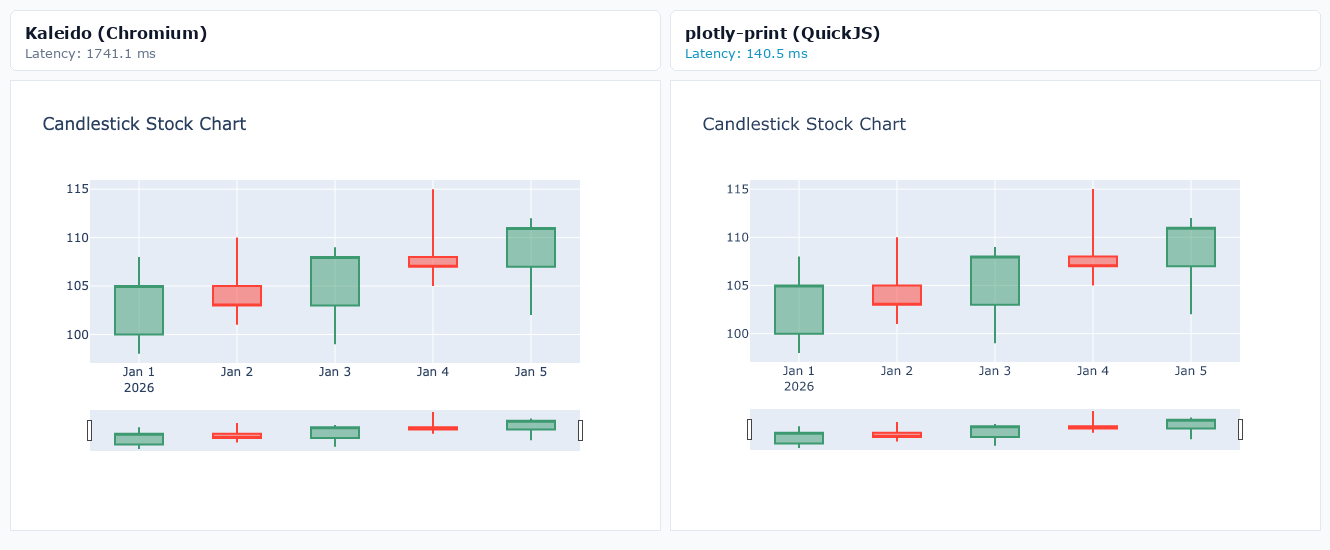
| Financial & Business | Candlestick Stock Chart | 125.6 ms | 1618.5 ms | 12.9x |
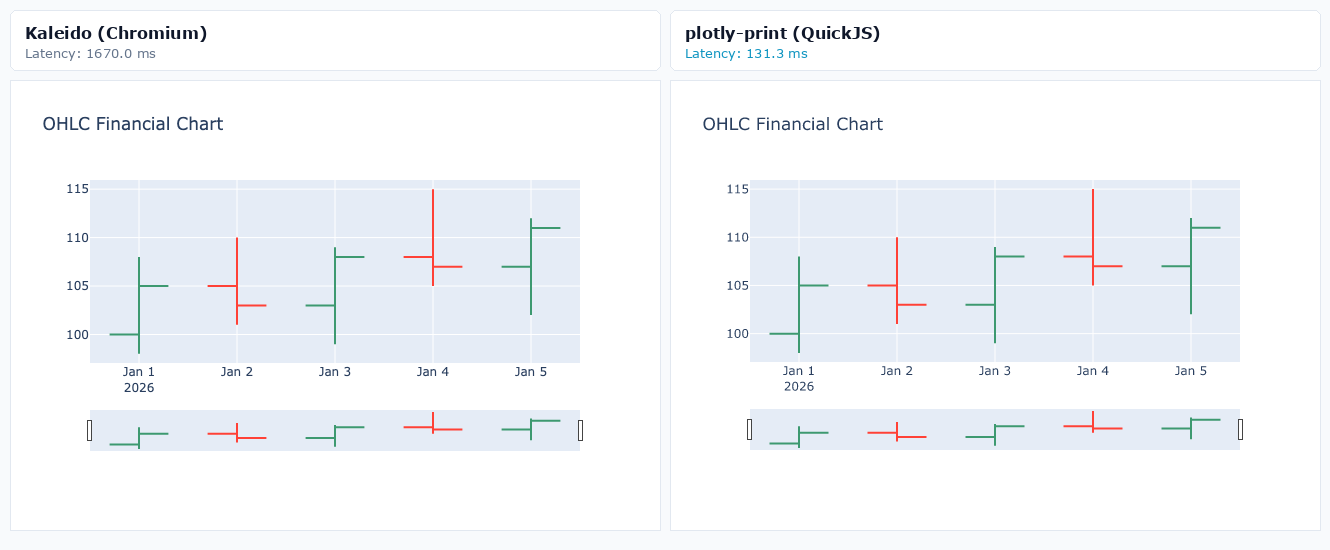
| Financial & Business | OHLC Financial Chart | 159.2 ms | 1686.0 ms | 10.6x |
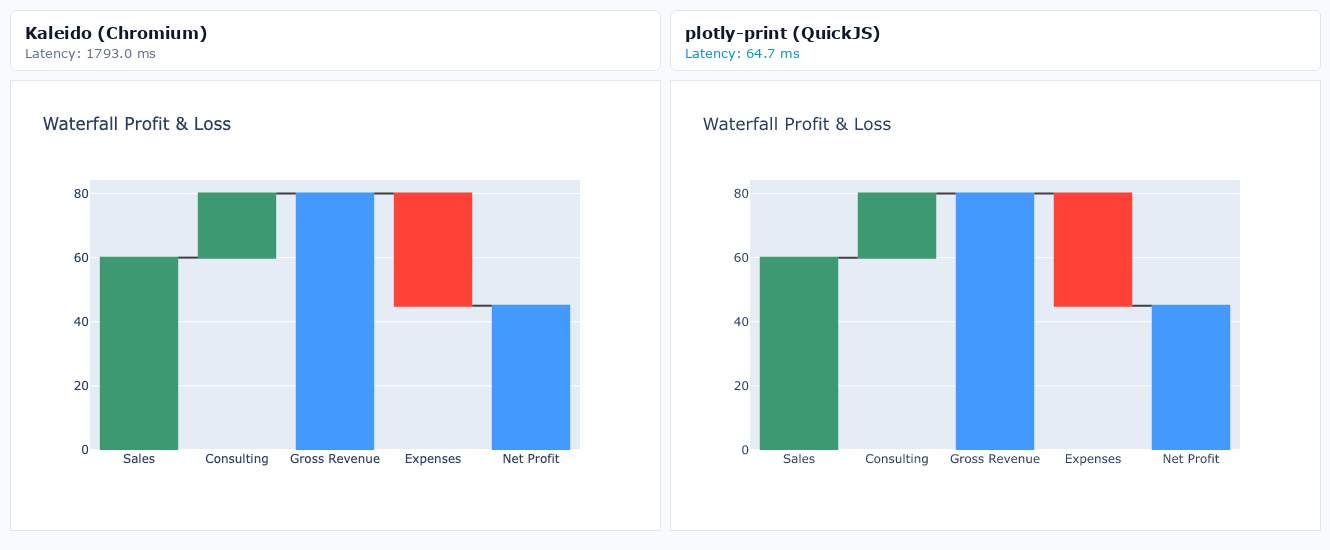
| Financial & Business | Waterfall Profit & Loss | 67.1 ms | 1561.6 ms | 23.3x |
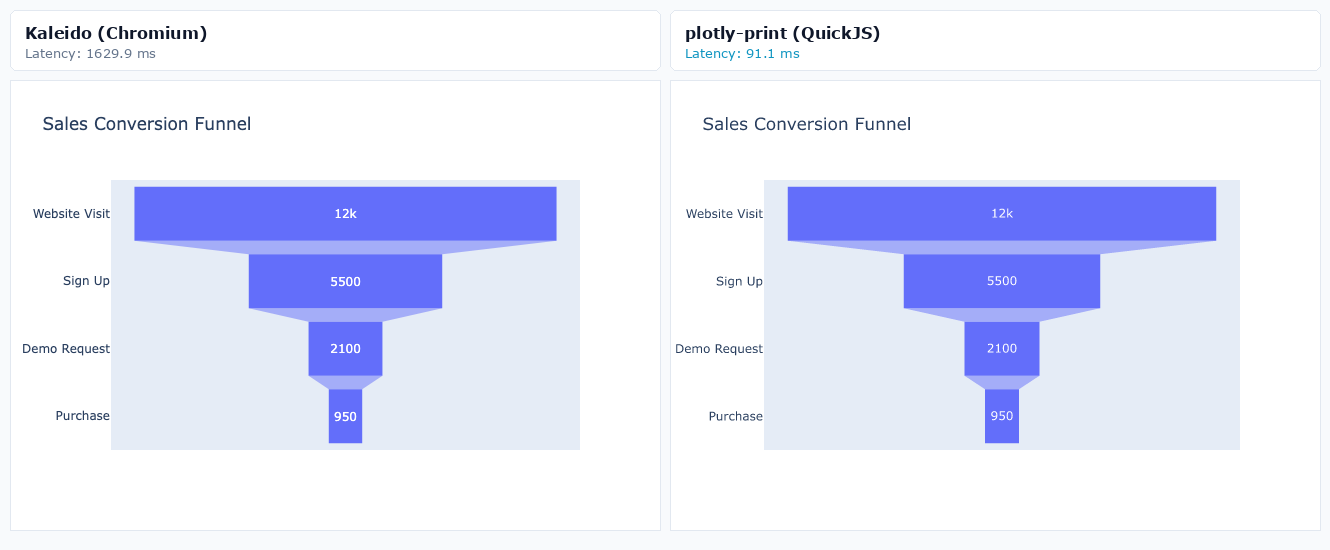
| Financial & Business | Sales Conversion Funnel | 102.3 ms | 1620.2 ms | 15.8x |
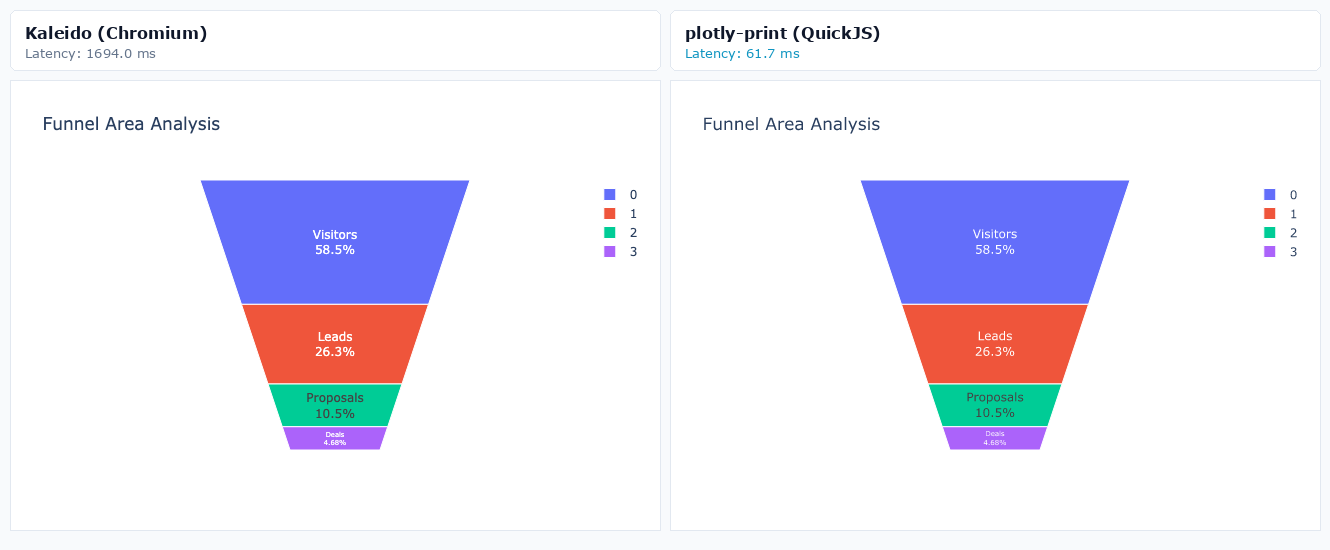
| Financial & Business | Funnel Area Analysis | 59.2 ms | 1593.7 ms | 26.9x |
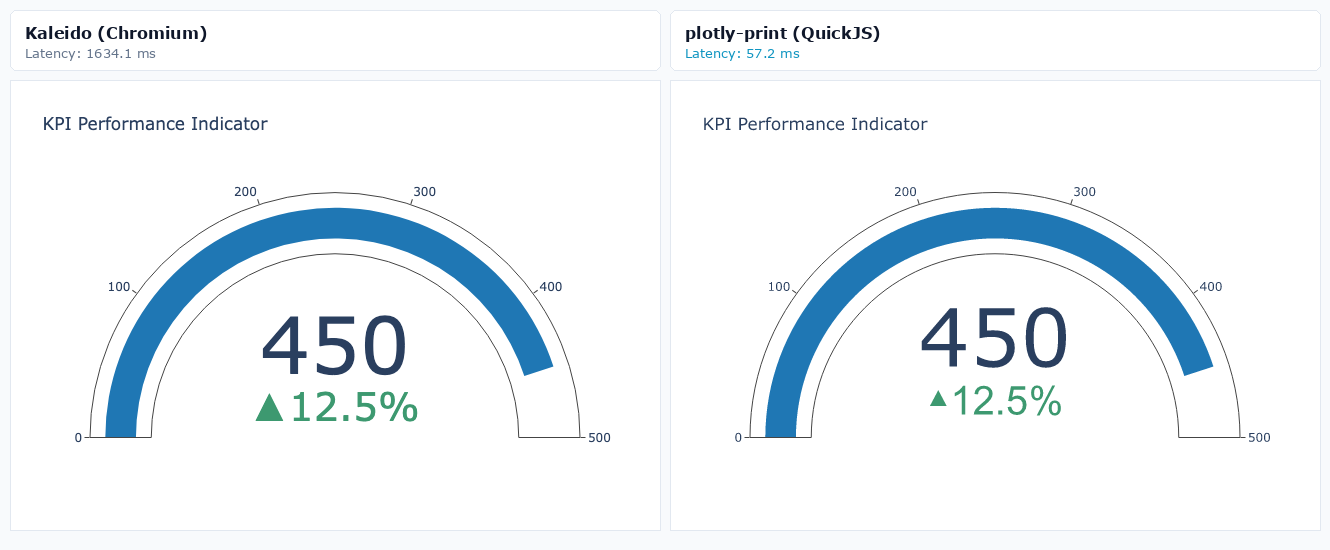
| Financial & Business | KPI Performance Indicator | 69.9 ms | 1607.4 ms | 23.0x |
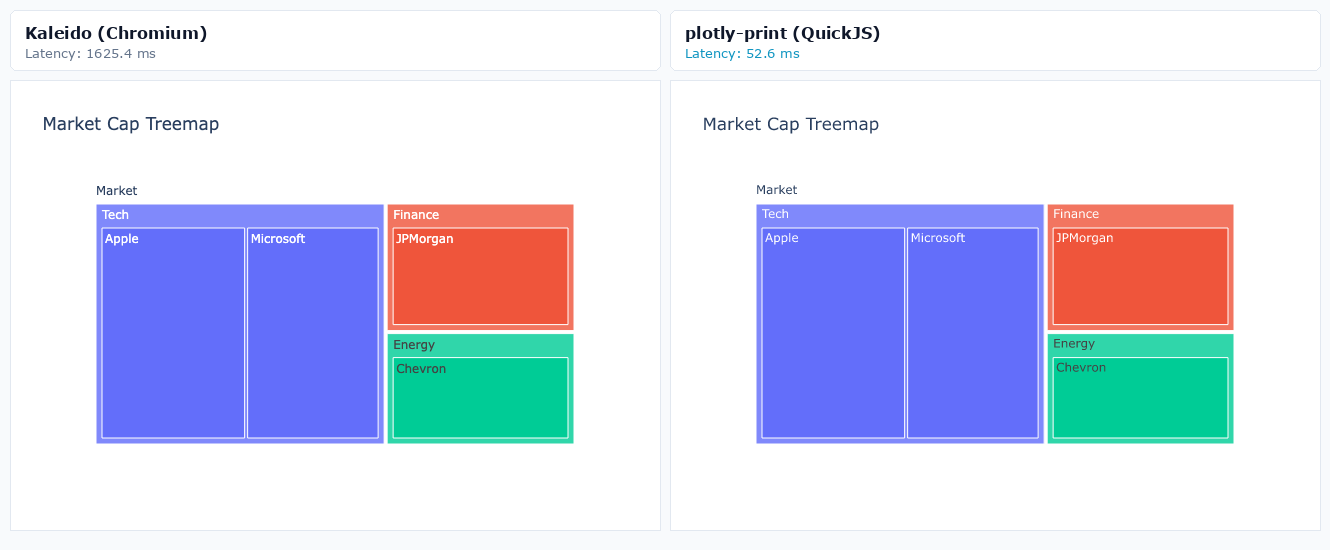
| Hierarchical | Market Cap Treemap | 52.9 ms | 1672.0 ms | 31.6x |
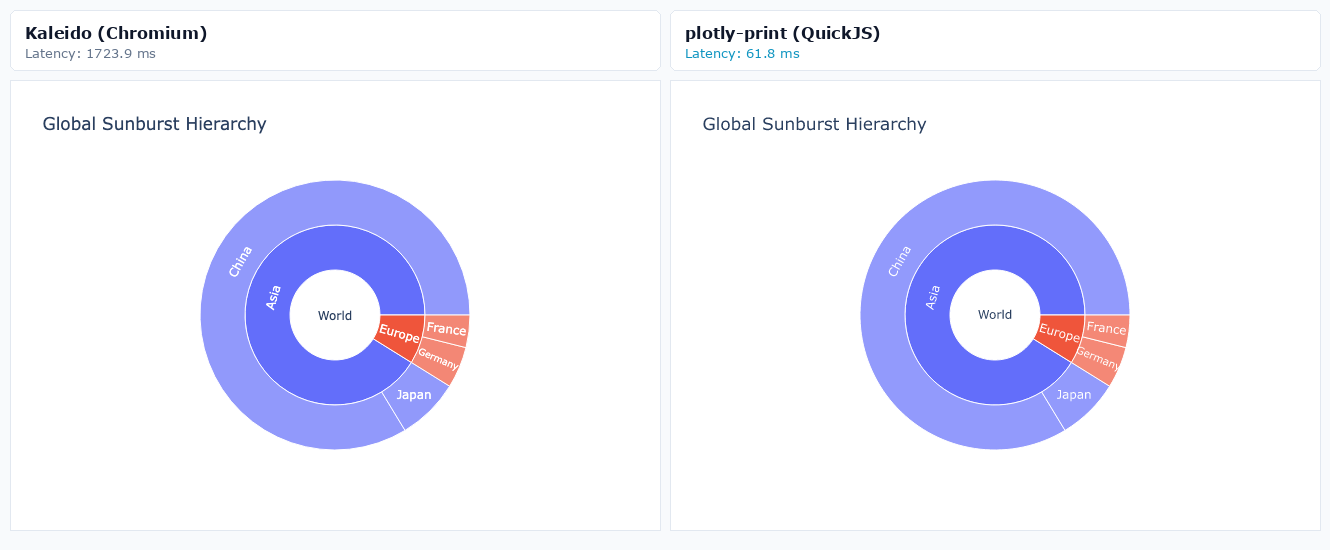
| Hierarchical | Global Sunburst Hierarchy | 69.8 ms | 1665.6 ms | 23.9x |
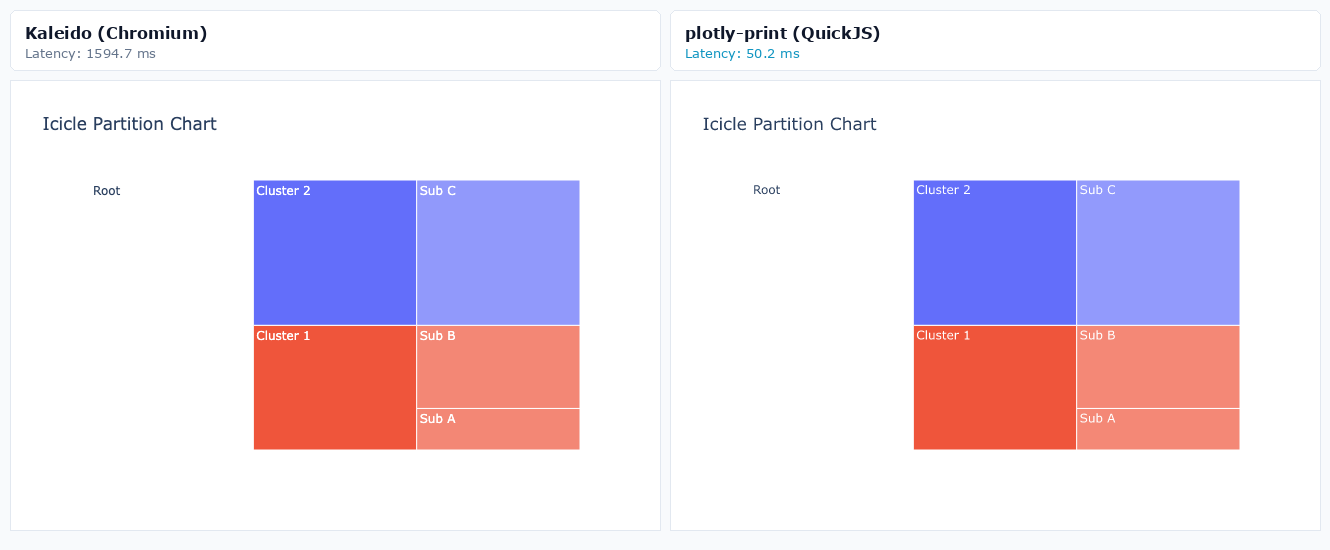
| Hierarchical | Icicle Partition Chart | 59.8 ms | 1662.9 ms | 27.8x |
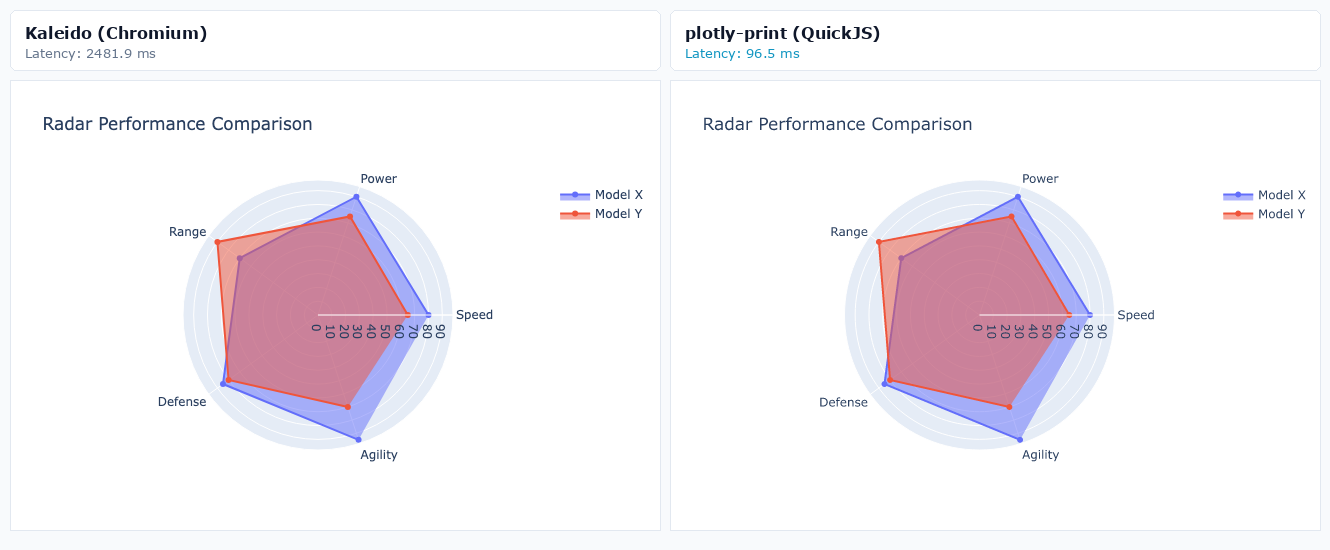
| Radial & Polar | Radar Performance Comparison | 98.2 ms | 1689.3 ms | 17.2x |
| Radial & Polar | Polar Wind Rose | 78.3 ms | 1581.8 ms | 20.2x |
| Specialized Diagrams | Energy Flow Sankey Diagram | 47.6 ms | 1593.5 ms | 33.5x |
| Specialized Diagrams | Parallel Categories Diagram | 68.7 ms | 1551.1 ms | 22.6x |
| Specialized Diagrams | Formatted Data Table | 96.7 ms | 1588.6 ms | 16.4x |
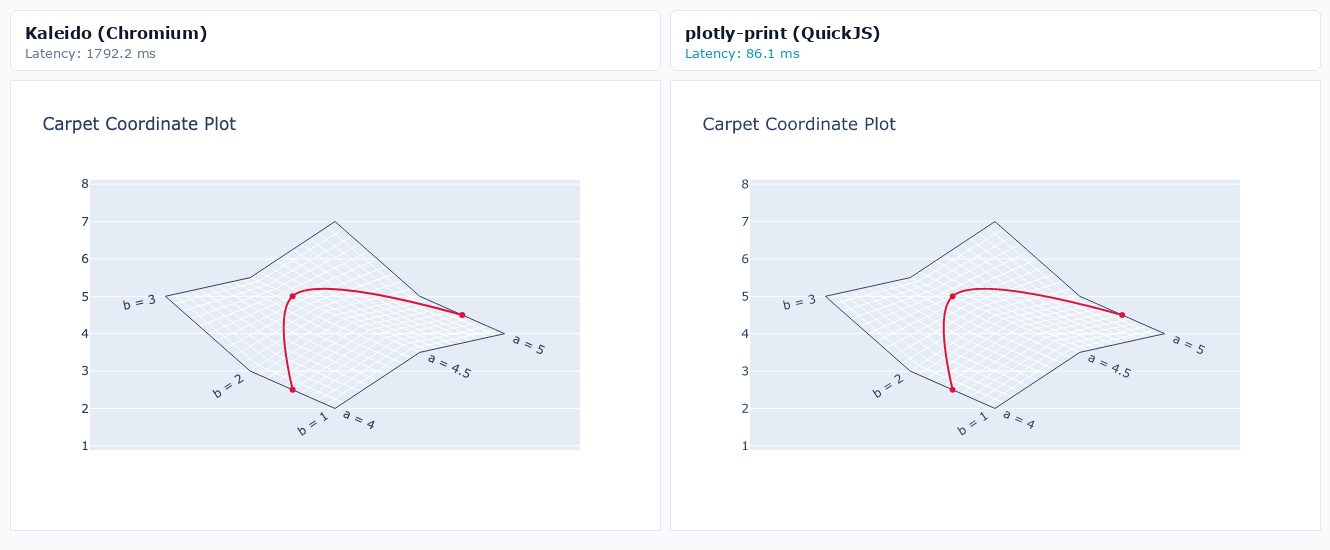
| Specialized Diagrams | Carpet Coordinate Plot | 99.5 ms | 1647.8 ms | 16.6x |
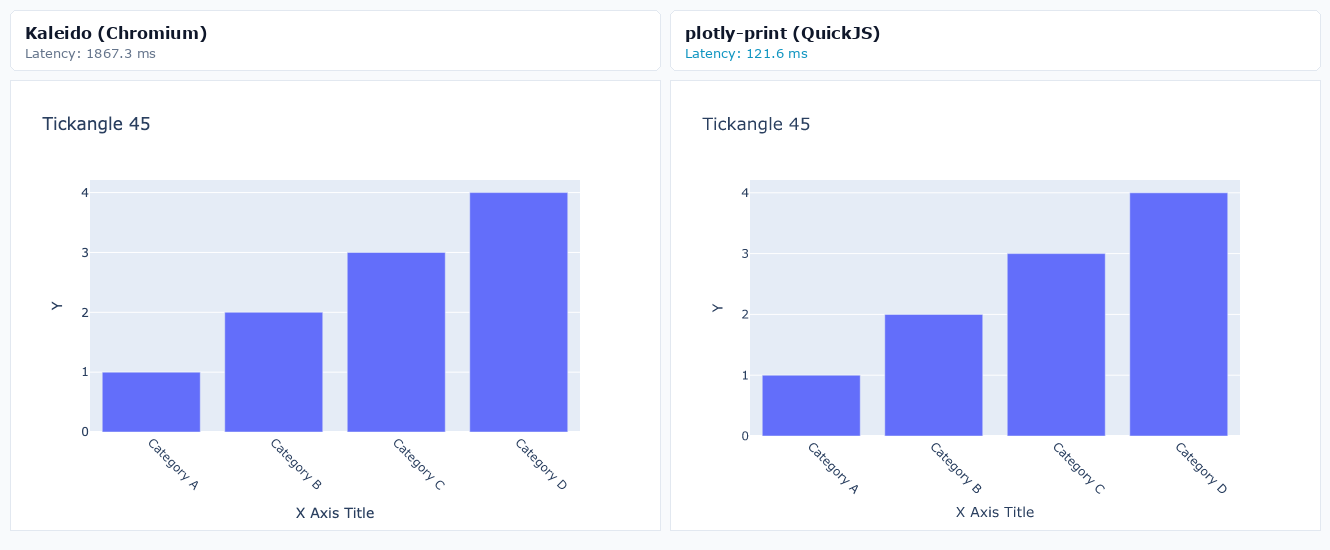
| Layout edge cases | Bar chart with X labels at 45 deg | 92.5 ms | 1741.8 ms | 18.8x |
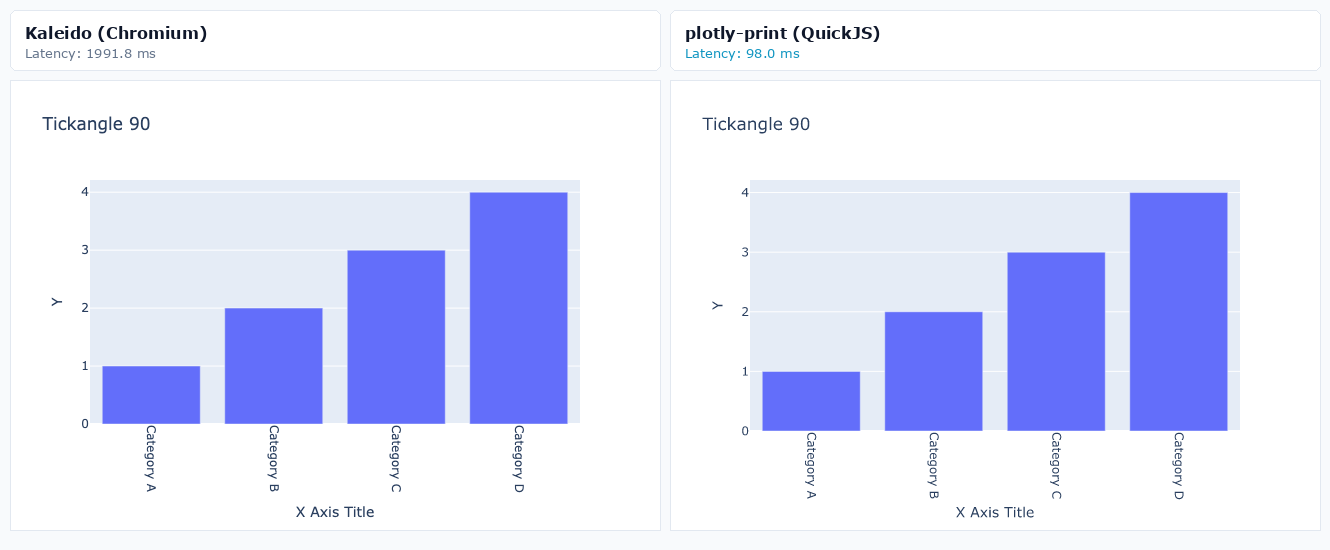
| Layout edge cases | Bar chart with X labels at 90 deg | 101.8 ms | 1609.2 ms | 15.8x |
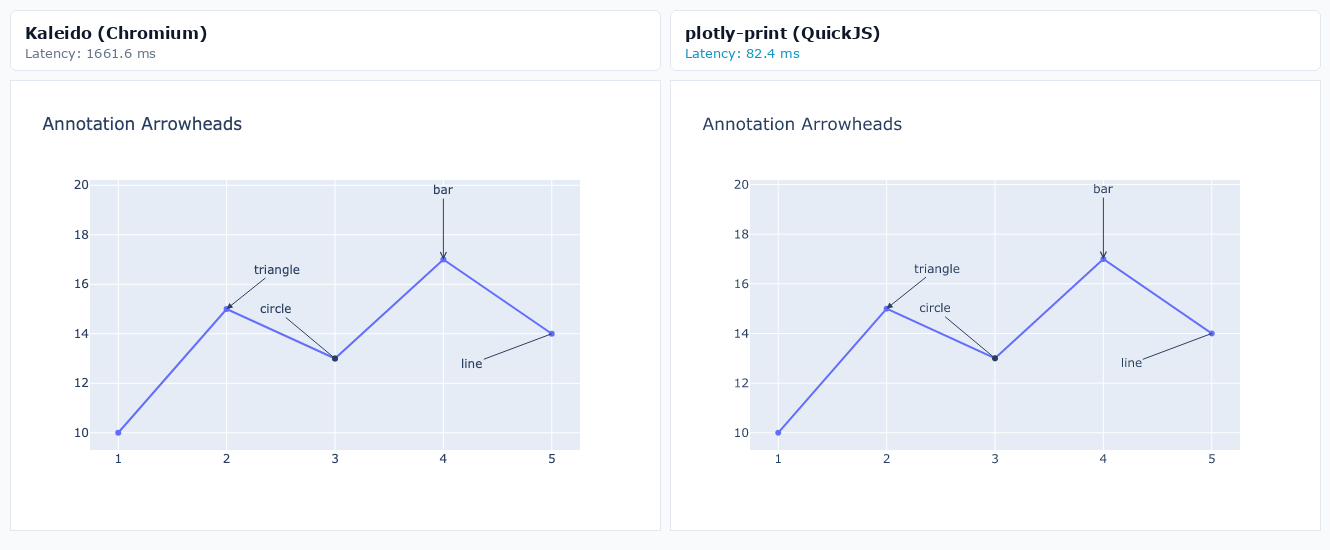
| Layout edge cases | Annotation arrowheads (incl. circle) | 86.5 ms | 1663.2 ms | 19.2x |
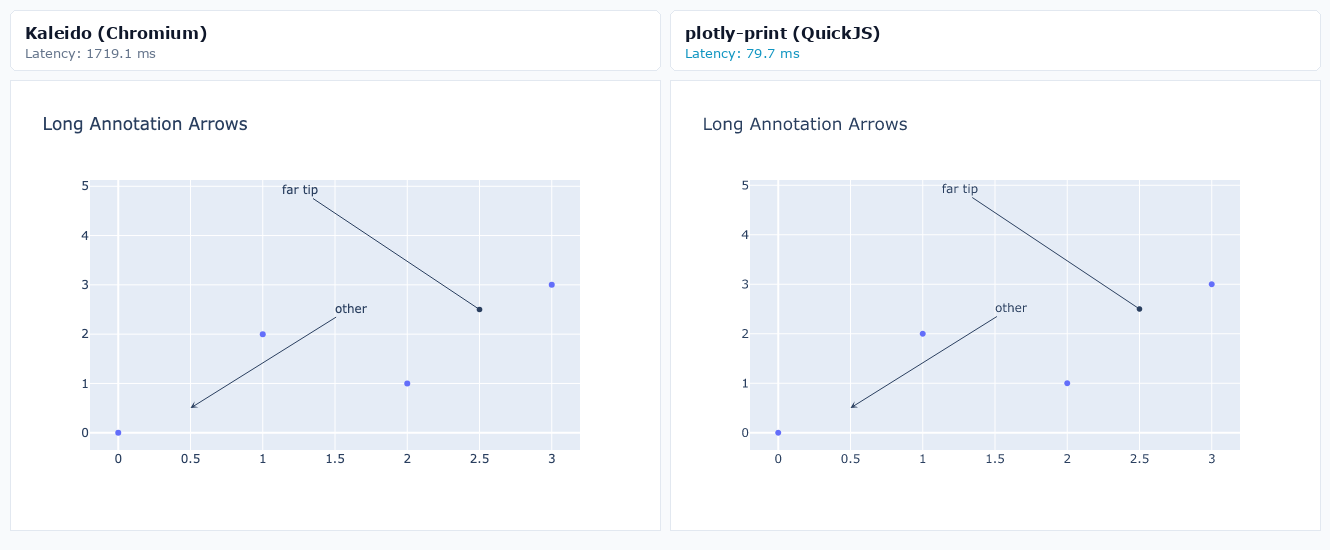
| Layout edge cases | Long annotation arrows (dasharray length) | 93.3 ms | 1650.6 ms | 17.7x |
Visual comparisons
Side-by-side PNGs (Kaleido left, plotly-print right):
Core Cartesian
Scatter & Line Chart (plotly-print: 88.9ms | Kaleido: 1524.7ms)
Grouped Bar Chart (plotly-print: 93.5ms | Kaleido: 1642.3ms)
Donut / Pie Chart (plotly-print: 74.4ms | Kaleido: 1812.6ms)
Box Plot (plotly-print: 93.5ms | Kaleido: 1714.4ms)
Violin Plot (plotly-print: 86.5ms | Kaleido: 1626.1ms)
Frequency Histogram (plotly-print: 105.5ms | Kaleido: 1556.6ms)
2D Density Histogram (plotly-print: 105.5ms | Kaleido: 1696.5ms)
2D Contour Plot (plotly-print: 135.8ms | Kaleido: 1744.5ms)
Performance Heatmap (plotly-print: 95.4ms | Kaleido: 1647.1ms)
Ternary Phase Diagram (plotly-print: 95.8ms | Kaleido: 1639.1ms)
Financial & Business
Candlestick Stock Chart (plotly-print: 125.6ms | Kaleido: 1618.5ms)
OHLC Financial Chart (plotly-print: 159.2ms | Kaleido: 1686.0ms)
Waterfall Profit & Loss (plotly-print: 67.1ms | Kaleido: 1561.6ms)
Sales Conversion Funnel (plotly-print: 102.3ms | Kaleido: 1620.2ms)
Funnel Area Analysis (plotly-print: 59.2ms | Kaleido: 1593.7ms)
KPI Performance Indicator (plotly-print: 69.9ms | Kaleido: 1607.4ms)
Hierarchical
Market Cap Treemap (plotly-print: 52.9ms | Kaleido: 1672.0ms)
Global Sunburst Hierarchy (plotly-print: 69.8ms | Kaleido: 1665.6ms)
Icicle Partition Chart (plotly-print: 59.8ms | Kaleido: 1662.9ms)
Radial & Polar
Radar Performance Comparison (plotly-print: 98.2ms | Kaleido: 1689.3ms)
Polar Wind Rose (plotly-print: 78.3ms | Kaleido: 1581.8ms)
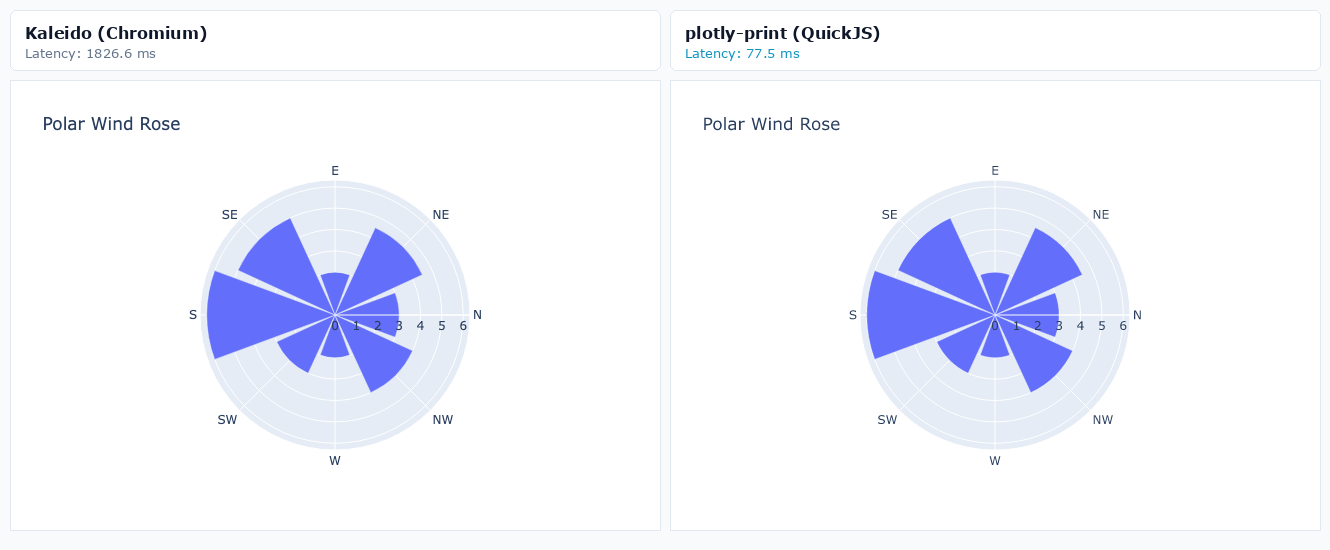
Specialized Diagrams
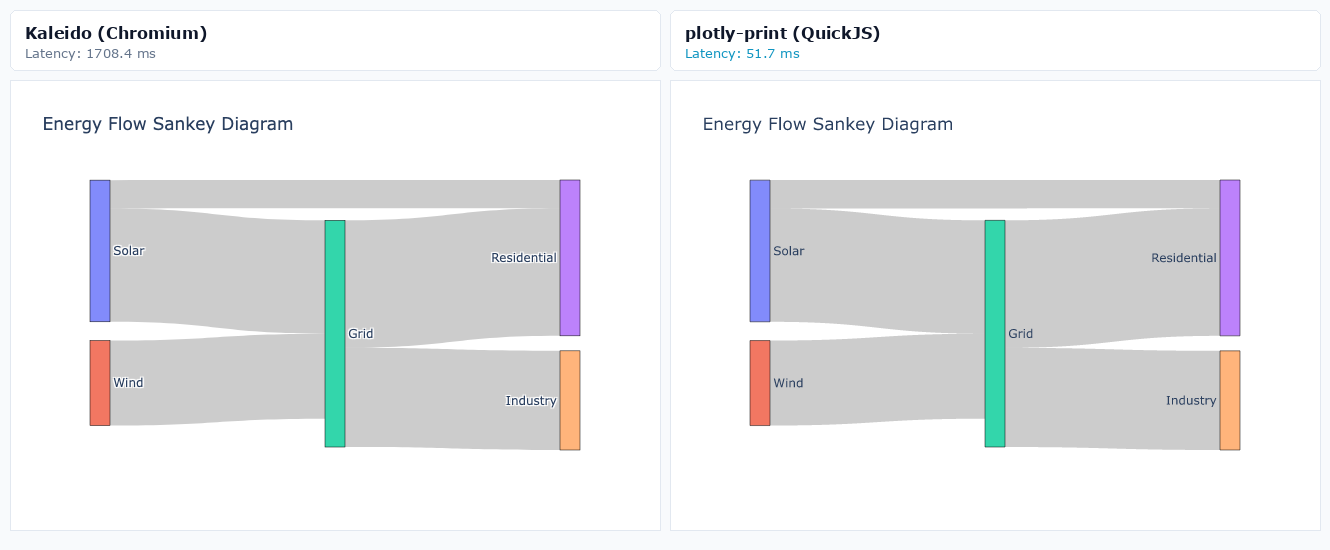
Energy Flow Sankey Diagram (plotly-print: 47.6ms | Kaleido: 1593.5ms)
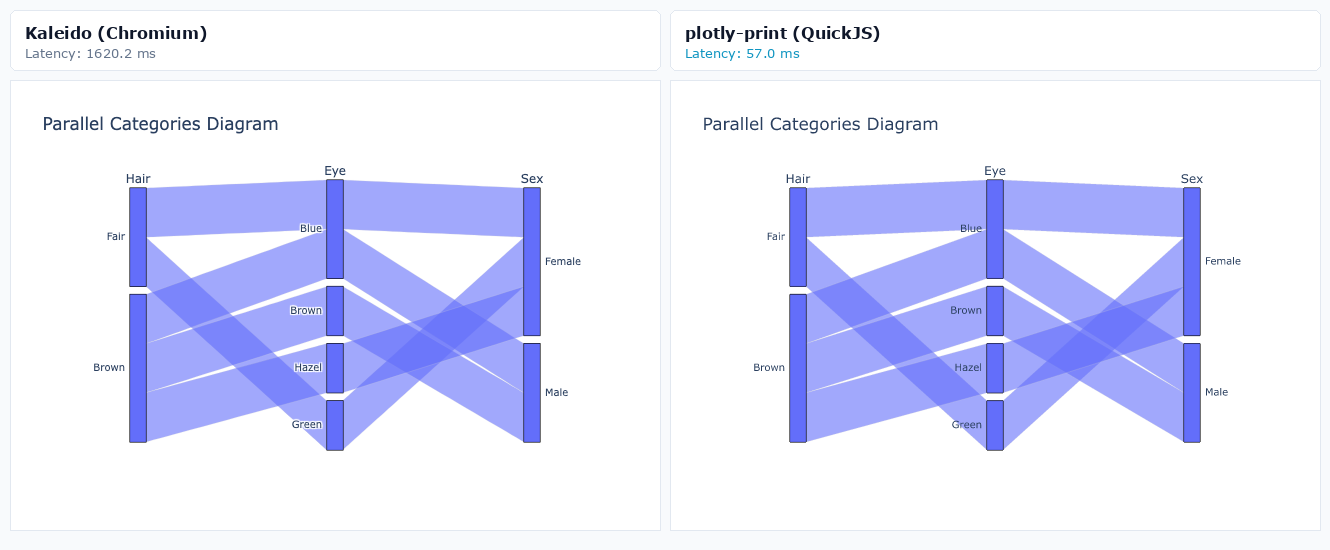
Parallel Categories Diagram (plotly-print: 68.7ms | Kaleido: 1551.1ms)
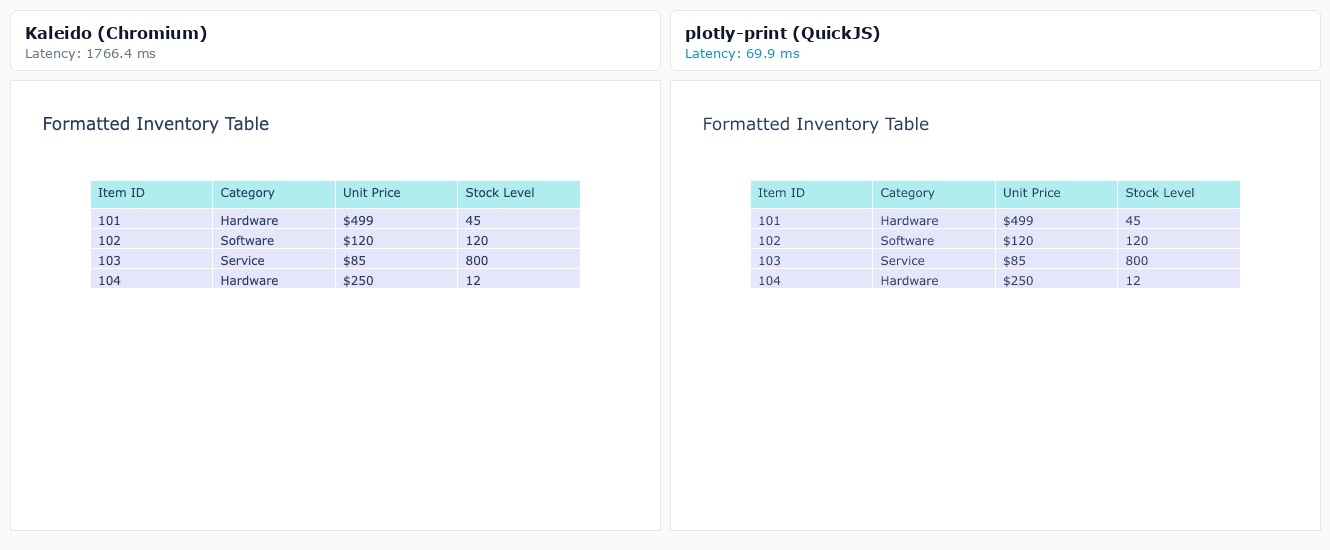
Formatted Data Table (plotly-print: 96.7ms | Kaleido: 1588.6ms)
Carpet Coordinate Plot (plotly-print: 99.5ms | Kaleido: 1647.8ms)
Layout edge cases
Bar chart with X labels at 45 deg (plotly-print: 92.5ms | Kaleido: 1741.8ms)
Bar chart with X labels at 90 deg (plotly-print: 101.8ms | Kaleido: 1609.2ms)
Annotation arrowheads (incl. circle) (plotly-print: 86.5ms | Kaleido: 1663.2ms)
Long annotation arrows (dasharray length) (plotly-print: 93.3ms | Kaleido: 1650.6ms)
Attribution
plotly-print is an independent project derived from Mirage by Benjamin Lear (MIT). Bundled plotly.js is copyright Plotly, Inc. (MIT); see THIRD_PARTY_NOTICES.md.
1 maintainer

Metadata
1 maintainer
Release files for plotly-print 0.2.0
For a detailed explanation of source distributions (sdists) and built distributions (wheels), please see the package formats documentation.
Source distribution (sdist)
| File | Size | Uploaded | Provenance | |
|---|---|---|---|---|
| plotly_print-0.2.0.tar.gz | 2.1 MB | Without provenance | Details |
Built distribution (wheel)
| File | Interpreter | ABI | Platform | Reset |
|---|---|---|---|---|
| plotly_print-0.2.0-py3-none-any.whl | Python 3 | none | any | Details |
Total release size: 2.8 MB
Release files / plotly_print-0.2.0.tar.gz
| Download URL | plotly_print-0.2.0.tar.gz |
|---|---|
| Size | 2.1 MB |
| Tags | Source |
|
SHA-256 checksum How to use checksums |
ef0058e52813b714c2cf36953d8d1b65187f29d0075261b37a8740c8ef059ec8
|
|
BLAKE2b-256 checksum How to use checksums |
777efd1e82797364cdc702f0f83cf555d4631fe2915ab1685c25d777fc5fa99c
|
| Upload date | |
|
Uploaded using Trusted Publishing? What is trusted publishing? |
Yes |
| Uploaded via |
uv/0.13.0 {"installer":{"name":"uv","version":"0.13.0","subcommand":["publish"]},"python":null,"implementation":{"name":null,"version":null},"distro":{"name":"Ubuntu","version":"24.04","id":"noble","libc":null},"system":{"name":null,"release":null},"cpu":null,"openssl_version":null,"setuptools_version":null,"rustc_version":null,"ci":true}
|
Release files / plotly_print-0.2.0-py3-none-any.whl
| Download URL | plotly_print-0.2.0-py3-none-any.whl |
|---|---|
| Size | 710.6 kB |
| Tags | Python 3 |
|
SHA-256 checksum How to use checksums |
b7a8b338d18e3817a207d496f21f97a5a4c88a452f67389070906f03d7949ce6
|
|
BLAKE2b-256 checksum How to use checksums |
25b66181519cfcfb62995259b460fc7c1b7da64aee12d5df71b9463ded7f0f8e
|
| Upload date | |
|
Uploaded using Trusted Publishing? What is trusted publishing? |
Yes |
| Uploaded via |
uv/0.13.0 {"installer":{"name":"uv","version":"0.13.0","subcommand":["publish"]},"python":null,"implementation":{"name":null,"version":null},"distro":{"name":"Ubuntu","version":"24.04","id":"noble","libc":null},"system":{"name":null,"release":null},"cpu":null,"openssl_version":null,"setuptools_version":null,"rustc_version":null,"ci":true}
|
Security for plotly-print 0.2.0
Provenance
Provenance describes where a file came from. On PyPI, provenance is shared via attestations, which provide a verifiable record of the build or publishing details. View details, limitations and caveats.
No provenance found
None of the files in this release were uploaded with provenance metadata.
A note on package security
PyPI is a repository for distributing packages, not a service for auditing them. While third-party security researchers and our staff do their best to detect and remove malicious packages, PyPI cannot guarantee the quality, security or suitability of any given package.
To learn more about protecting yourself from malicious actors, visit our package security documentation.














