UpSet intersection visualization utility for Plotly (Python-only) - Fork of plotly-upset by Hasan Shahrier

Project description

plotly-upset
UpSet intersection visualization utility for Plolty (Python-only)
Installation
pip install git+https://github.com/hshhrr/plotly-upset.git
Examples
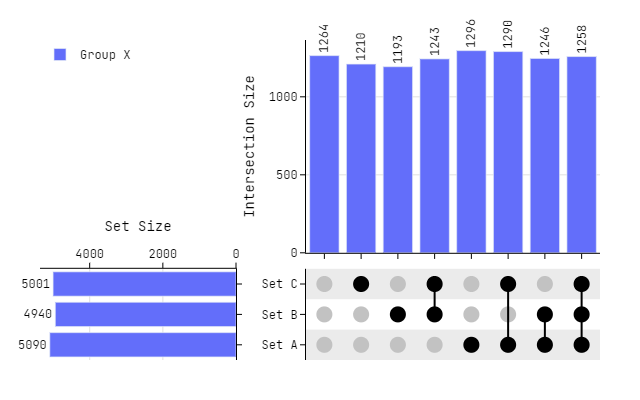
Basic use
import numpy as np
import pandas as pd
from plotly_upset.plotting import plot_upset

# Dummy Data
set_list = ["Set A", "Set B", "Set C"]
df = pd.DataFrame(
    np.random.randint(0, 2, size=(10_000, len(set_list))), columns=set_list
)

# Plotting
fig = plot_upset(
    dataframes=[df],
    legendgroups=["Group X"],
    marker_size=16,
)

fig.update_layout(
    font_family="Jetbrains Mono",
)

fig.show()
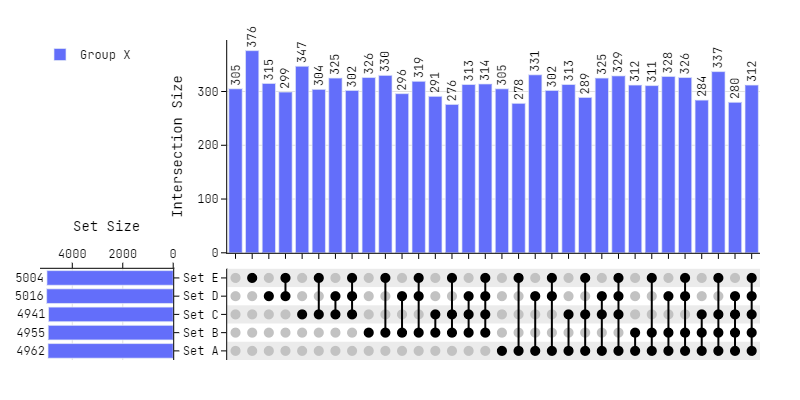
Scaling (Sets)
# 5 Sets
set_list = ["Set A", "Set B", "Set C", "Set D", "Set E"]
df = pd.DataFrame(
    np.random.randint(0, 2, size=(10_000, len(set_list))), columns=set_list
)

# Plotting
fig = plot_upset(
    dataframes=[df],
    legendgroups=["Group X"],
    column_widths=[0.2, 0.8],
    horizontal_spacing = 0.075,
    marker_size=10,
)

fig.update_layout(
    width=800,
    font_family="Jetbrains Mono",
)

fig.show()
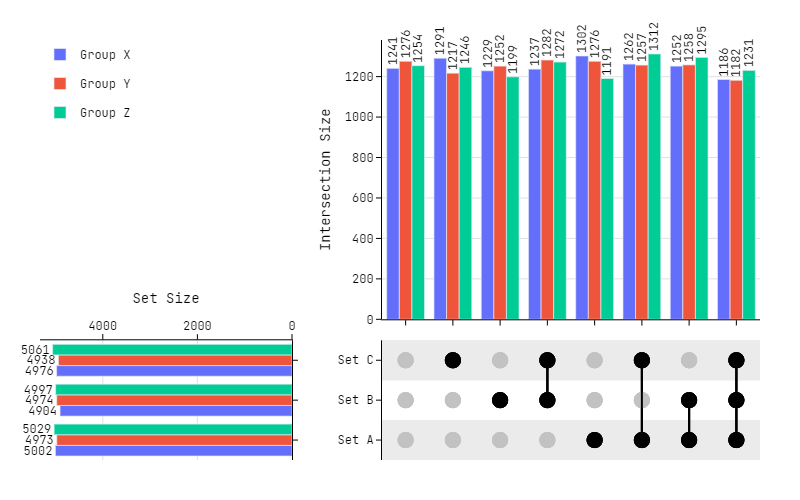
Scaling (Dataframes)
# 3 Dataframes
set_list = ["Set A", "Set B", "Set C"]
df0 = pd.DataFrame(
    np.random.randint(0, 2, size=(10_000, len(set_list))), columns=set_list
)
df1 = pd.DataFrame(
    np.random.randint(0, 2, size=(10_000, len(set_list))), columns=set_list
)
df2 = pd.DataFrame(
    np.random.randint(0, 2, size=(10_000, len(set_list))), columns=set_list
)

# Plotting
fig = plot_upset(
    dataframes=[df0, df1, df2],
    legendgroups=["Group X", "Group Y", "Group Z"],
    marker_size=16,
)

fig.update_layout(
    height=500,
    width=800,
    font_family="Jetbrains Mono",
)

fig.show()
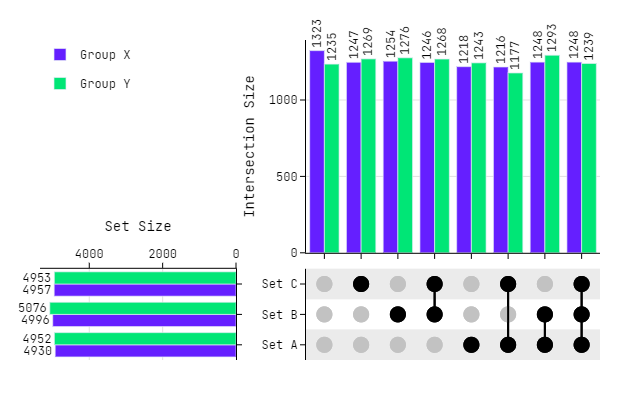
Custom Marker Colors
# Dummy Data
set_list = ["Set A", "Set B", "Set C"]
df0 = pd.DataFrame(
    np.random.randint(0, 2, size=(10_000, len(set_list))), columns=set_list
)
df1 = pd.DataFrame(
    np.random.randint(0, 2, size=(10_000, len(set_list))), columns=set_list
)

# Custom Marker Colors
cmc = ["#651FFF", "#00E676"]

# Plotting
fig = plot_upset(
    dataframes=[df0, df1],
    legendgroups=["Group X", "Group Y"],
    marker_colors=cmc,
    marker_size=16,
)

fig.update_layout(
    font_family="Jetbrains Mono",
)

fig.show()
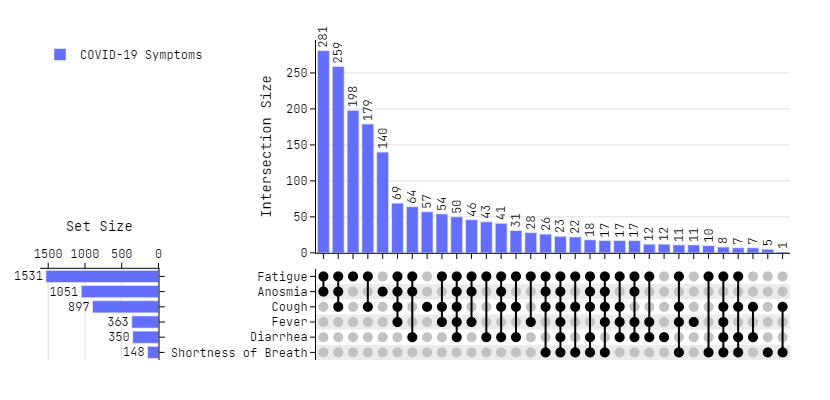
Sorting and Removing Zero Values
# Data - Source https://github.com/hms-dbmi/upset-altair-notebook
df = pd.read_csv(
    'https://raw.githubusercontent.com/hms-dbmi/upset-altair-notebook/master/data/covid_symptoms_table.csv',
    usecols=lambda x: x != 'id'
)

# Plotting
fig = plot_upset(
    dataframes=[df],
    legendgroups=["COVID-19 Symptoms"],
    exclude_zeros=True,
    sorted_x="d",
    sorted_y="a",
    column_widths=[0.2, 0.8],
    horizontal_spacing = 0.21,
    marker_size=10,
)

fig.update_layout(
    width=830,
    font_family="Jetbrains Mono",
)

fig.show()
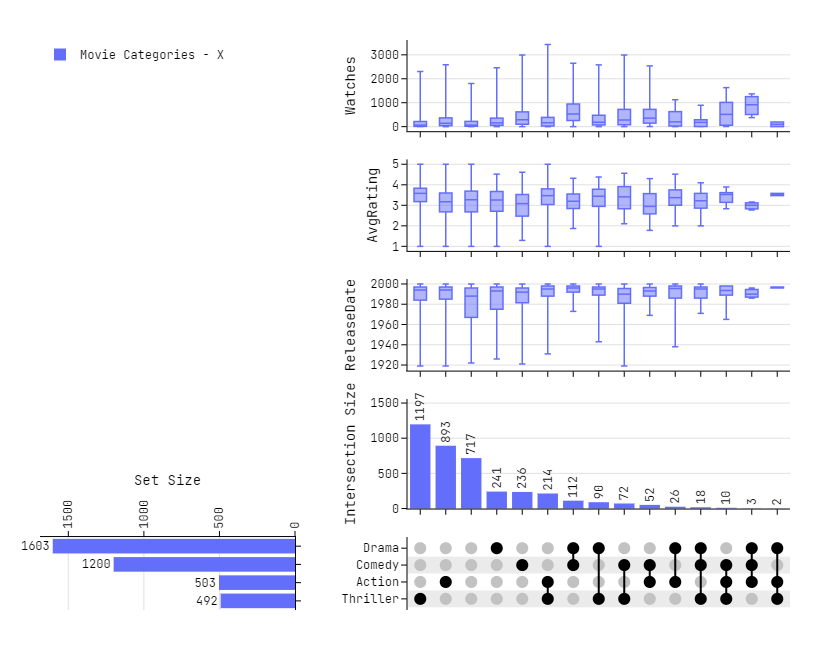
Adding Marginal Plots
# Data - Source https://github.com/hms-dbmi/UpSetR/blob/master/inst/extdata/movies.csv
movies = pd.read_csv(
    "https://raw.githubusercontent.com/hms-dbmi/UpSetR/master/inst/extdata/movies.csv",
    sep=';'
)

# Preprocessing - Taking 4 categories with most number of samples
df = movies.drop(columns=['Name', 'ReleaseDate', 'AvgRating', 'Watches'])
x = [(df[cat].sum(), cat) for cat in df]
x = np.array(sorted(x, reverse=True))
x = x.T[1][:4]
df = movies[x]

# Plotting
fig = plot_upset(
    dataframes=[df],
    legendgroups=["Movie Categories - X"],
    exclude_zeros=True,
    sorted_x="d",
    sorted_y="a",
    row_heights=[0.6, 0.4],
    vertical_spacing = 0.,
    horizontal_spacing = 0.15,
    marginal_data=[movies['ReleaseDate'], movies['AvgRating'], movies['Watches']],
    marginal_title=['ReleaseDate', 'AvgRating', 'Watches']
)

fig.update_layout(
    height=650,
    width=830,
    font_family="Jetbrains Mono",
)

fig.show()
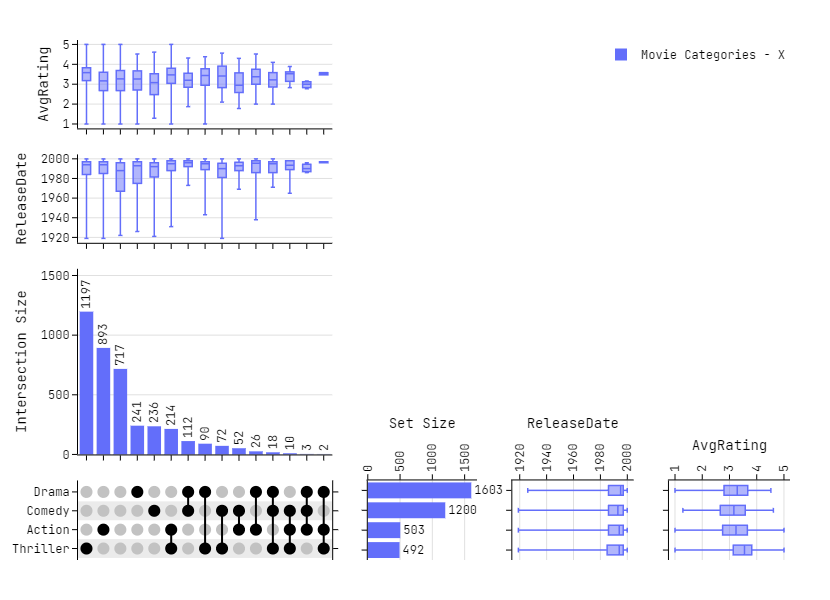
Adding Marginal Plots - Both Axis
# Plotting
fig = plot_upset(
    dataframes=[df],
    legendgroups=["Movie Categories - X"],
    exclude_zeros=True,
    sorted_x="d",
    sorted_y="a",
    column_widths=[0.3, 0.7],
    vertical_spacing = 0.,
    horizontal_spacing = 0.05,
    marginal_y=True,
    marginal_data=[movies['ReleaseDate'], movies['AvgRating']],
    marginal_title=['ReleaseDate', 'AvgRating'],
)

fig.update_layout(
    height=600,
    width=830,
    font_family="Jetbrains Mono",
)

fig.show()
Citation
If you use an UpSet figure in a publication using this library, please cite the original paper.
@article{2014_infovis_upset,
    title = {UpSet: Visualization of Intersecting Sets},
    author = {Alexander Lex and Nils Gehlenborg and Hendrik Strobelt and Romain Vuillemot and Hanspeter Pfister},
    journal = {IEEE Transactions on Visualization and Computer Graphics (InfoVis)},
    doi = {10.1109/TVCG.2014.2346248},
    volume = {20},
    number = {12},
    pages = {1983--1992},
    year = {2014}
}
Release history Release notifications | RSS feed


Download files
Download the file for your platform. If you're not sure which to choose, learn more about installing packages.
Source Distribution
plotly-upset-hd-0.0.1.tar.gz
(10.1 kB
view details)
Built Distribution
Filter files by name, interpreter, ABI, and platform.
If you're not sure about the file name format, learn more about wheel file names.
Copy a direct link to the current filters
File details
Details for the file plotly-upset-hd-0.0.1.tar.gz.
File metadata
- Download URL: plotly-upset-hd-0.0.1.tar.gz
- Upload date:
- Size: 10.1 kB
- Tags: Source
- Uploaded using Trusted Publishing? No
- Uploaded via: twine/6.1.0 CPython/3.10.16
File hashes
| Algorithm | Hash digest | |
|---|---|---|
| SHA256 |
57a86fc64802c63c062fbd827a73c00ea6de12f1fa0facceb35121d625320016
|
|
| MD5 |
65fa0901be9846d323183f60e3ffef57
|
|
| BLAKE2b-256 |
4cb1966b94a66c2c31396fa44942c1663a31d24f66e89a77d4a8fb1140d2fb8b
|
File details
Details for the file plotly_upset_hd-0.0.1-py3-none-any.whl.
File metadata
- Download URL: plotly_upset_hd-0.0.1-py3-none-any.whl
- Upload date:
- Size: 9.0 kB
- Tags: Python 3
- Uploaded using Trusted Publishing? No
- Uploaded via: twine/6.1.0 CPython/3.10.16
File hashes
| Algorithm | Hash digest | |
|---|---|---|
| SHA256 |
adb10ed85ac09c7341ab0fc669b1b6152016df0cf09adc79c721828a59595af7
|
|
| MD5 |
3d16504a1462f2b504bf830ffb6ac29a
|
|
| BLAKE2b-256 |
b45d71e4866902967f3267e36ab5b3bb4e9435d3cda397e1d876083602974caf
|


