

Plots and graphs
Visualizations of Machine Learning Metrics quick and simple. Save your time.



Every Machine Learning project requires the evaluation of the algorithm's performance. Many metrics are task specific (classification, regression, ...) but are used again and again and have to be plotted again and again. Plotsandgraphs makes it easier for you to visualize these metrics by providing a library with tidy and clear graphs for the most common metrics. It serves as a wrapper for the popular matplotlib package to create figures. This also allows users to apply custom changes, if necessary.
Plotsandgraphs is model- and framework-agnostic. This means that plotsandgraphs only needs the algorithm's results to perform analysis and visualization and not the actual model itself. In the case of a binary classifier only the true labels as well as the predicted probabilities are required as input. Instead of spending time in visualizing results for each metric, plotsandgraphs can calculate and visualize all classification metrics with a single line of code.
Plotsandgraphs provides analysis and visualization for the following problem types:
- binary classification
- multi-class classification (coming soon)
- regression (coming soon)
Furthermore, this library presents other useful visualizations, such as comparing distributions.
Overview of graphs and plots
-
binary classifier
- Accuracy
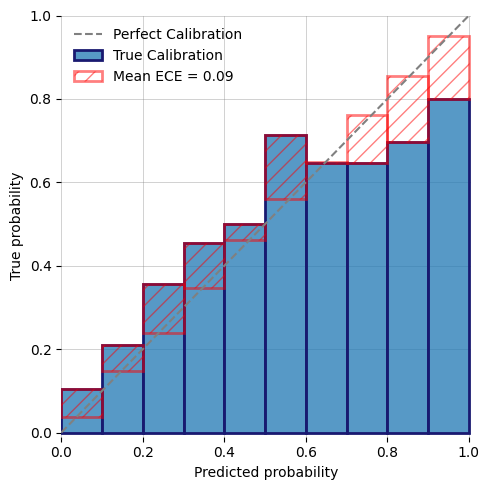
- Calibration Curve
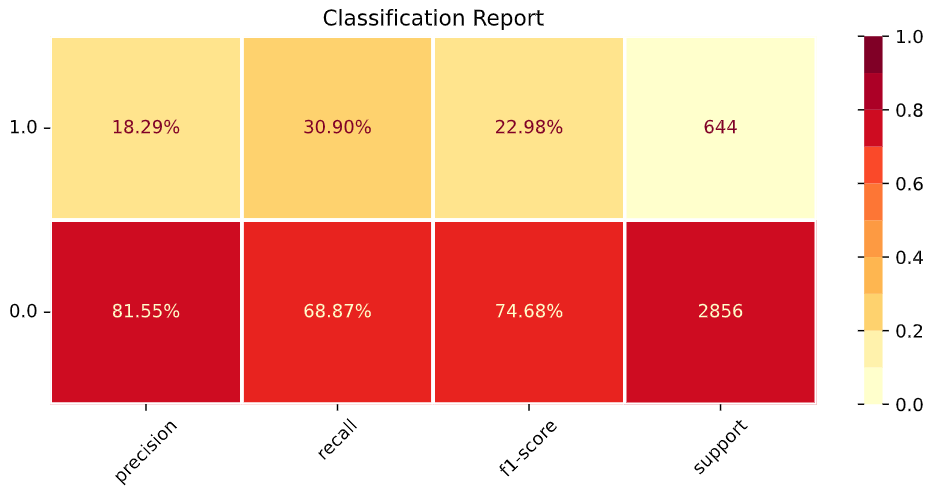
- Classification Report
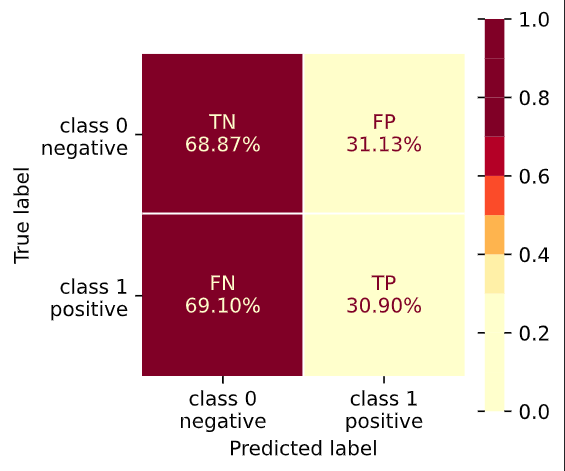
- Confusion Matrix
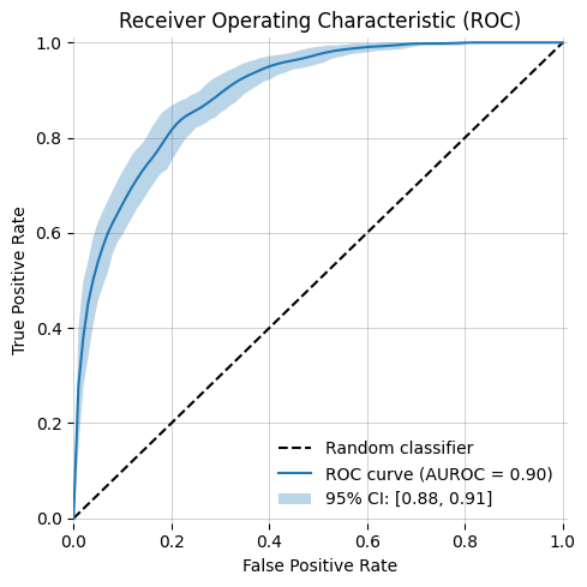
- ROC curve (AUROC)
- y_score histogram
-
multi-class classifier
-
regression
-
comparing distributions
- raincloud plot
Gallery
 |
 |
 |
|---|---|---|
| Calibration Curve | Classification Report | Confusion Matrix |
 |
 |
 |
|---|---|---|
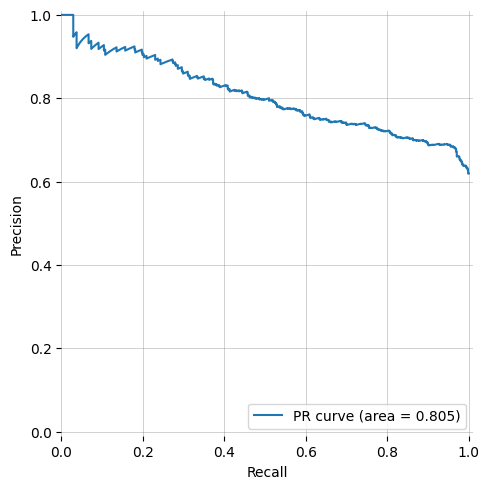
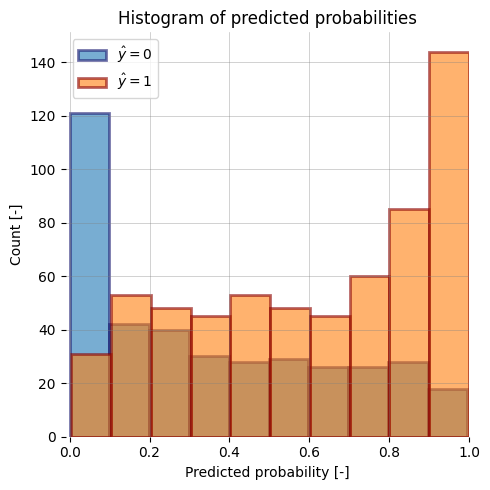
| ROC Curve (AUROC) with bootstrapping | Precision-Recall Curve | y_score histogram |
 |
 |
|
|---|---|---|
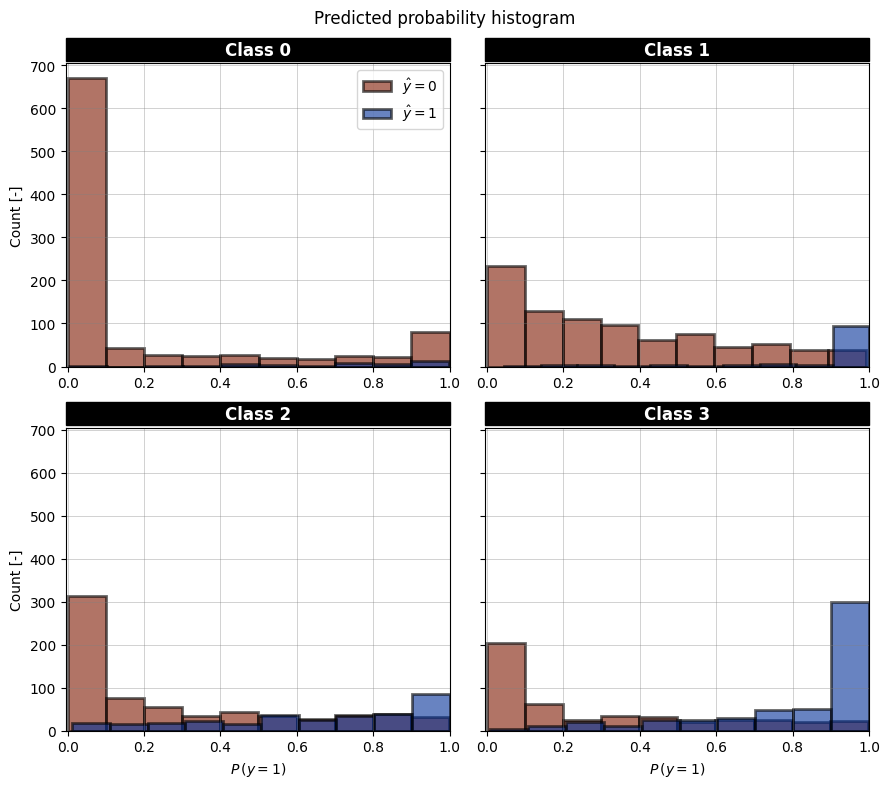
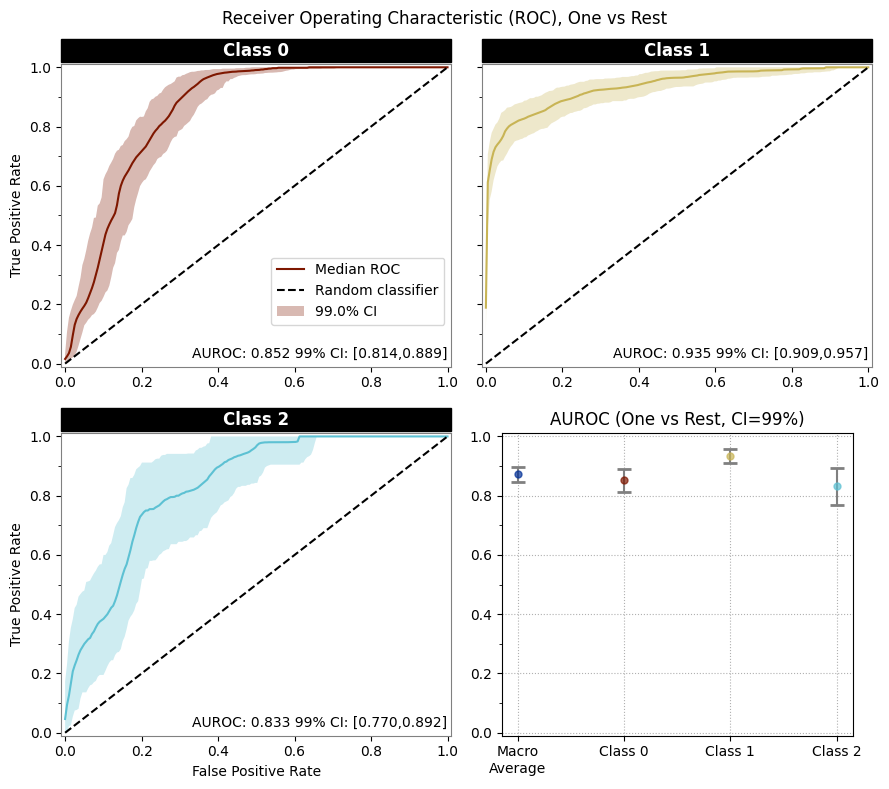
| Histogram (y_scores) | ROC curves (AUROC) with bootstrapping |
Other resources
Why create everything from scratch, if some things already exist? Here are some helpful resources that can improve your visualization skills.
- Python Graph Gallery - A great collection of graphs. First look at their gallery, then check out their 'BEST' collection for inspiration.
- Scientific Visualization Book - Definitely check out the first part for essential tips for good graphs. And then deep dive further to improve your visualization game.
- CHARTIO - A must read on how to choose colors and color palettes.
Install
Install the package via pip.
pip install plotsandgraphs
Alternatively install the package from git directly.
git clone https://github.com/joshuawe/plots_and_graphs
cd plots_and_graphs
pip install -e .
Usage
Get all classification metrics with ONE line of code. Here, for a binary classifier:
import plotsandgraphs as pandg
# ...
pandg.pipeline.binary_classifier(y_true, y_score)
Or with some more configs:
configs = {
  'roc': {'n_bootstraps': 10000},
  'pr': {'figsize': (8,10)}
}
pandg.pipeline.binary_classifier(y_true, y_score, save_fig_path='results/metrics', file_type='png', plot_kwargs=configs)
For multiclass classification:
# with multiclass data y_true (one-hot encoded) and y_score
pandg.pipeline.multiclass_classifier(y_true, y_score)
Requirements
Show all requirements
Contributors

-
DALL-E 3 created the project logo on 17th October 2023. Prompt used: Illustration of a stylized graph with colorful lines and bars, representing data visualization, suitable for a project logo named 'plots and graphs'.
-
The Scientific colour maps in the
plotsandgraphs/cmapsfolder (Crameri 2018) are used in this library to prevent visual distortion of the data and exclusion of readers with colour-vision deficiencies (Crameri et al., 2020).
Reference
Of course we are happy to be mentioned in any way, if our repository has helped you. You can also share this repository with your friends and collegues to make their lives easier. Cheers!
1 maintainer

Metadata
1 maintainer
Release files for plotsandgraphs 0.1.4
For a detailed explanation of source distributions (sdists) and built distributions (wheels), please see the package formats documentation.
Source distribution (sdist)
| File | Size | Uploaded | |
|---|---|---|---|
| plotsandgraphs-0.1.4.tar.gz | 34.6 kB | Details |
Built distribution (wheel)
| File | Interpreter | ABI | Platform | Reset |
|---|---|---|---|---|
| plotsandgraphs-0.1.4-py3-none-any.whl | Python 3 | none | any | Details |
Total release size: 66.7 kB
Release files / plotsandgraphs-0.1.4.tar.gz
| Download URL | plotsandgraphs-0.1.4.tar.gz |
|---|---|
| Size | 34.6 kB |
| Tags | Source |
|
SHA-256 checksum How to use checksums |
6b060e8c4495b5e95c8a1a605019957b578bcfeed98522c3838d3c2e6f1eb3fe
|
|
BLAKE2b-256 checksum How to use checksums |
b6be1308c7e843ea744de8163689a4734f5afa41ed079010945a25b81820fee7
|
| Upload date | |
|
Uploaded using Trusted Publishing? What is trusted publishing? |
No |
| Uploaded via |
twine/4.0.2 CPython/3.12.1
|
Release files / plotsandgraphs-0.1.4-py3-none-any.whl
| Download URL | plotsandgraphs-0.1.4-py3-none-any.whl |
|---|---|
| Size | 32.1 kB |
| Tags | Python 3 |
|
SHA-256 checksum How to use checksums |
5f3b8cdc1665fd16f1c66f3be4b42a14d76494b1793139c5041e6fc3e162f4a8
|
|
BLAKE2b-256 checksum How to use checksums |
194259f7591f0eea83bb542affdcecc9353322d73d67ef7f6abc0fe96628dabd
|
| Upload date | |
|
Uploaded using Trusted Publishing? What is trusted publishing? |
No |
| Uploaded via |
twine/4.0.2 CPython/3.12.1
|














