plutus_backtest is a python package for backtesting investment decisions using Python 3.6 and above.
Project description
plutus_backtest
Description:
This project has been performed for the purpose of local backtests of financial strategies. The package contains various indicators and tools allowing users obtaining exact results of their strategies over a certain period of time. The users are also able to pick endless amount of trading instruments and set criteria such as long or short positioning. Beside that optional stop loss and take profit signals are available not only as general limit level for entire portfolio but can be also applied for each instrument individually. Another optional tool available is weights factor distribution which is oriented to assign weights according to the provided values. In addition, the package allows to create several backtests and combine them all together into one to see the full picture of the investment strategy.
Tickers for analysis are available on Yahoo Finance page.
Installation:
- Dependency: pandas, numpy, plotly, yfinance
- Install from pypi:
pip install plutus_backtest
- Verified in Python:
from plutus_backtest import backtest
Examples:
Class "backtest" contains below parameters:
asset: str or list or series
    Instruments taken into the consideration for the backtest.

o_day: list of str or timestamps or series
    Day/Days of the position opening.

c_day: list of str or timestamps or series
    Day/Days of the position closing.

weights_factor: list of int or float or array-like or series default None
    Optional list of factors which will be considered to define the weights for taken companies. By default
    all weights are distributed equally, however if the list of factors provided the backtest will maximize
    the weights towards the one with max weight factor. Negative weight factor will be considered as short selling.

take_profit: list of float or int or series default None
    List of values determining the level till a particular stock shall be traded.

stop_loss: list of float or int or series default None
    List of values determining the level till a particular stock shall be traded.

benchmark: str default None
    A benchmark ticker for comparison with portfolio performance
A short and fast way to run a single backtest would be:
from plutus_backtest import backtest

bt = backtest(asset=["AAPL", "BTC-USD", "GC=F"],
              o_day=["2021-08-01", "2021-07-15", "2021-08-20"],
              c_day=["2021-09-01", "2021-09-01", "2021-09-15"])

bt.execution()
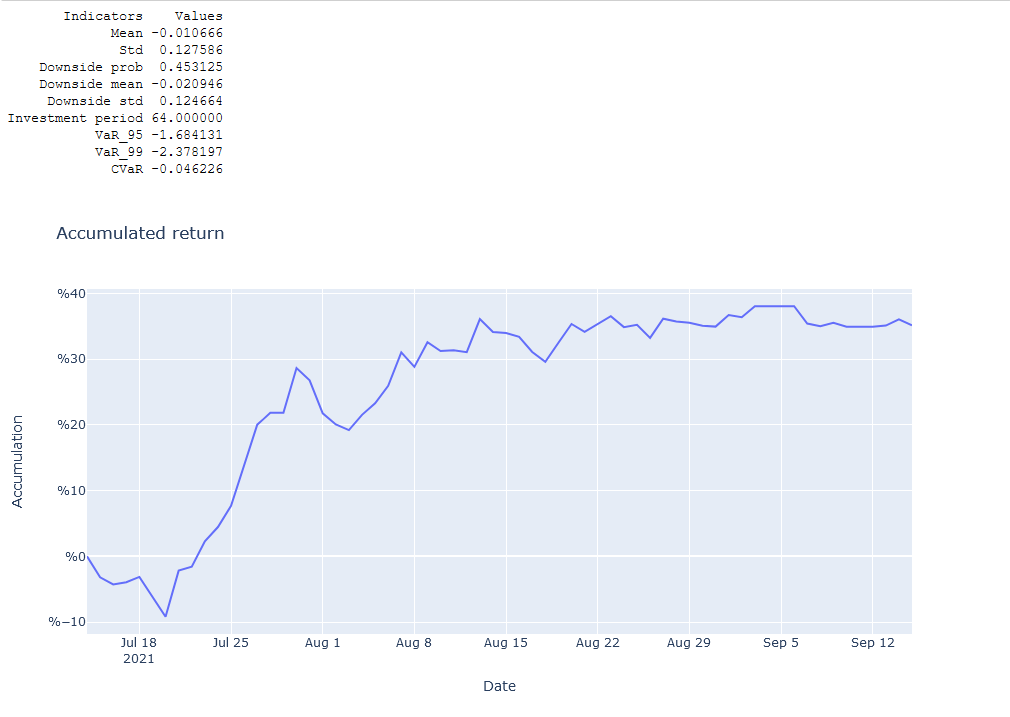
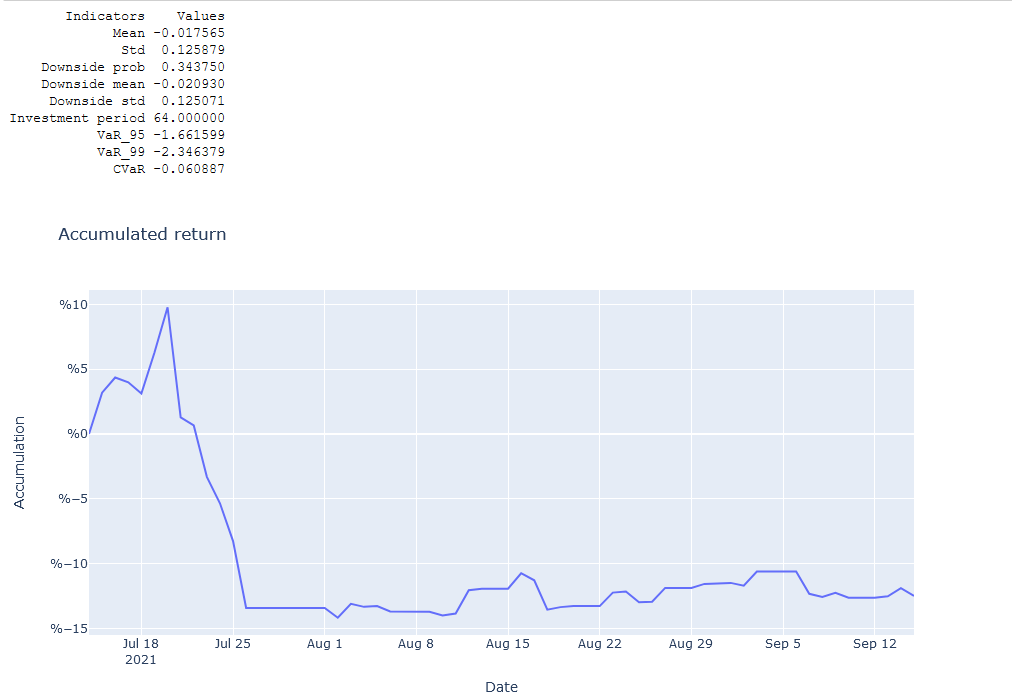
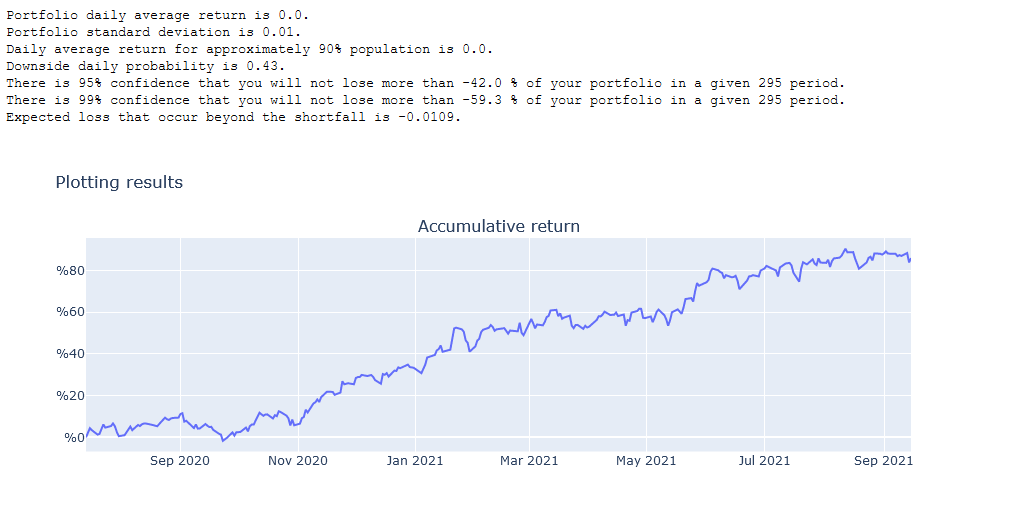
As a result you will see a statistical table as well as graphical representation of the portfolio which shows accumulated return.
In order to access dataframe with daily changes, use:
from plutus_backtest import backtest

bt = backtest(asset=["AAPL", "BTC-USD", "GC=F"],
              o_day=["2021-08-01", "2021-07-15", "2021-08-20"],
              c_day=["2021-09-01", "2021-09-01", "2021-09-15"])

bt.portfolio_construction()

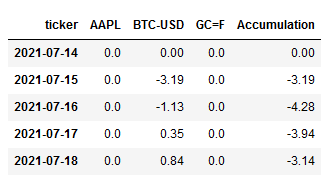
bt.execution_table.head()
The result will appear as following (all values are in %):
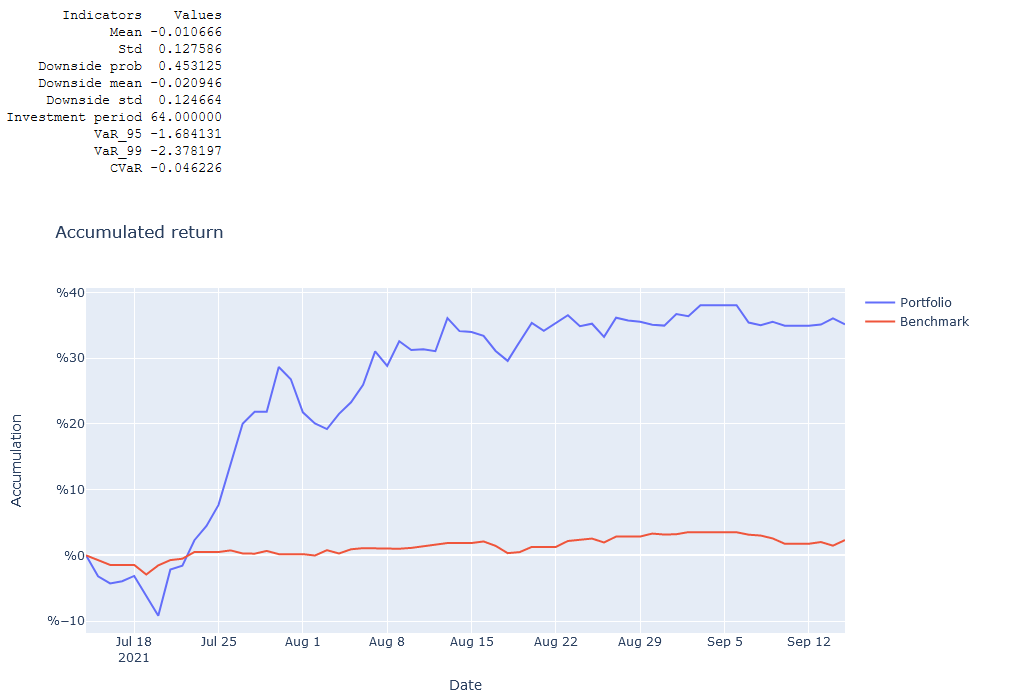
If you would like to compare performance of your portfolio with any other instrument you can use a parameter "benchmark":
from plutus_backtest import backtest

bt = backtest(asset=["AAPL", "BTC-USD", "GC=F"],
              o_day=["2021-08-01", "2021-07-15", "2021-08-20"],
              c_day=["2021-09-01", "2021-09-01", "2021-09-15"],
              benchmark = "SPY")

bt.execution()
Above example will additionaly plot a SPY index performance (accumulated return from same period as your portfolio) on your portfolio graph:
"plotting" function will enable users to observe additional graphs such as drawdown and monthly income plots:
from plutus_backtest import backtest

bt = backtest(asset=["AAPL", "F", "MS"],
              o_day=["2020-08-01", "2020-07-15", "2020-08-20"],
              c_day=["2021-09-01", "2021-09-01", "2021-09-15"])

bt.plotting()

If you didn't specified weights of particular assets in your portfolio (using weights_factor parameter), % allocation will be distributed equally (in selected period of time) and shown in the last plot called Weights distribution.
from plutus_backtest import backtest

bt = backtest(asset=["AAPL", "F", "MS"],
              o_day=["2020-08-01", "2020-07-15", "2020-08-20"],
              c_day=["2021-09-01", "2021-09-01", "2021-09-15"],
              weights_factor = [50, 40, 10])

bt.plotting()
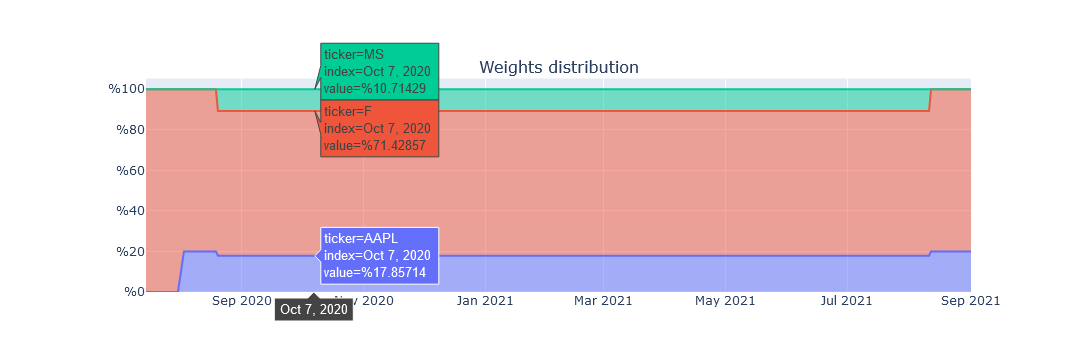
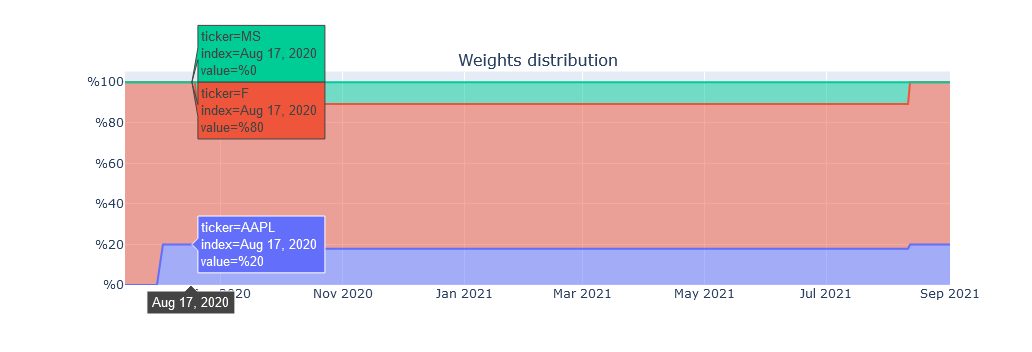
In case of specifying % of portfolio allocation for each asset (AAPL = 50%, F = 40%, MS = 10% from above example) above plots will be adjusted. Example of Weights distribution plot:
No need to include weights that will sum up to 100% (but it is recommended). Code calculates % based on value / total of absolute values. For example:
from plutus_backtest import backtest

bt = backtest(asset=["AAPL", "F", "MS"],
              o_day=["2020-08-01", "2020-07-15", "2020-08-20"],
              c_day=["2021-09-01", "2021-09-01", "2021-09-15"],
              weights_factor = [35, 140, -21])

bt.plotting()
weights_factor total is 196 [35 + 140 + 21].
AAPL: 35 / 196 = ~17%
F: 140 / 196 = ~71.4%
MS: |21| / 196 = ~10.7%
If only 2 out of 3 assets are traded in selected period, weights will be calculated as described above, but excluding 3rd asset.
weights_factor total is 175 [35 + 140].
AAPL: 35 / 175 = 20%
F: 140 / 175 = 80%
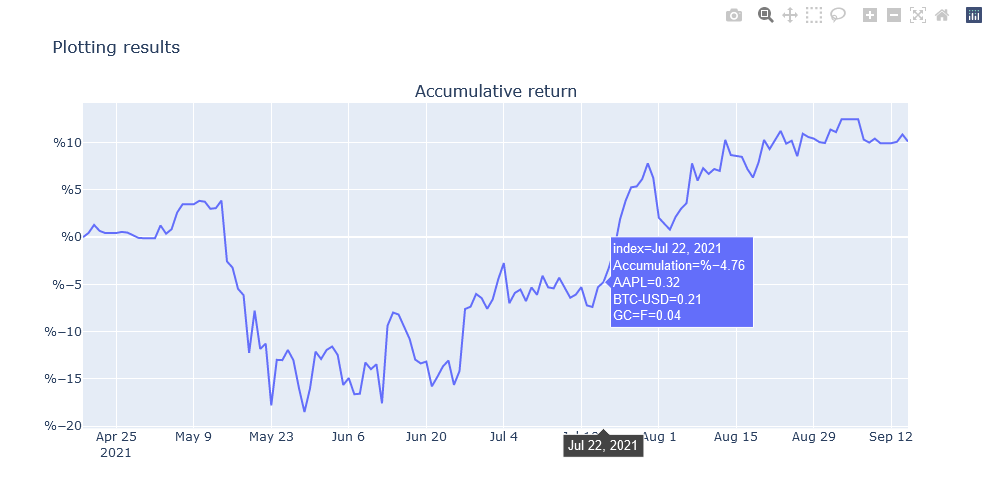
All plots are interactive and contain some details. For example "Accumulative return" plot reflects (from top to bottom):
- Date;
- Accumulation (in %) till selected date;
- Daily changes (in %) for each instrument you called.
More complex approach would be assigning weights factor/stop loss/ take profit indicators:
from plutus_backtest import backtest

bt = backtest(asset = ["AAPL", "BTC-USD","GC=F"],
              o_day = ["2021-08-01", "2021-07-15", "2021-08-20"],
              c_day = ["2021-09-01", "2021-09-01","2021-09-15"],
              weights_factor = [10, -5, 35],
              stop_loss = [0.8, 0.9, 0.95],
              take_profit = [1.1, 1.2, 1.05])

bt.execution()
In this case all parameters are used. The weights will not be distributed equally. "AAPL" will have 20% of the total portofolio BTC-USD - 10% and "GC=F" will have 70%. The negative sign in the weights factor will mean short selling, therefore first "AAPL" and "GC=F" instruments are in long position and "BTC-USD" is in the short.
Stop loss and take profit shall be interpreted as "AAPL" has 20% of stop loss and 10% of take profit, "BTC-USD" has 10% of stop loss and 20% of take profit, "GC=F" 5% of stop loss and 5% of take profit. As result accumulative graph will look as:
In the moment when one of the securities reaching its stop loss or take profit, the trade will automatically stopped and the weights will be reassigned respectively to the left assets.
In case of users need to test one instrument but several times with different timelines, the package will interpret it as:
from plutus_backtest import backtest

bt = backtest(asset = ["AMZN", "AMZN","AMZN"],
              o_day = ["2021-08-01", "2021-09-01", "2021-10-01"],
              c_day = ["2021-08-15", "2021-09-15","2021-10-15"])

bt.portfolio_construction()

bt.execution_table.head(15)
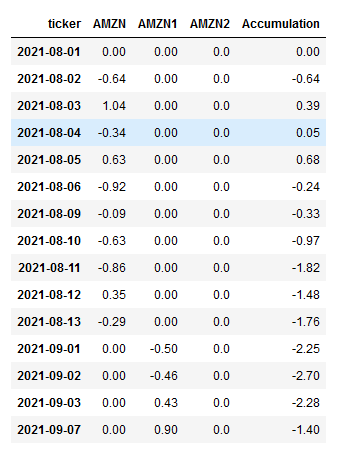
Each time when one asset is repeating the package will assign additional number to it to track required periods. It's worth to mention that due to data limitation the code will use only close price for the analysis of the securities. Only the first trading day has relationship open/close, since it's assumed that the tradingstarts with open price and finishes with close one.
Ultimately, if the users would like to perform several backtest and combine them into one to see the full picture then there are few functions related to that, namely:
from plutus_backtest import backtest

bt1 = backtest(asset = ["AAPL", "BTC-USD","GC=F"],
               o_day = ["2021-08-01", "2021-07-15", "2021-08-20"],
               c_day = ["2021-09-01", "2021-09-01","2021-09-15"])

bt2 = backtest(asset = ["AMZN", "EURUSD=X"],
               o_day = ["2021-06-01", "2021-06-15"],
               c_day = ["2021-06-30", "2021-07-05"])

p1 = bt1.portfolio_construction()
p2 = bt2.portfolio_construction()
q1 = bt1.final_portfolio
q2 = bt2.final_portfolio

dic ={}
dic[0] = q1
dic[1]= q2

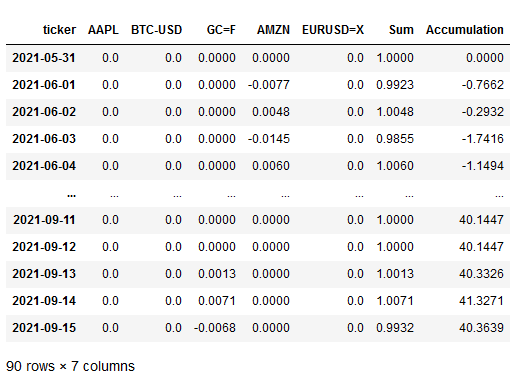
combined_frame = backtest.puzzle_assembly(dic)

combined_frame
First of all all backtest shall be executed in order to obtain final portfolio of the each one. Then they shall be assigned to an empty dictionary. Thereafter function "puzzle_assembly" takes the data from diffirent backtest and unite it into one dataframe. Please note: only "Accumulation" column from below table is shown in %.
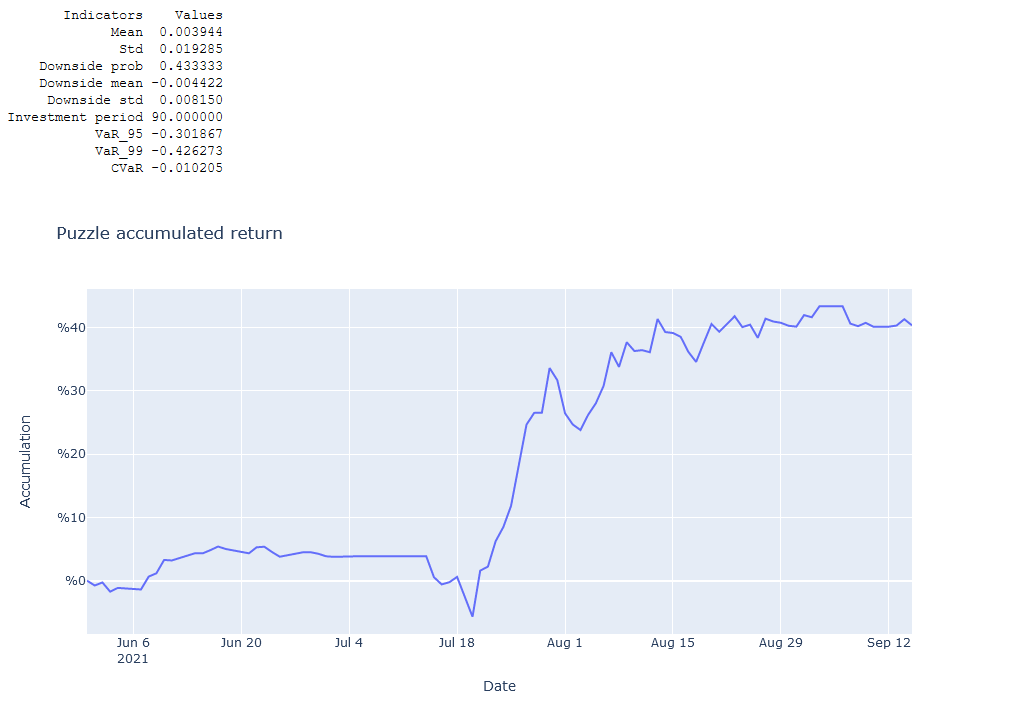
In order to visualize data functions "puzzle_execution" or "puzzle_plotting" shall be called. Which work exactly in the same way as it was explained previously.
from plutus_backtest import backtest

bt1 = backtest(asset = ["AAPL", "BTC-USD","GC=F"],
               o_day = ["2021-08-01", "2021-07-15", "2021-08-20"],
               c_day = ["2021-09-01", "2021-09-01","2021-09-15"])

bt2 = backtest(asset = ["AMZN", "EURUSD=X"],
               o_day = ["2021-06-01", "2021-06-15"],
               c_day = ["2021-06-30", "2021-07-05"])

p1 = bt1.portfolio_construction()
p2 = bt2.portfolio_construction()
q1 = bt1.final_portfolio
q2 = bt2.final_portfolio

dic ={}
dic[0] = q1
dic[1]= q2

combined_frame = backtest.puzzle_assembly(dic)

backtest.puzzle_execution(combined_frame)
Support:
Please open an issue for support.
With additional questions please reachout to autors directly:
Project details
Release history Release notifications | RSS feed
Download files
Download the file for your platform. If you're not sure which to choose, learn more about installing packages.
Source Distribution
Built Distribution
Hashes for plutus_backtest-0.1.7-py3-none-any.whl
| Algorithm | Hash digest | |
|---|---|---|
| SHA256 | 81d27bf9a3d221c4989a5be21f9b13d8eb3b829b3d9af9442c130ffa1e9efb6a |
|
| MD5 | 545d734a68a3cf009061ae5c67950c59 |
|
| BLAKE2b-256 | dfdb1b14cbb98b2ae80542e0dd876b20f4bc0eeb75dfd06cc4dde743794c07fe |


