Extra visualization functions

Project description
Polyptich: easier layouting in matplotlib
import polyptich as pp
fig = pp.Figure()
ax = pp.Panel((2, 2))
ax.plot([1, 2, 3], [1, 2, 3])
fig.main.add_right(ax)

ax = pp.Panel((2, 2))
ax.plot([1, 2, 3], [1, 2, 3])
fig.main.add_right(ax)

ax = pp.Panel((2, 2))
ax.plot([1, 2, 3], [1, 2, 3])
fig.main.add_right(ax)
fig.display()
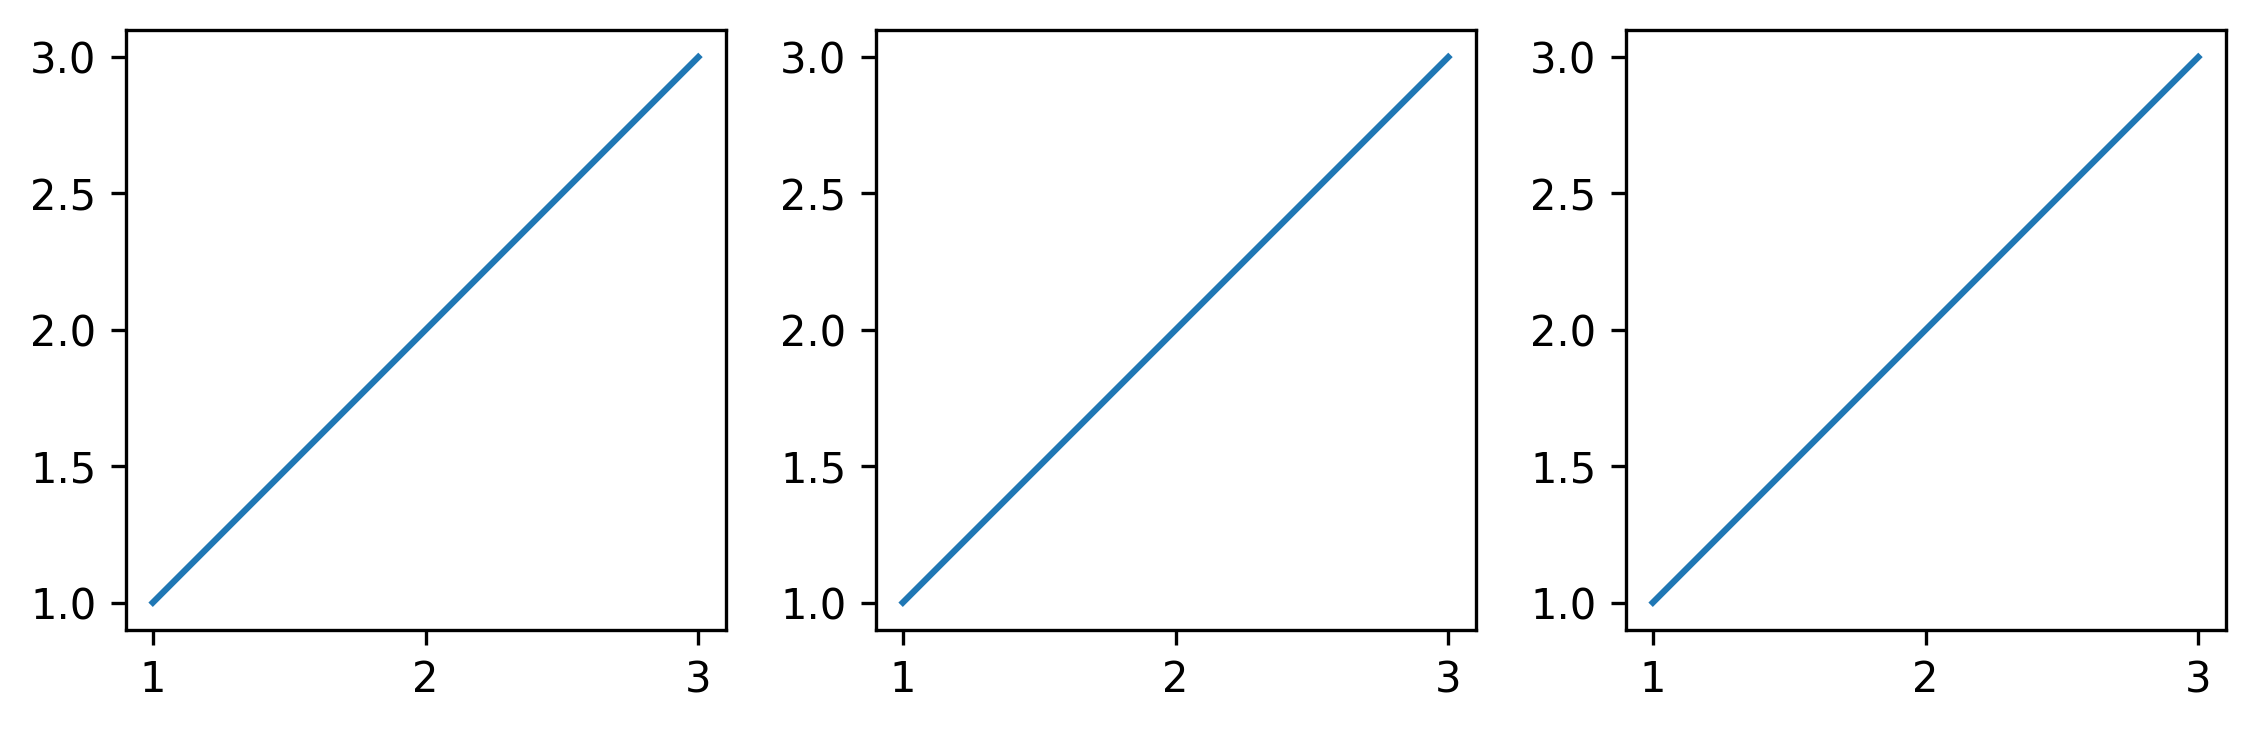
fig = pp.Figure()
ax1 = pp.Panel((2, 2))
ax1.plot([1, 2, 3], [1, 2, 3])
ax1.add_tag("a")

ax2 = pp.Panel((2, 2))
ax2.barh([1, 2, 3], [1, 2, 3])
ax2.add_tag("b")

ax3 = pp.Panel((2, 2))
ax3.scatter([1, 2, 3], [3, 1, 2])
ax3.add_tag("c")

ax4 = pp.Panel((2, 2))
ax4.matshow([[1, 2], [3, 4]])
ax4.add_tag("d")

title = pp.Title("Nice Hello")
legend = pp.Panel((None, 0.5))
legend.axis("off")

fig.main = title / (ax1 | ax2) / (ax3 | ax4) / legend
fig.display()
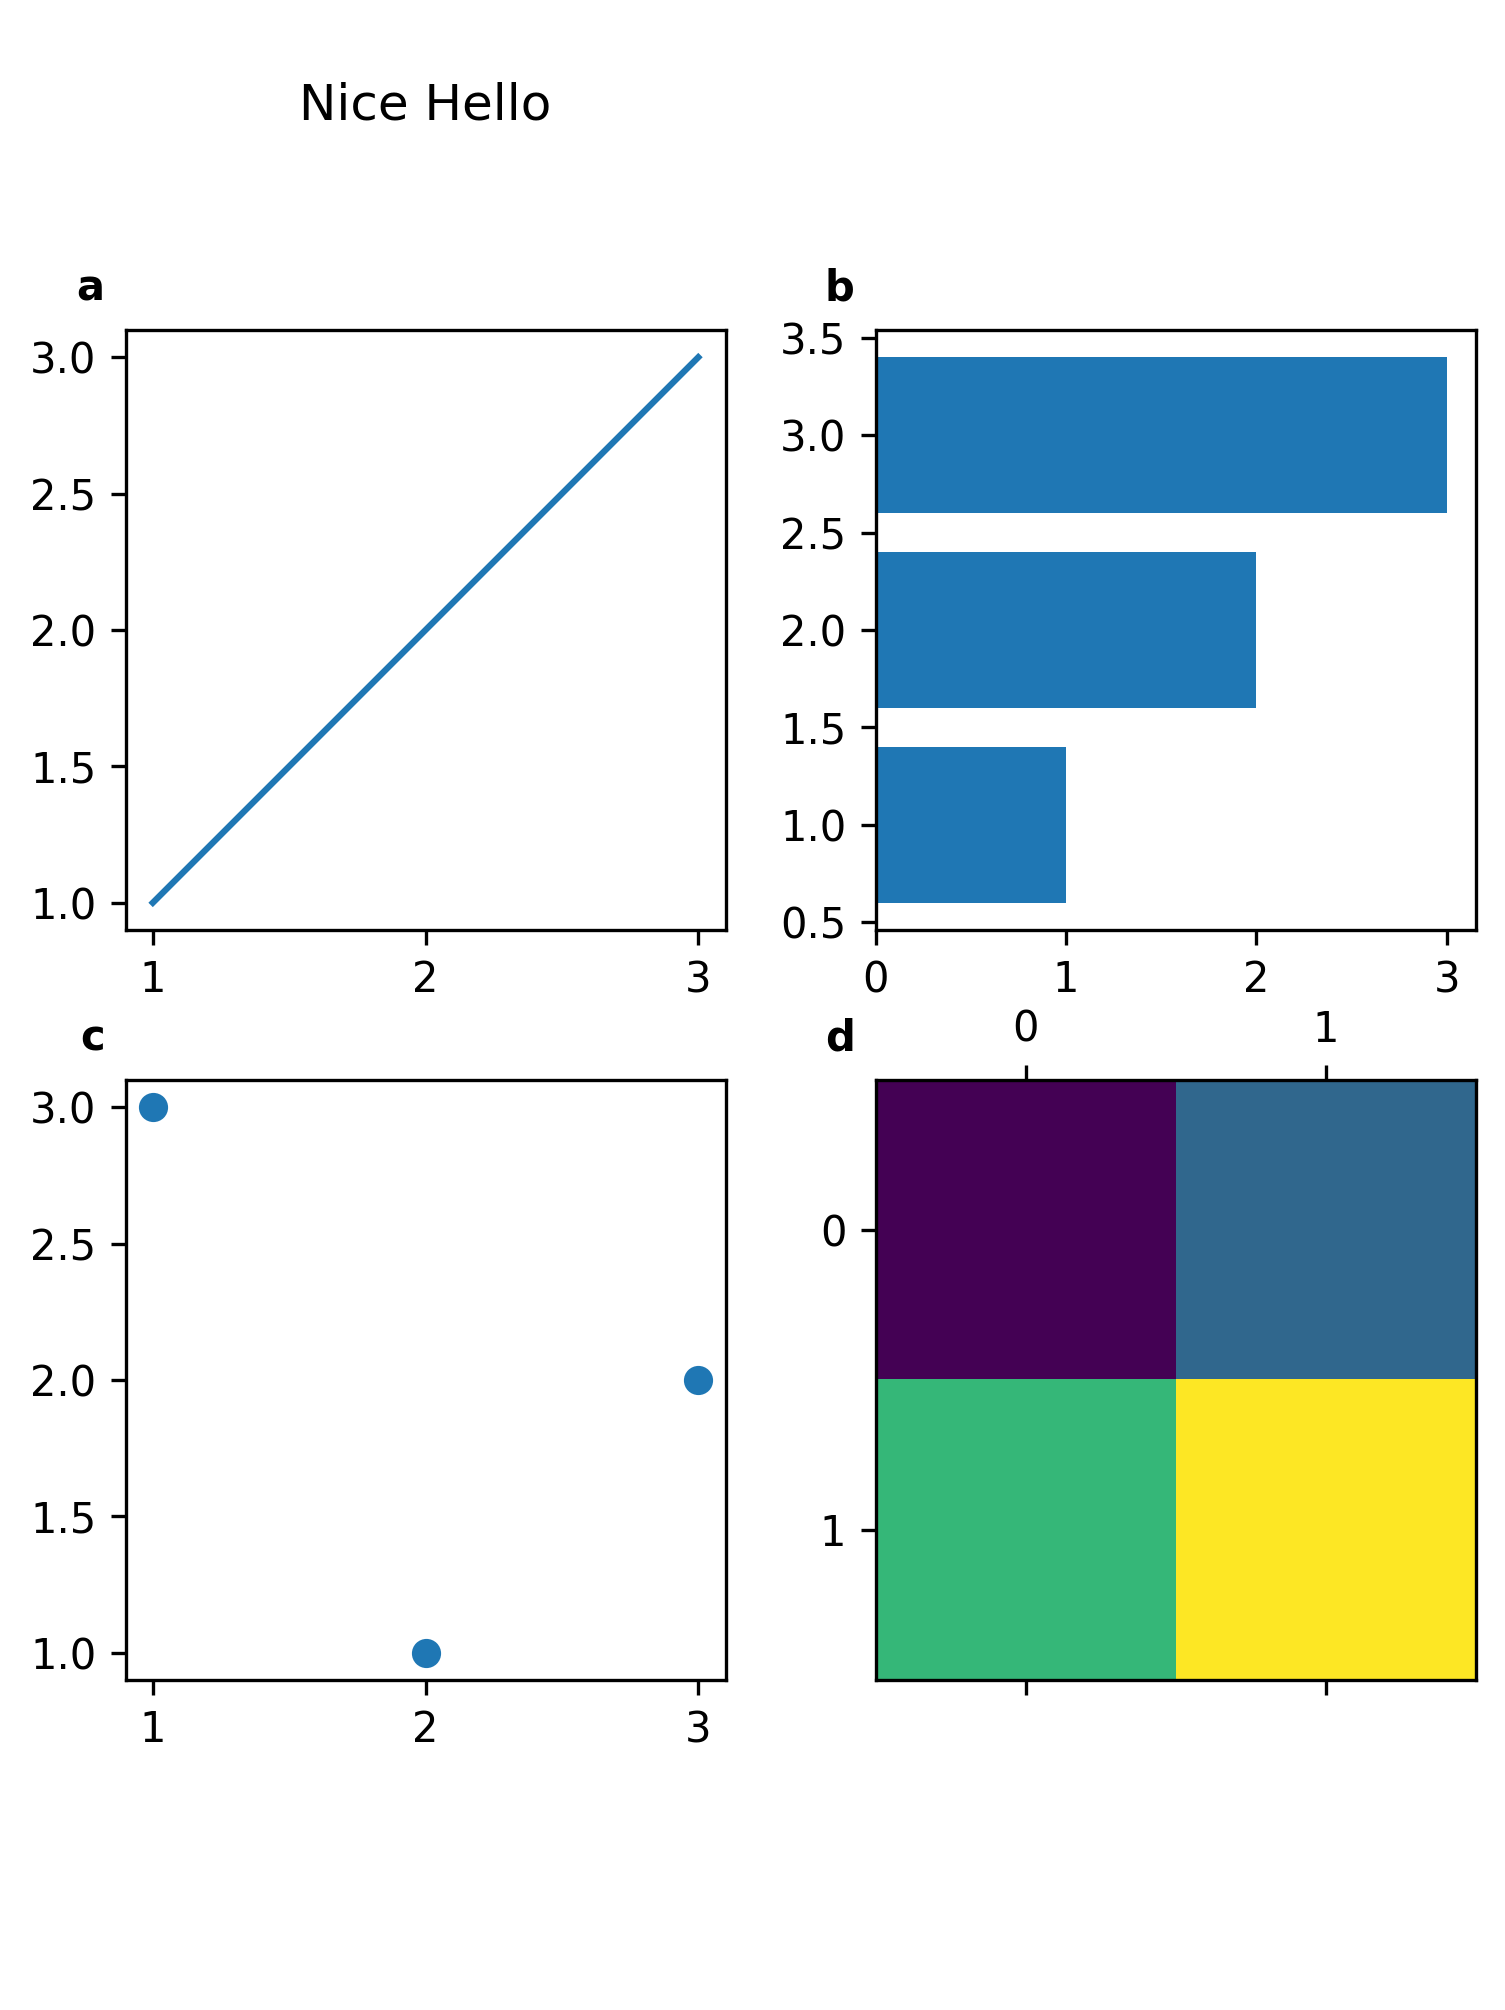
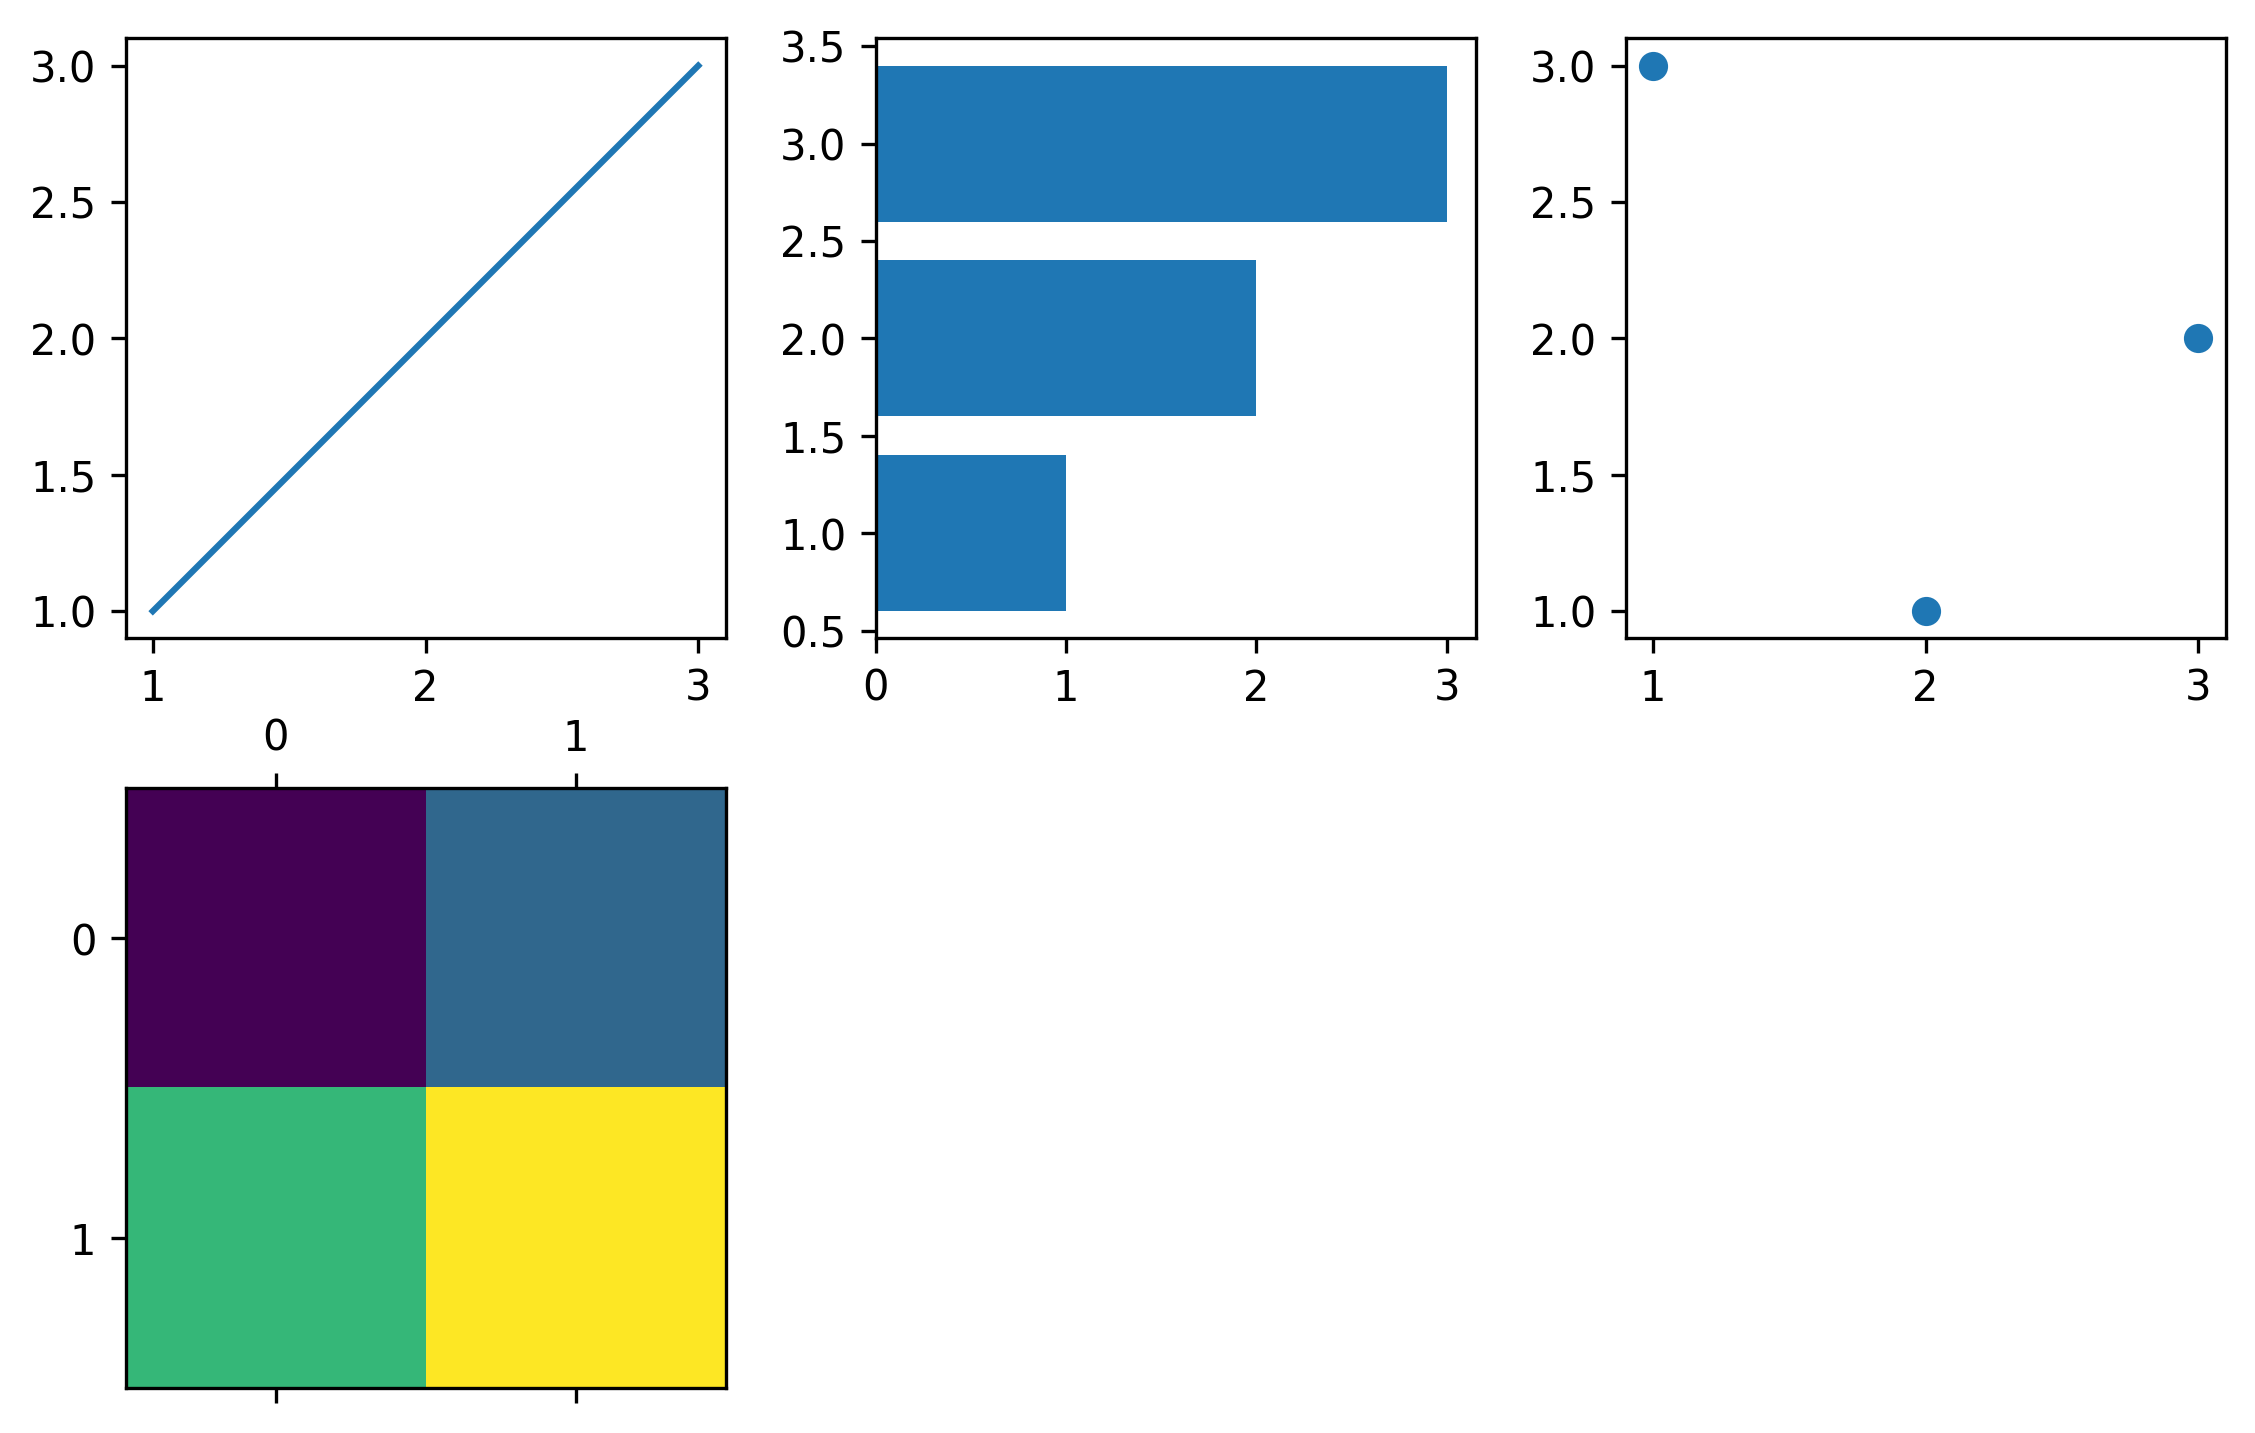
fig = pp.Figure()
axes = []

ax1 = pp.Panel((2, 2))
ax1.plot([1, 2, 3], [1, 2, 3])
axes.append(ax1)

ax2 = pp.Panel((2, 2))
ax2.barh([1, 2, 3], [1, 2, 3])
axes.append(ax2)

ax3 = pp.Panel((2, 2))
ax3.scatter([1, 2, 3], [3, 1, 2])
axes.append(ax3)

ax4 = pp.Panel((2, 2))
ax4.matshow([[1, 2], [3, 4]])
axes.append(ax4)

fig.main = pp.Wrap(axes, ncol = 3)
fig.display()
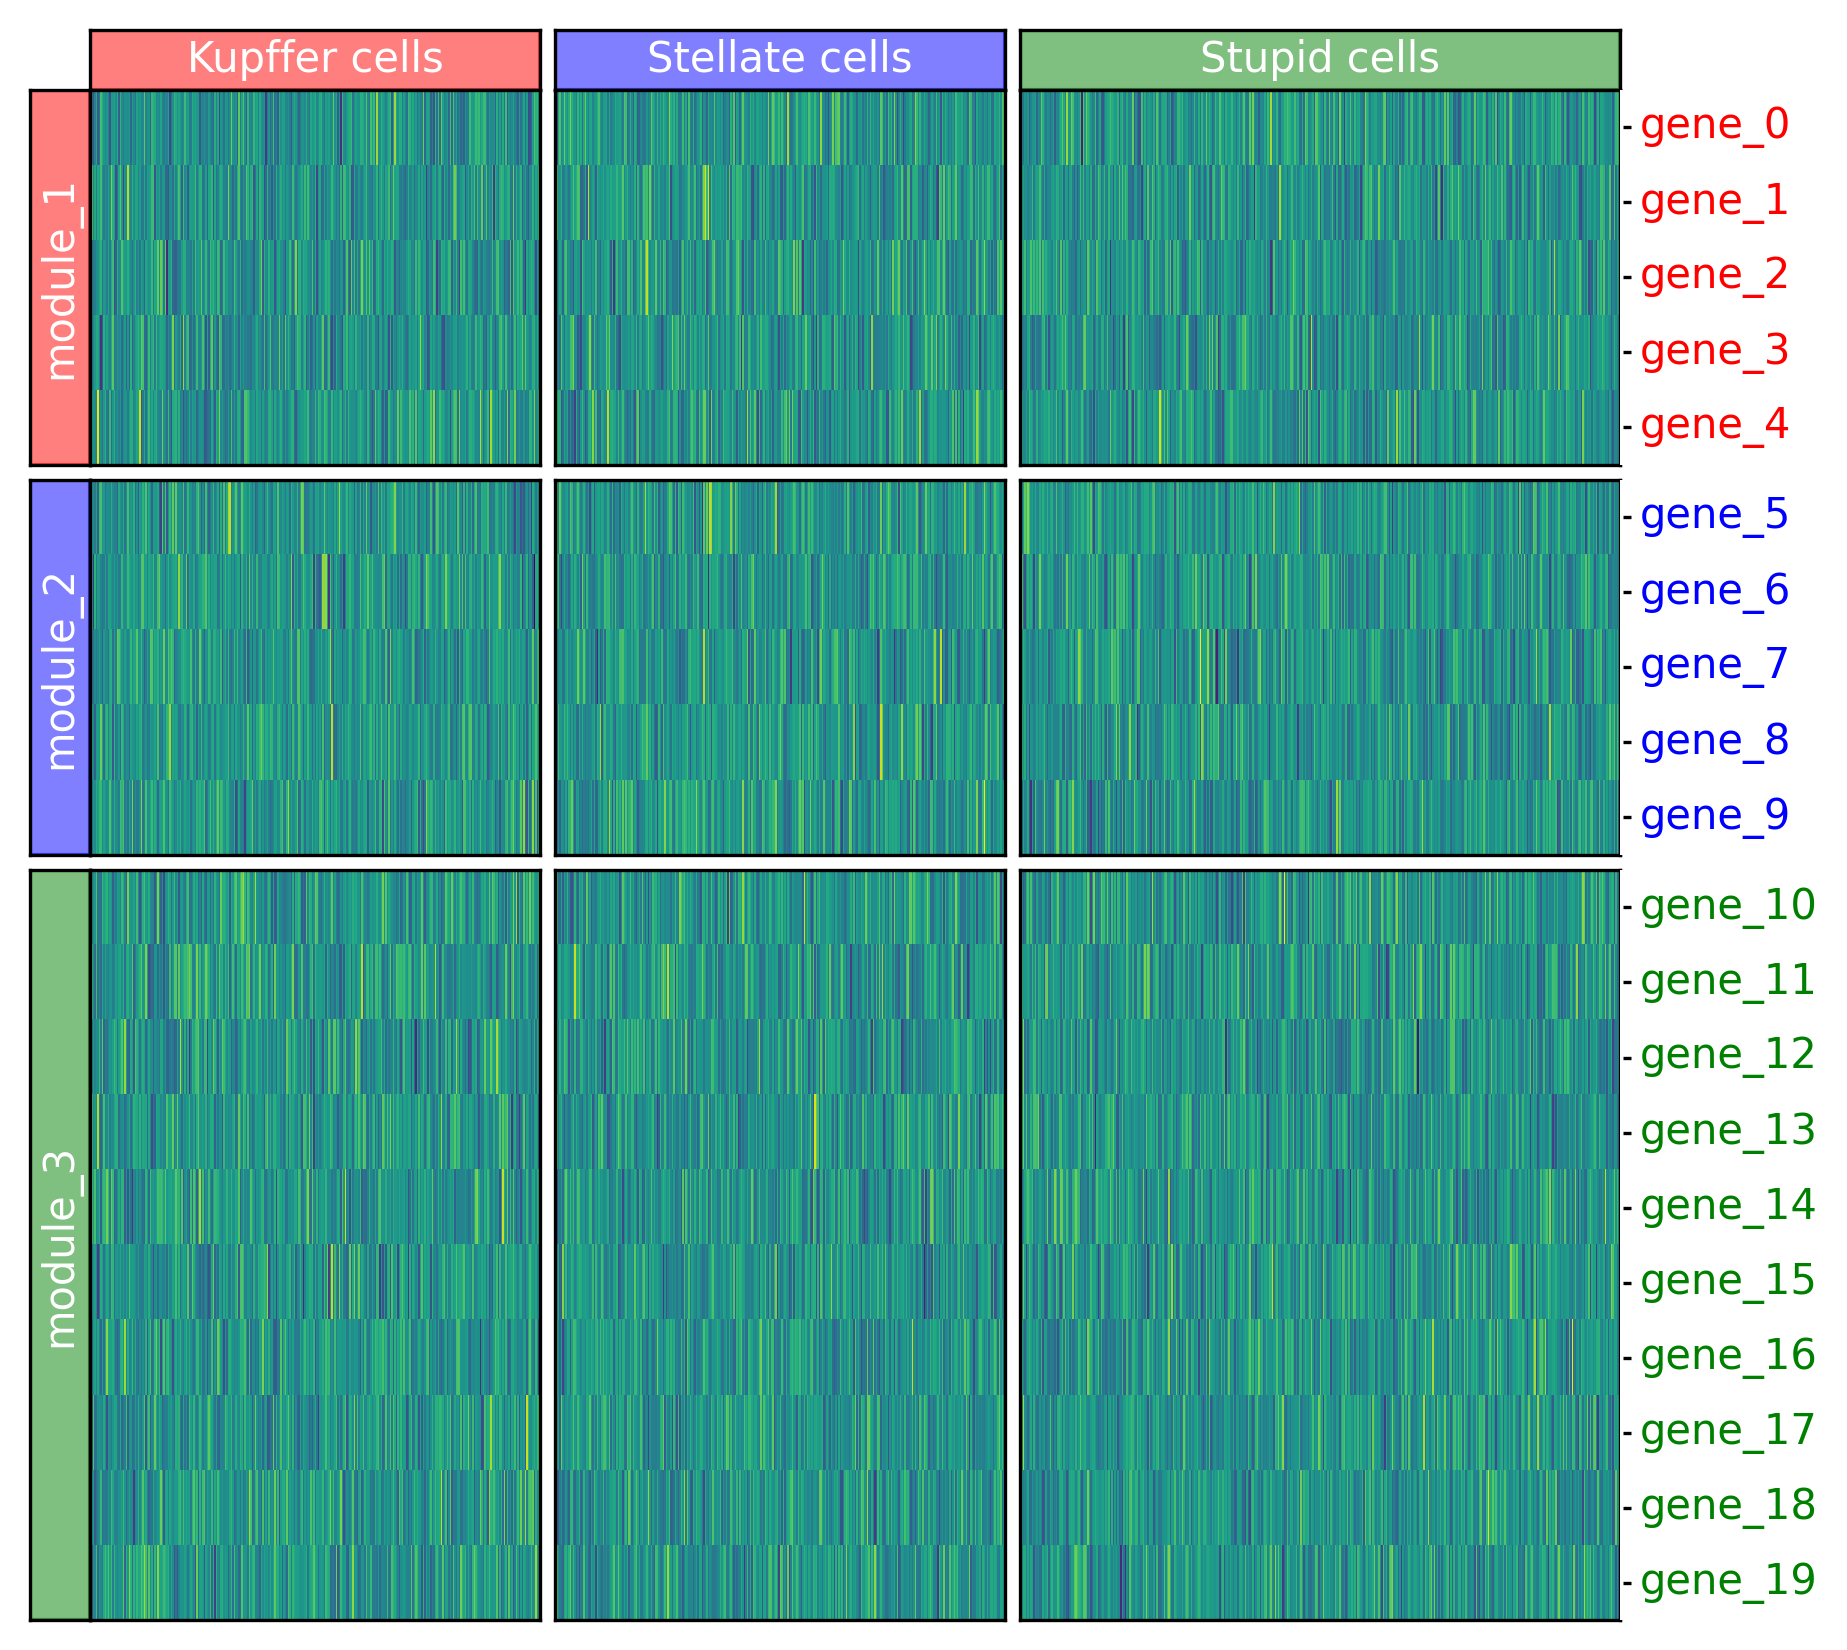
import pandas as pd
import numpy as np
data = pd.DataFrame(np.random.randn(1000, 20))
obs = pd.DataFrame({
    "celltype":["Kupffer cells"] * 300 + ["Stellate cells"] * 300 + ["Stupid cells"] * 400
})
celltypes = pd.DataFrame.from_dict({
    "Kupffer cells": {"color": "red"},
    "Stellate cells": {"color": "blue"},
    "Stupid cells": {"color": "green"}
}, orient = "index")
var = pd.DataFrame(index = [f"gene_{i}" for i in range(20)])
var["module"] = ["module_1"] * 5 + ["module_2"] * 5 + ["module_3"] * 10
data.columns = var.index
modules = pd.DataFrame({
    "module":["module_1", "module_2", "module_3"],
    "color":["red", "blue", "green"]
}).set_index("module")
var["color"] = modules.loc[var["module"]]["color"].values
fig = pp.Figure(pp.Grid(padding_height = 0., padding_width = 0.))

row_layout = pp.heatmap.layouts.Broken(var["module"].astype("category"))
col_layout = pp.heatmap.layouts.Broken(obs["celltype"].astype("category"))

main_heatmap = fig.main.add(pp.heatmap.Heatmap(data, row_layout = row_layout, col_layout = col_layout))
heading = fig.main.add_above(pp.heatmap.heading.HeadingTop(obs, celltypes, col_layout))

ticks = fig.main.add_left(pp.heatmap.ticks.TicksLeft(var, row_layout), row = main_heatmap)
heading = fig.main.add_right(pp.heatmap.heading.HeadingRight(var, modules, row_layout), row = main_heatmap)

fig.display()
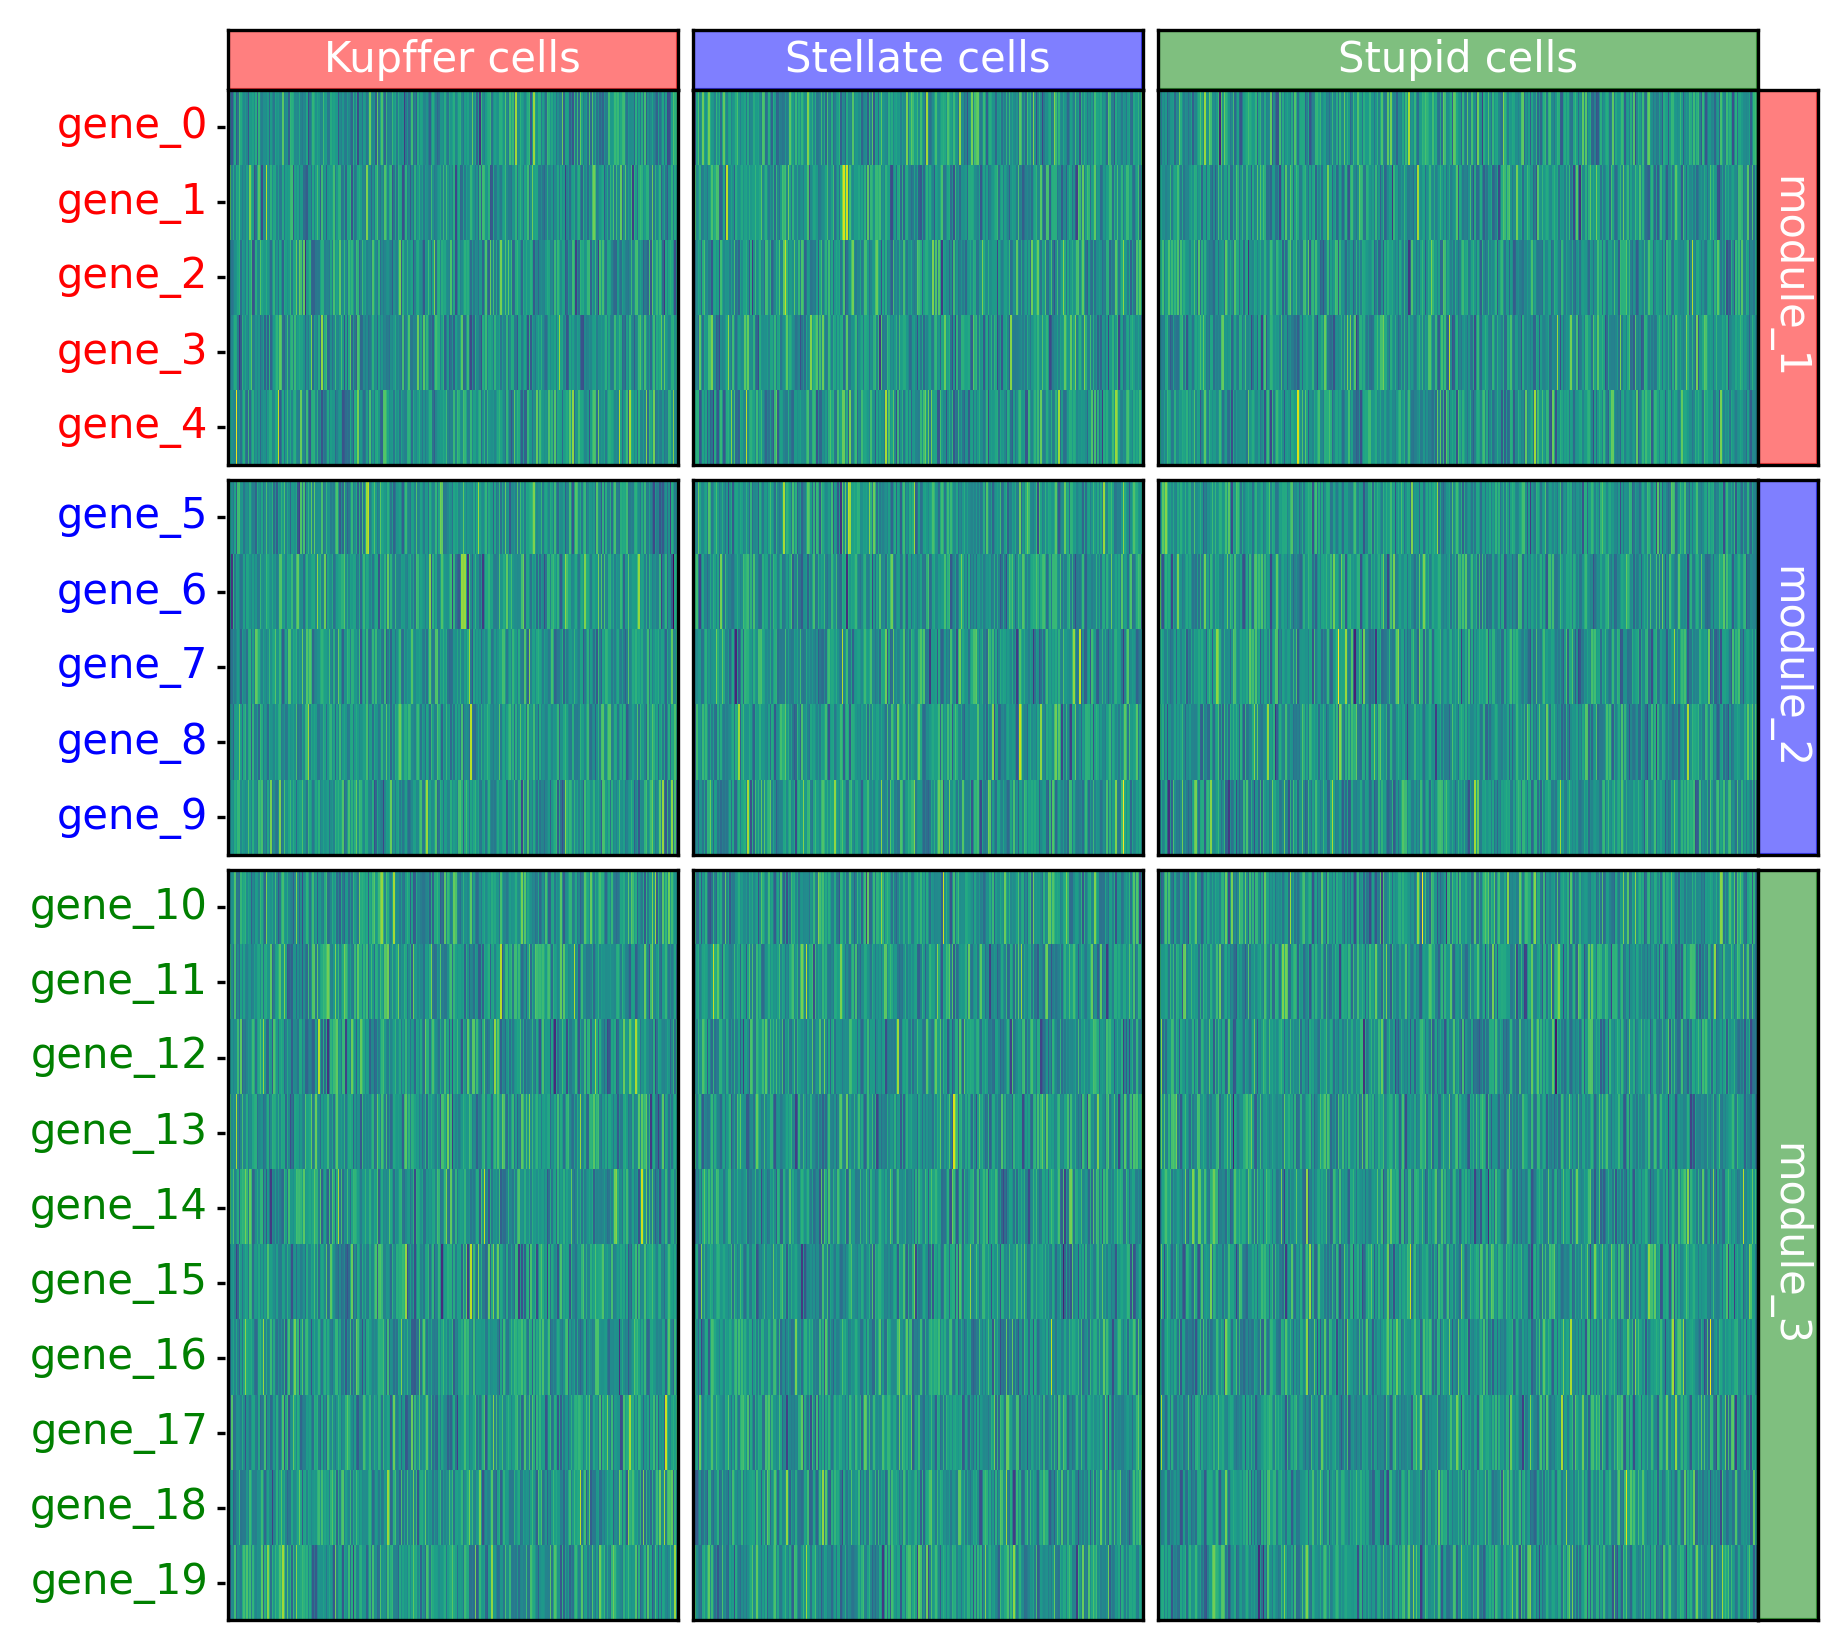
fig = pp.Figure(pp.Grid(padding_height = 0., padding_width = 0.))

row_layout = pp.heatmap.layouts.Broken(var["module"].astype("category"))
col_layout = pp.heatmap.layouts.Broken(obs["celltype"].astype("category"))

main_heatmap = fig.main.add(pp.heatmap.Heatmap(data, row_layout = row_layout, col_layout = col_layout))
heading = fig.main.add_above(pp.heatmap.heading.HeadingTop(obs, celltypes, col_layout))

ticks = fig.main.add_right(pp.heatmap.ticks.TicksRight(var, row_layout), row = main_heatmap)
heading = fig.main.add_left(pp.heatmap.heading.HeadingLeft(var, modules, row_layout), row = main_heatmap)

fig.display()
Release history Release notifications | RSS feed


Download files
Download the file for your platform. If you're not sure which to choose, learn more about installing packages.
Source Distribution
polyptich-0.0.19.tar.gz
(1.1 MB
view details)
File details
Details for the file polyptich-0.0.19.tar.gz.
File metadata
- Download URL: polyptich-0.0.19.tar.gz
- Upload date:
- Size: 1.1 MB
- Tags: Source
- Uploaded using Trusted Publishing? No
- Uploaded via: twine/6.1.0 CPython/3.12.2
File hashes
| Algorithm | Hash digest | |
|---|---|---|
| SHA256 |
3f0404d999bca15528ca3c83ba9e51d59c8711f2d8089d8b1136ea66e06bb677
|
|
| MD5 |
aea36bfd4a2b98ac80209d35210bce9f
|
|
| BLAKE2b-256 |
7282d24554c7ec1614818a8c5493c12dc17311f210785bf6217979c79dc84ae3
|


