Tiled grid maps for Python — land area and population cartograms

Project description
popgrid
Tiled grid maps for Python, land area and population, clearly explained.


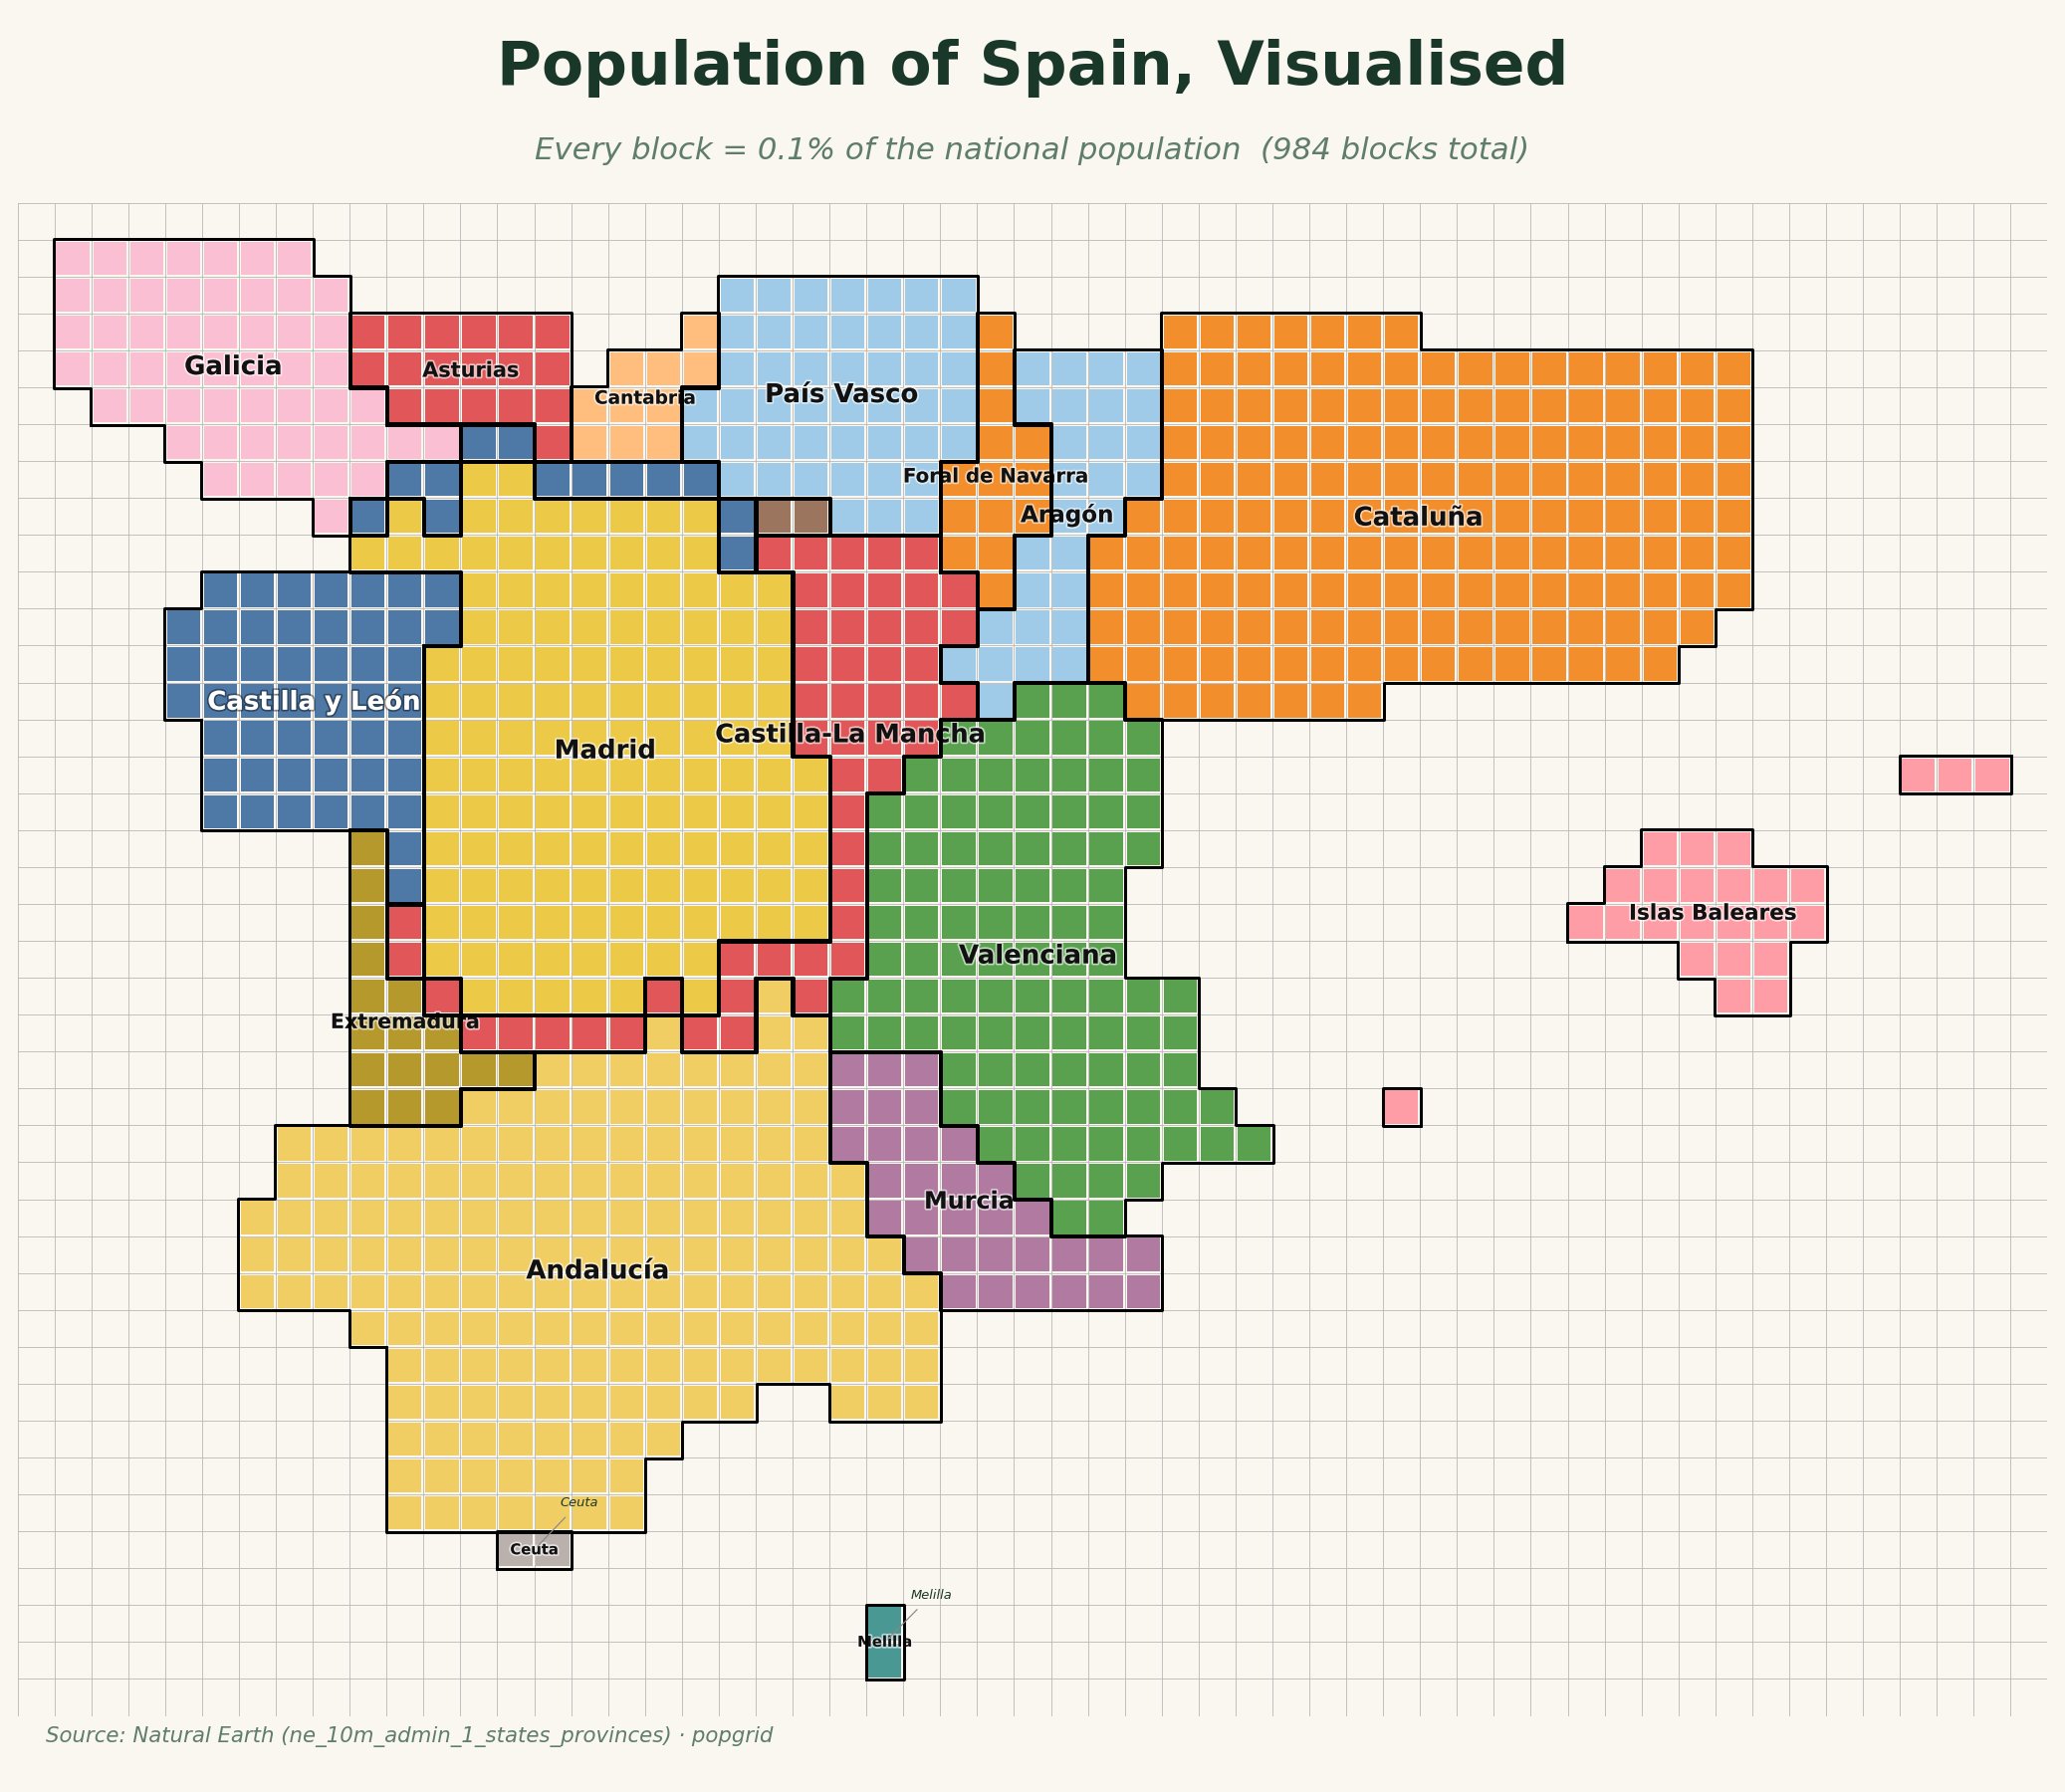
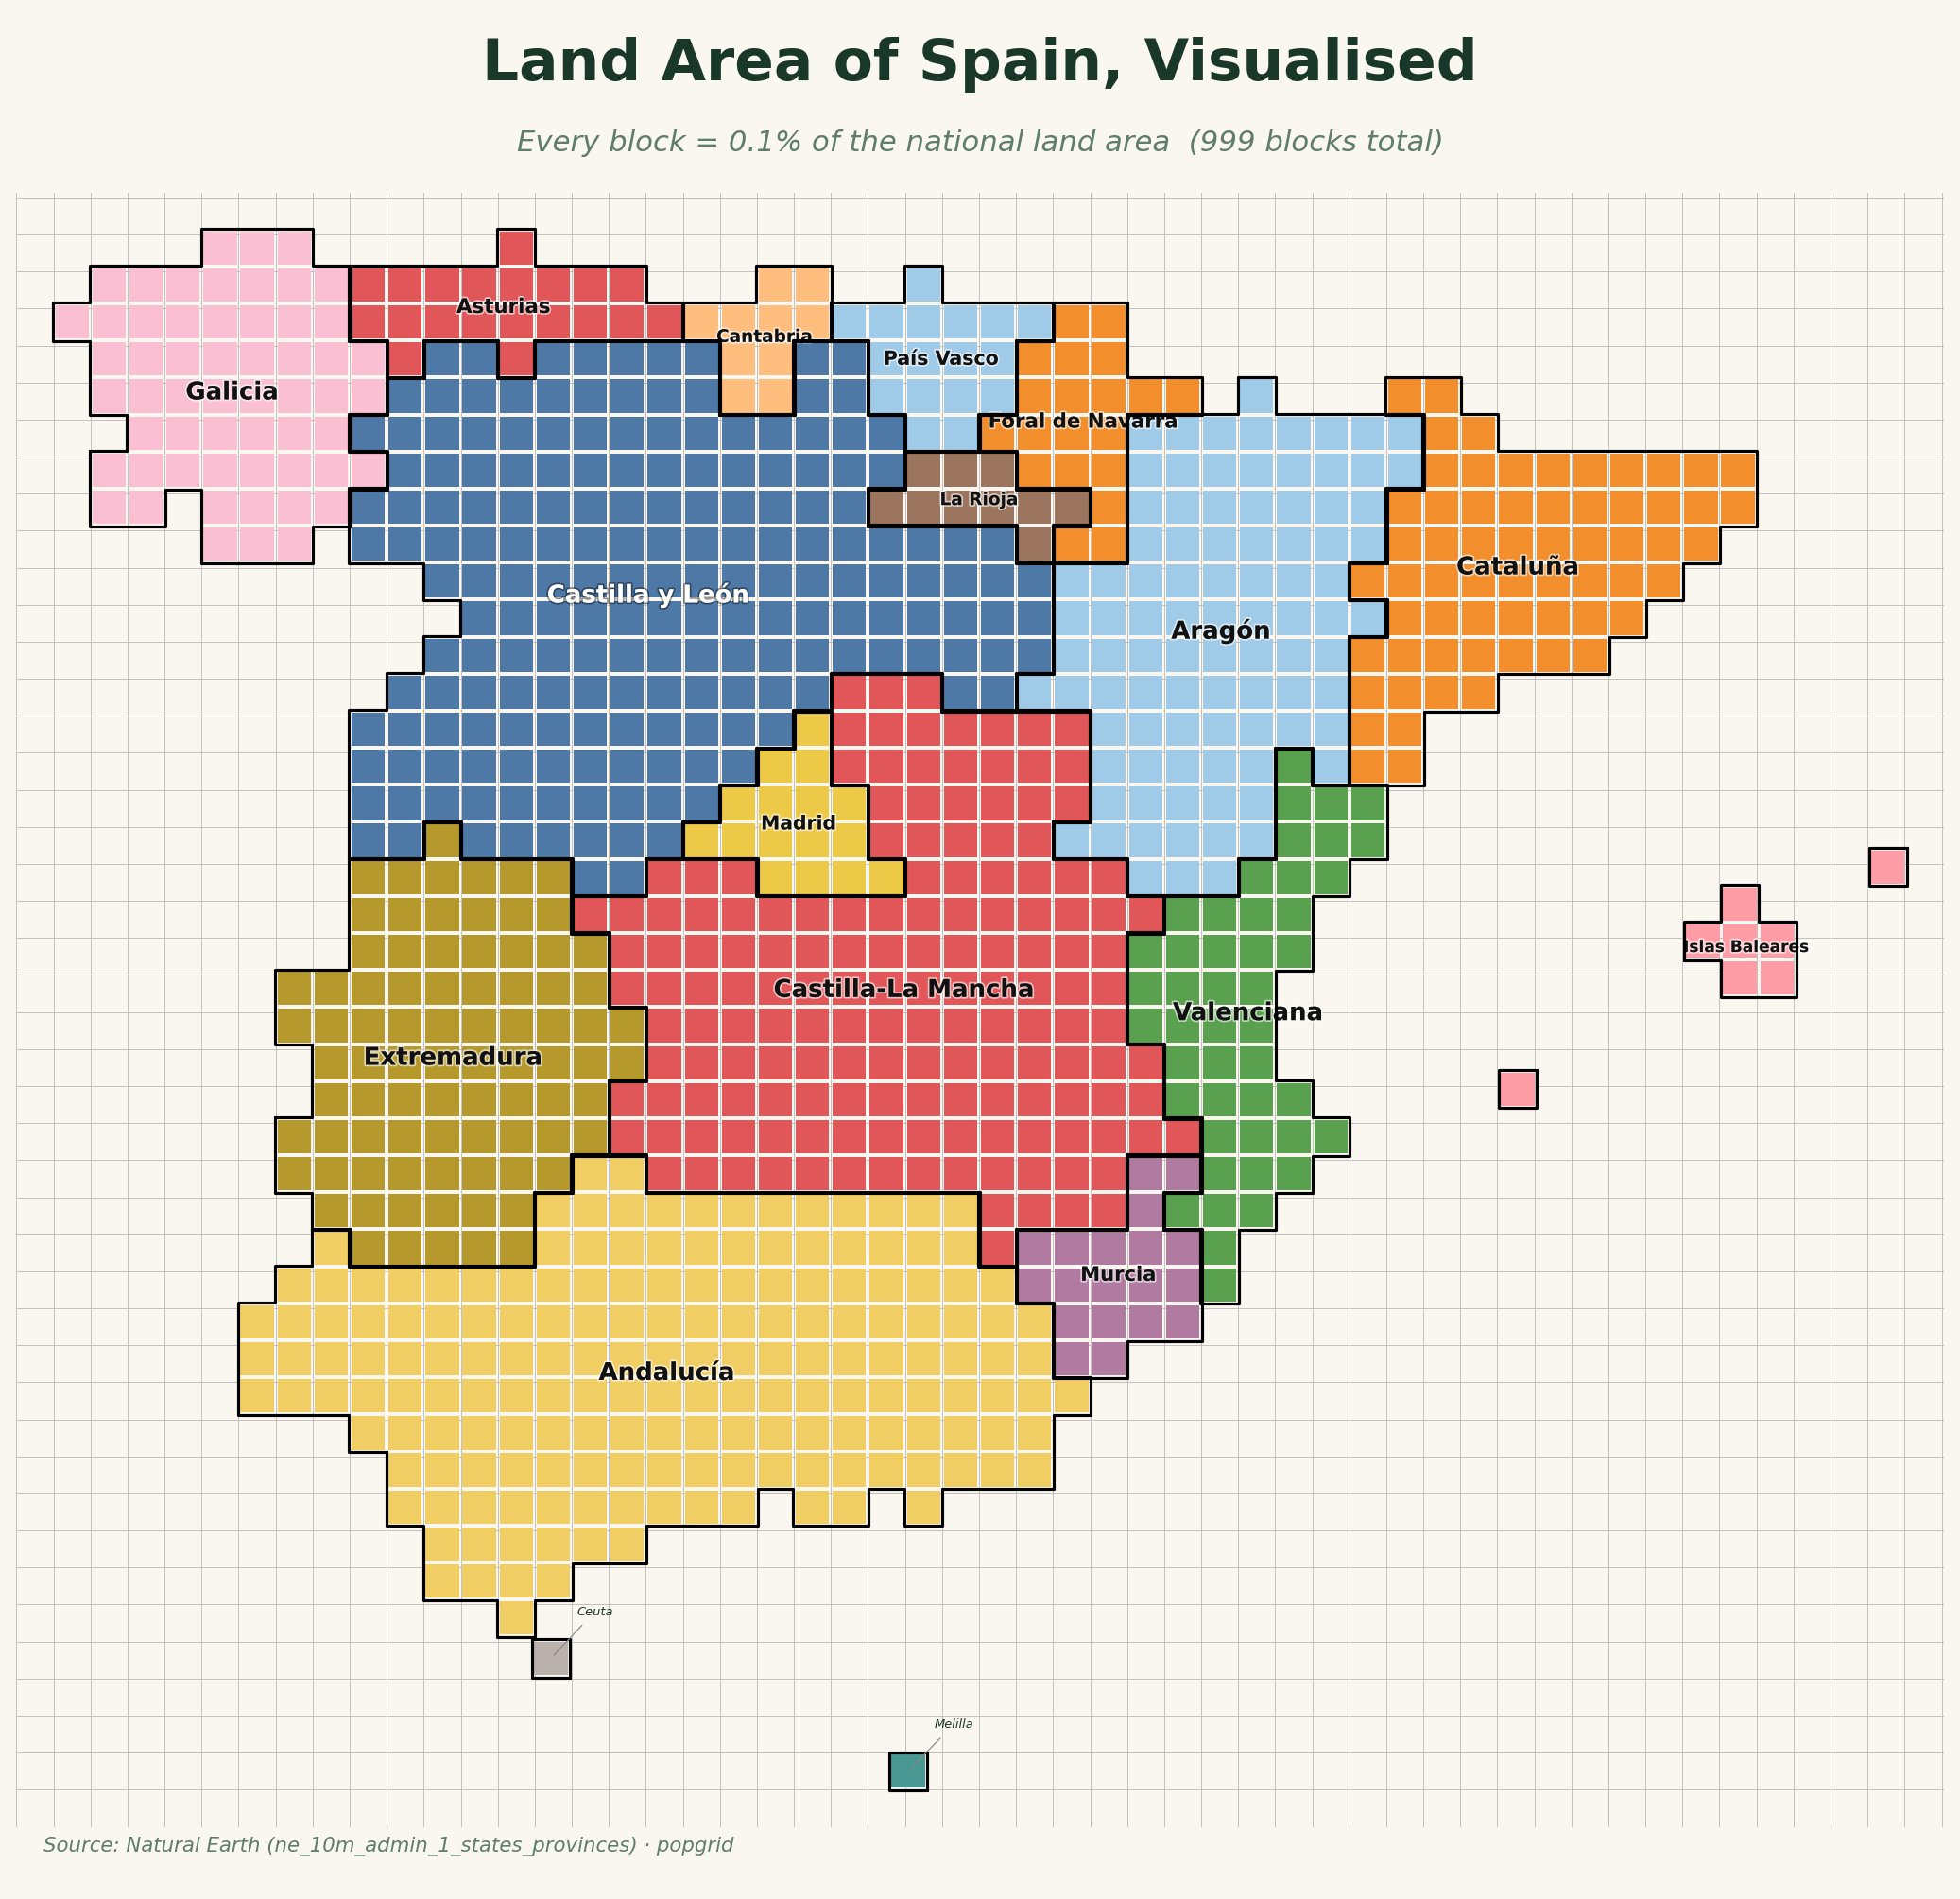
popgrid turns a country (or any set of regions) into a block cartogram where every block is an equal share of the whole: 0.1% of the national land area, or 0.1% of the population. Same regions, same colours, two ways of seeing them. Where land and people diverge is the whole point.
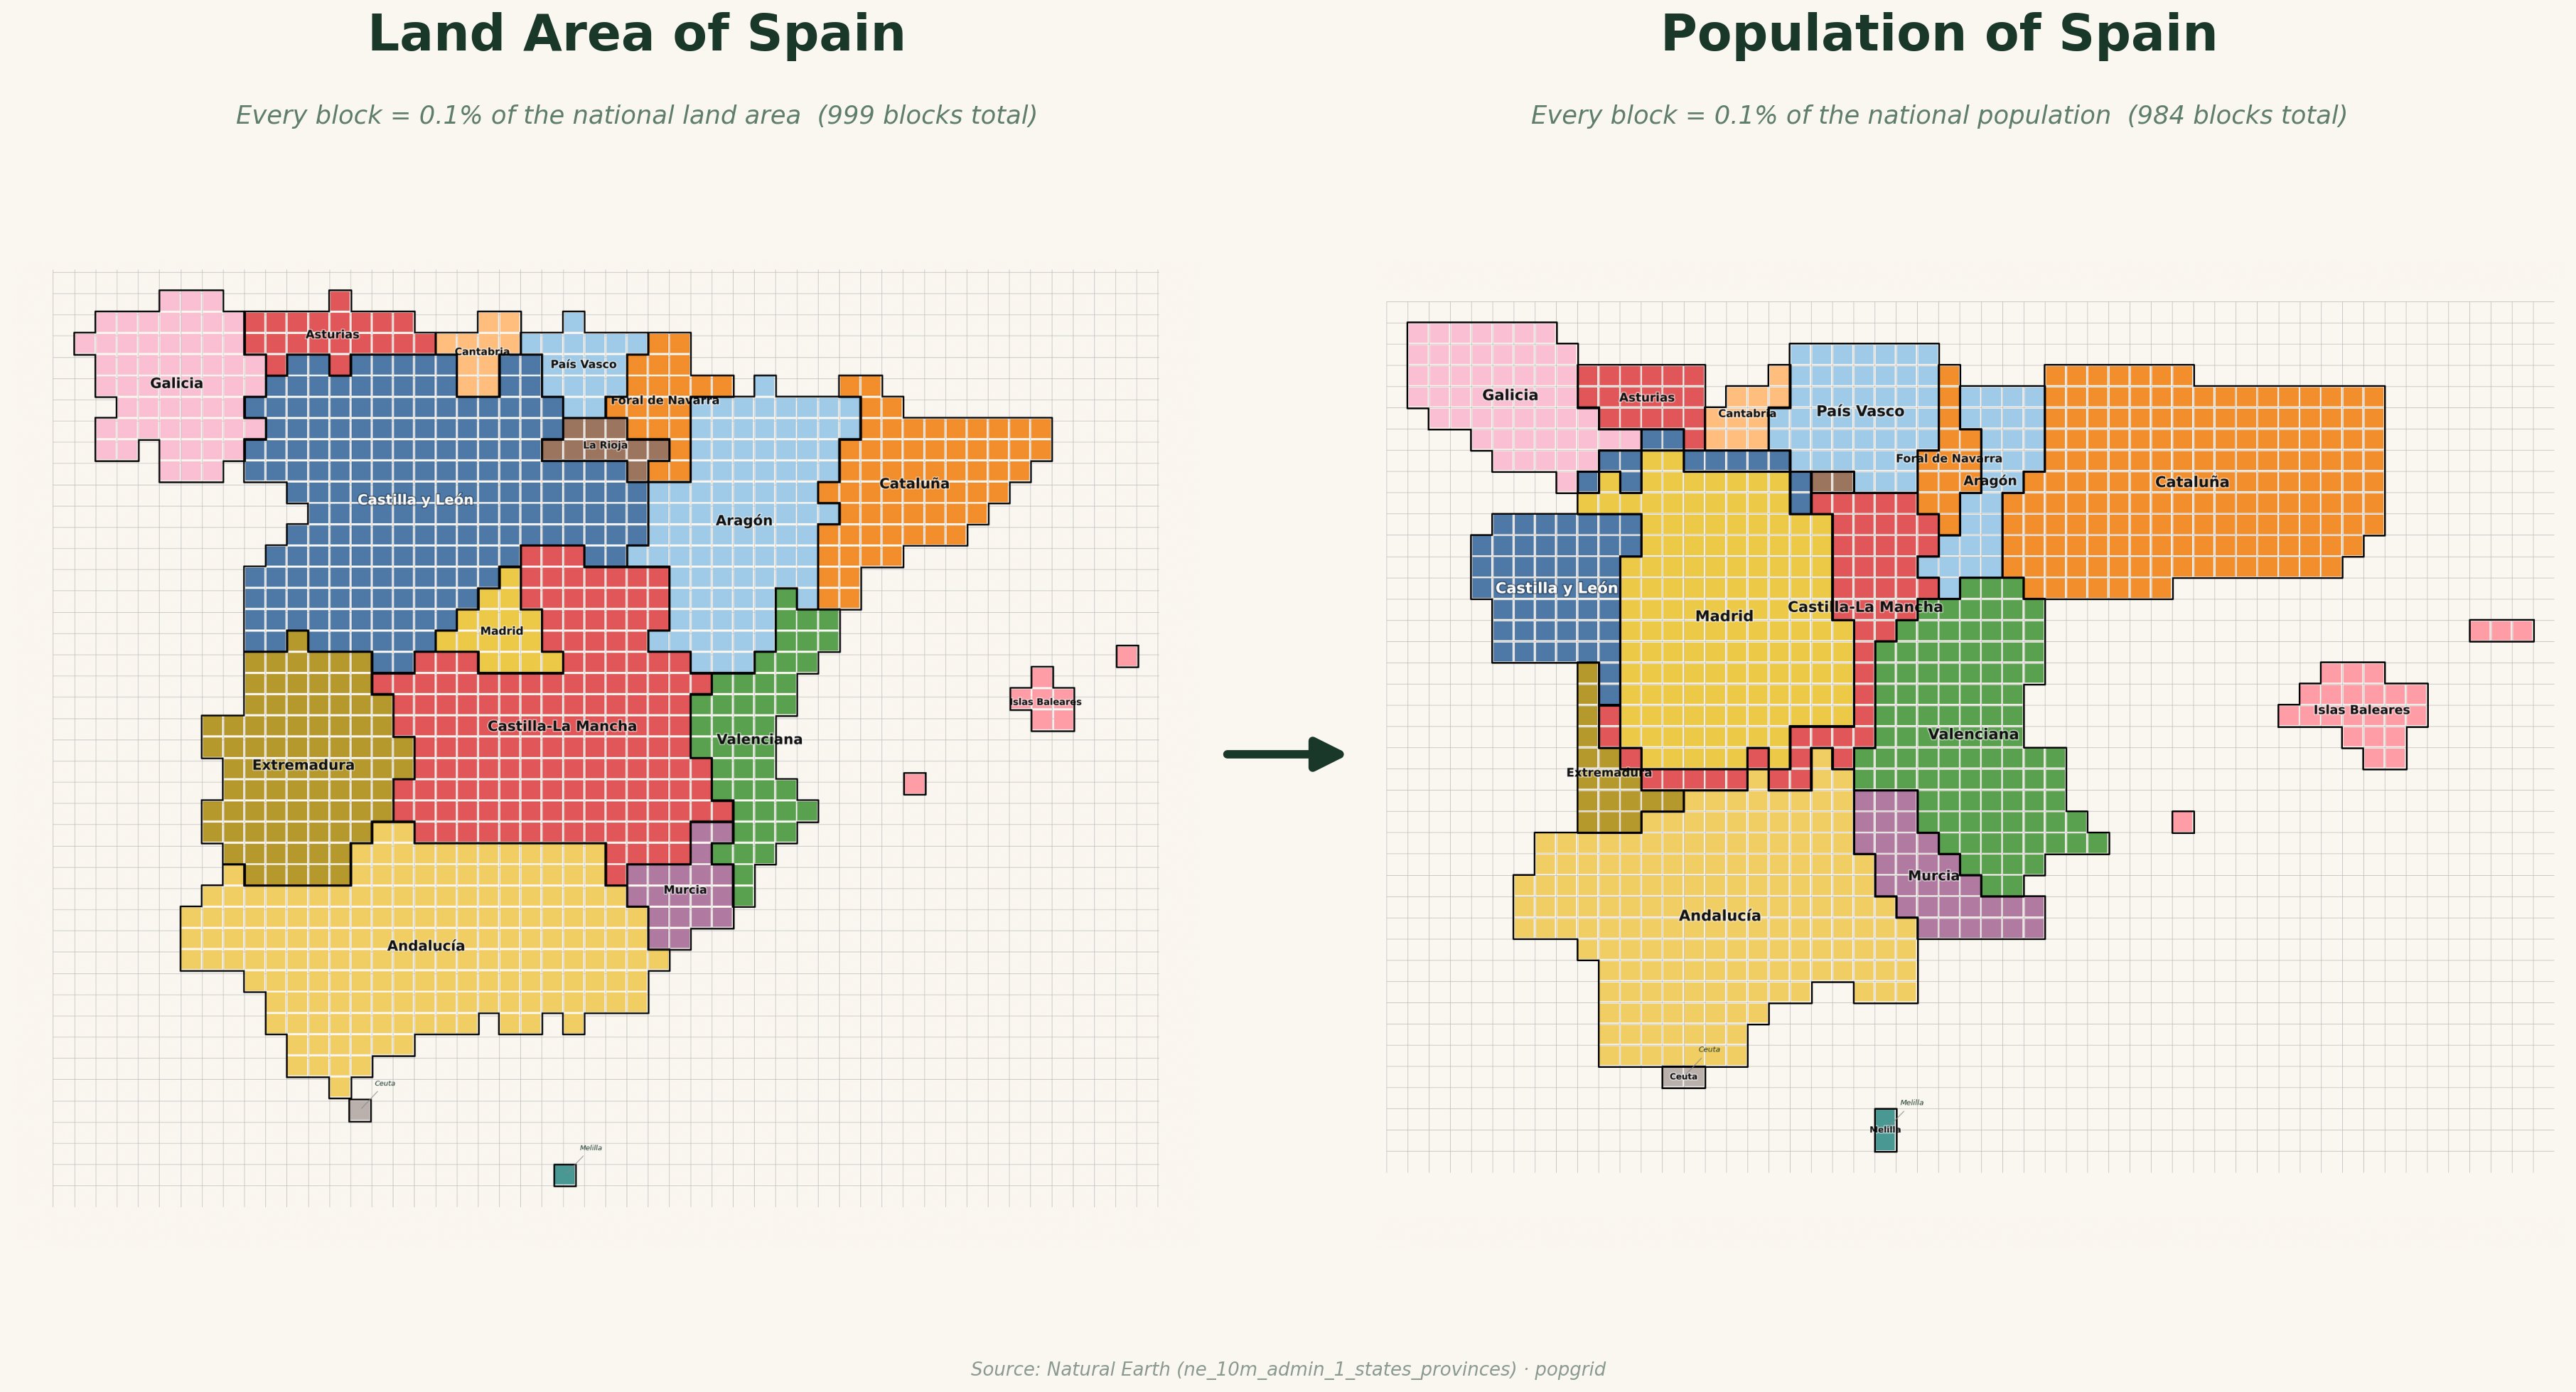
Madrid is a sliver of land and a giant of population. The empty interior shrinks; the coasts and the capital swell. A block on the left is the same size as a block on the right, so the comparison is literally true.
Install
pip install popgrid
Requires Python 3.10+. Country boundaries are downloaded once from Natural Earth and cached locally; population data for the bundled countries ships with the package.
Quickstart
from popgrid import PopGrid, AreaGrid

# Population: every block = 0.1% of the national population
PopGrid("ESP").plot().savefig("spain_population.png", dpi=170, bbox_inches="tight")

# Land area: every block = 0.1% of the national land area
AreaGrid("ESP").plot().savefig("spain_area.png", dpi=170, bbox_inches="tight")
| Population | Land area |
|---|---|
 |
 |
.plot() builds the grid on first call and returns a Matplotlib figure, so you can save, show, or restyle it however you like.
Your own data
Both classes accept any GeoDataFrame through from_geodataframe, so popgrid is not limited to the bundled countries. Point it at a shapefile, a GeoJSON, or a PostGIS query.
AreaGrid.from_geodataframe(gdf, region_col=...)sizes each region by its land area.PopGrid.from_geodataframe(gdf, region_col=..., weight_col=...)sizes each region by a numeric column you supply, such as population.
import geopandas as gpd
from popgrid import AreaGrid, PopGrid
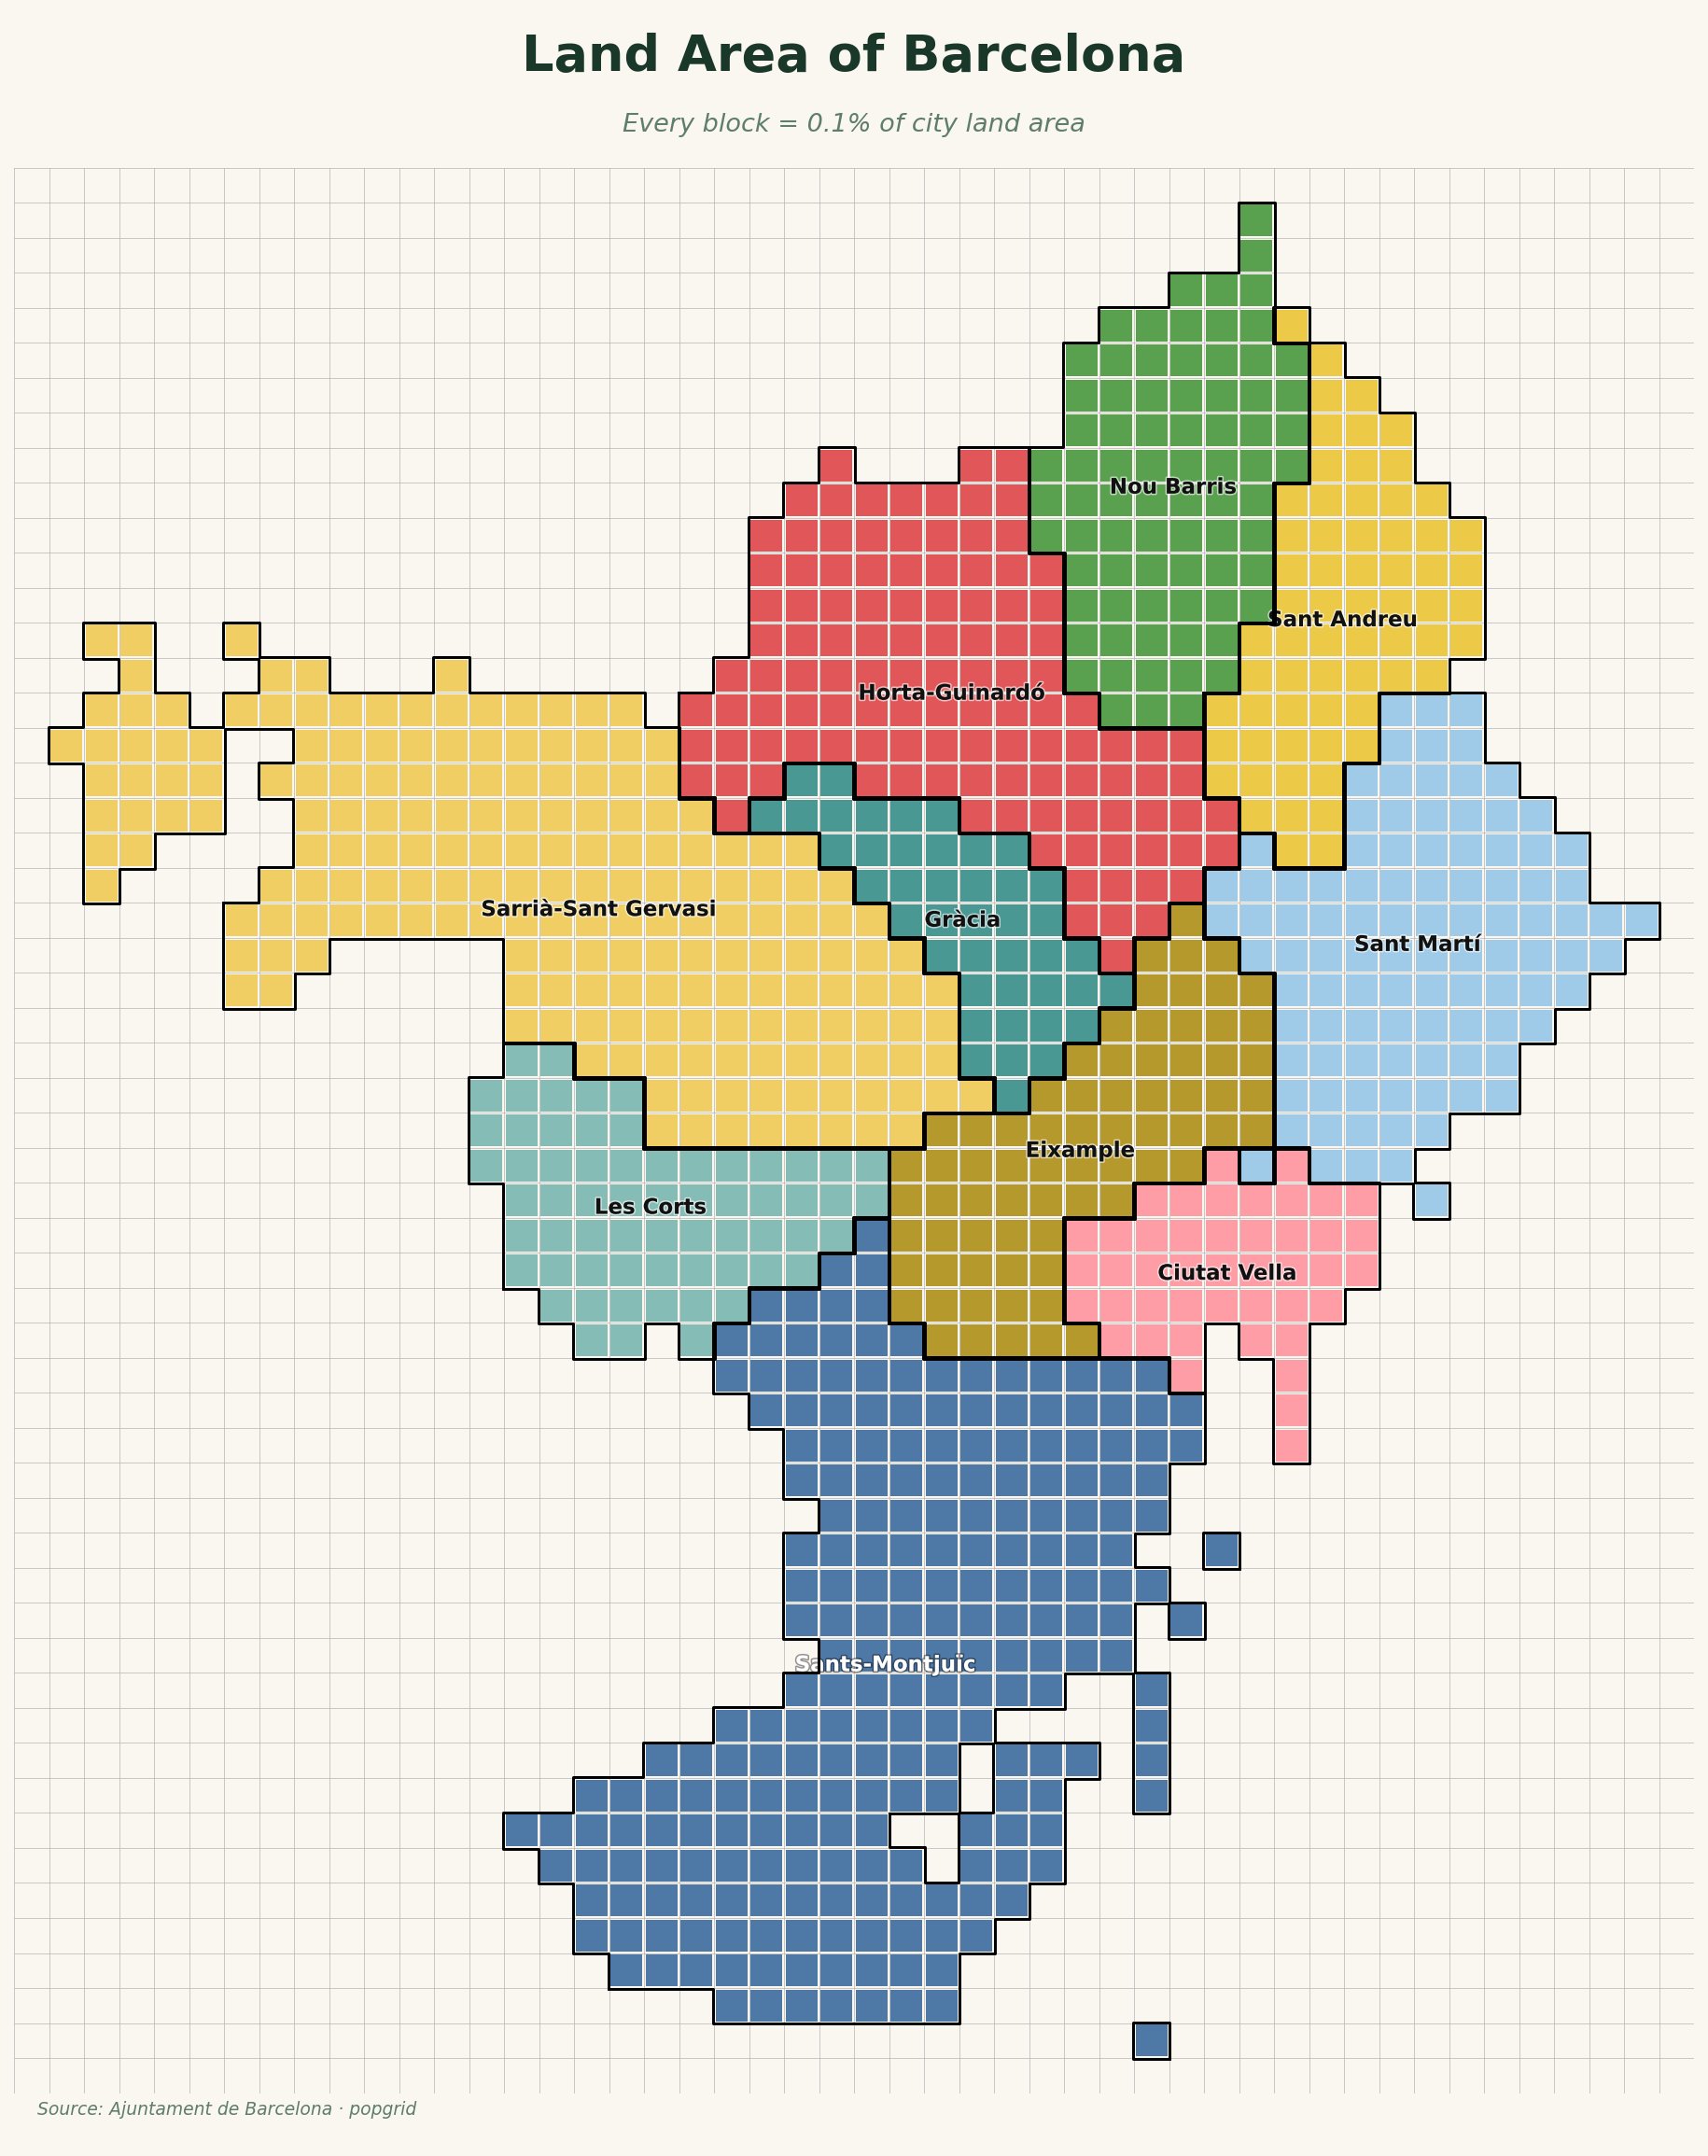
gdf = gpd.read_file("examples/data/barcelona_districts.geojson")
# Sized by district land area
AreaGrid.from_geodataframe(gdf, region_col="district").plot(
title="Land Area of Barcelona",
subtitle="Every block = 0.1% of city land area",
)
# Sized by your own population column
PopGrid.from_geodataframe(gdf, region_col="district", weight_col="population").plot(
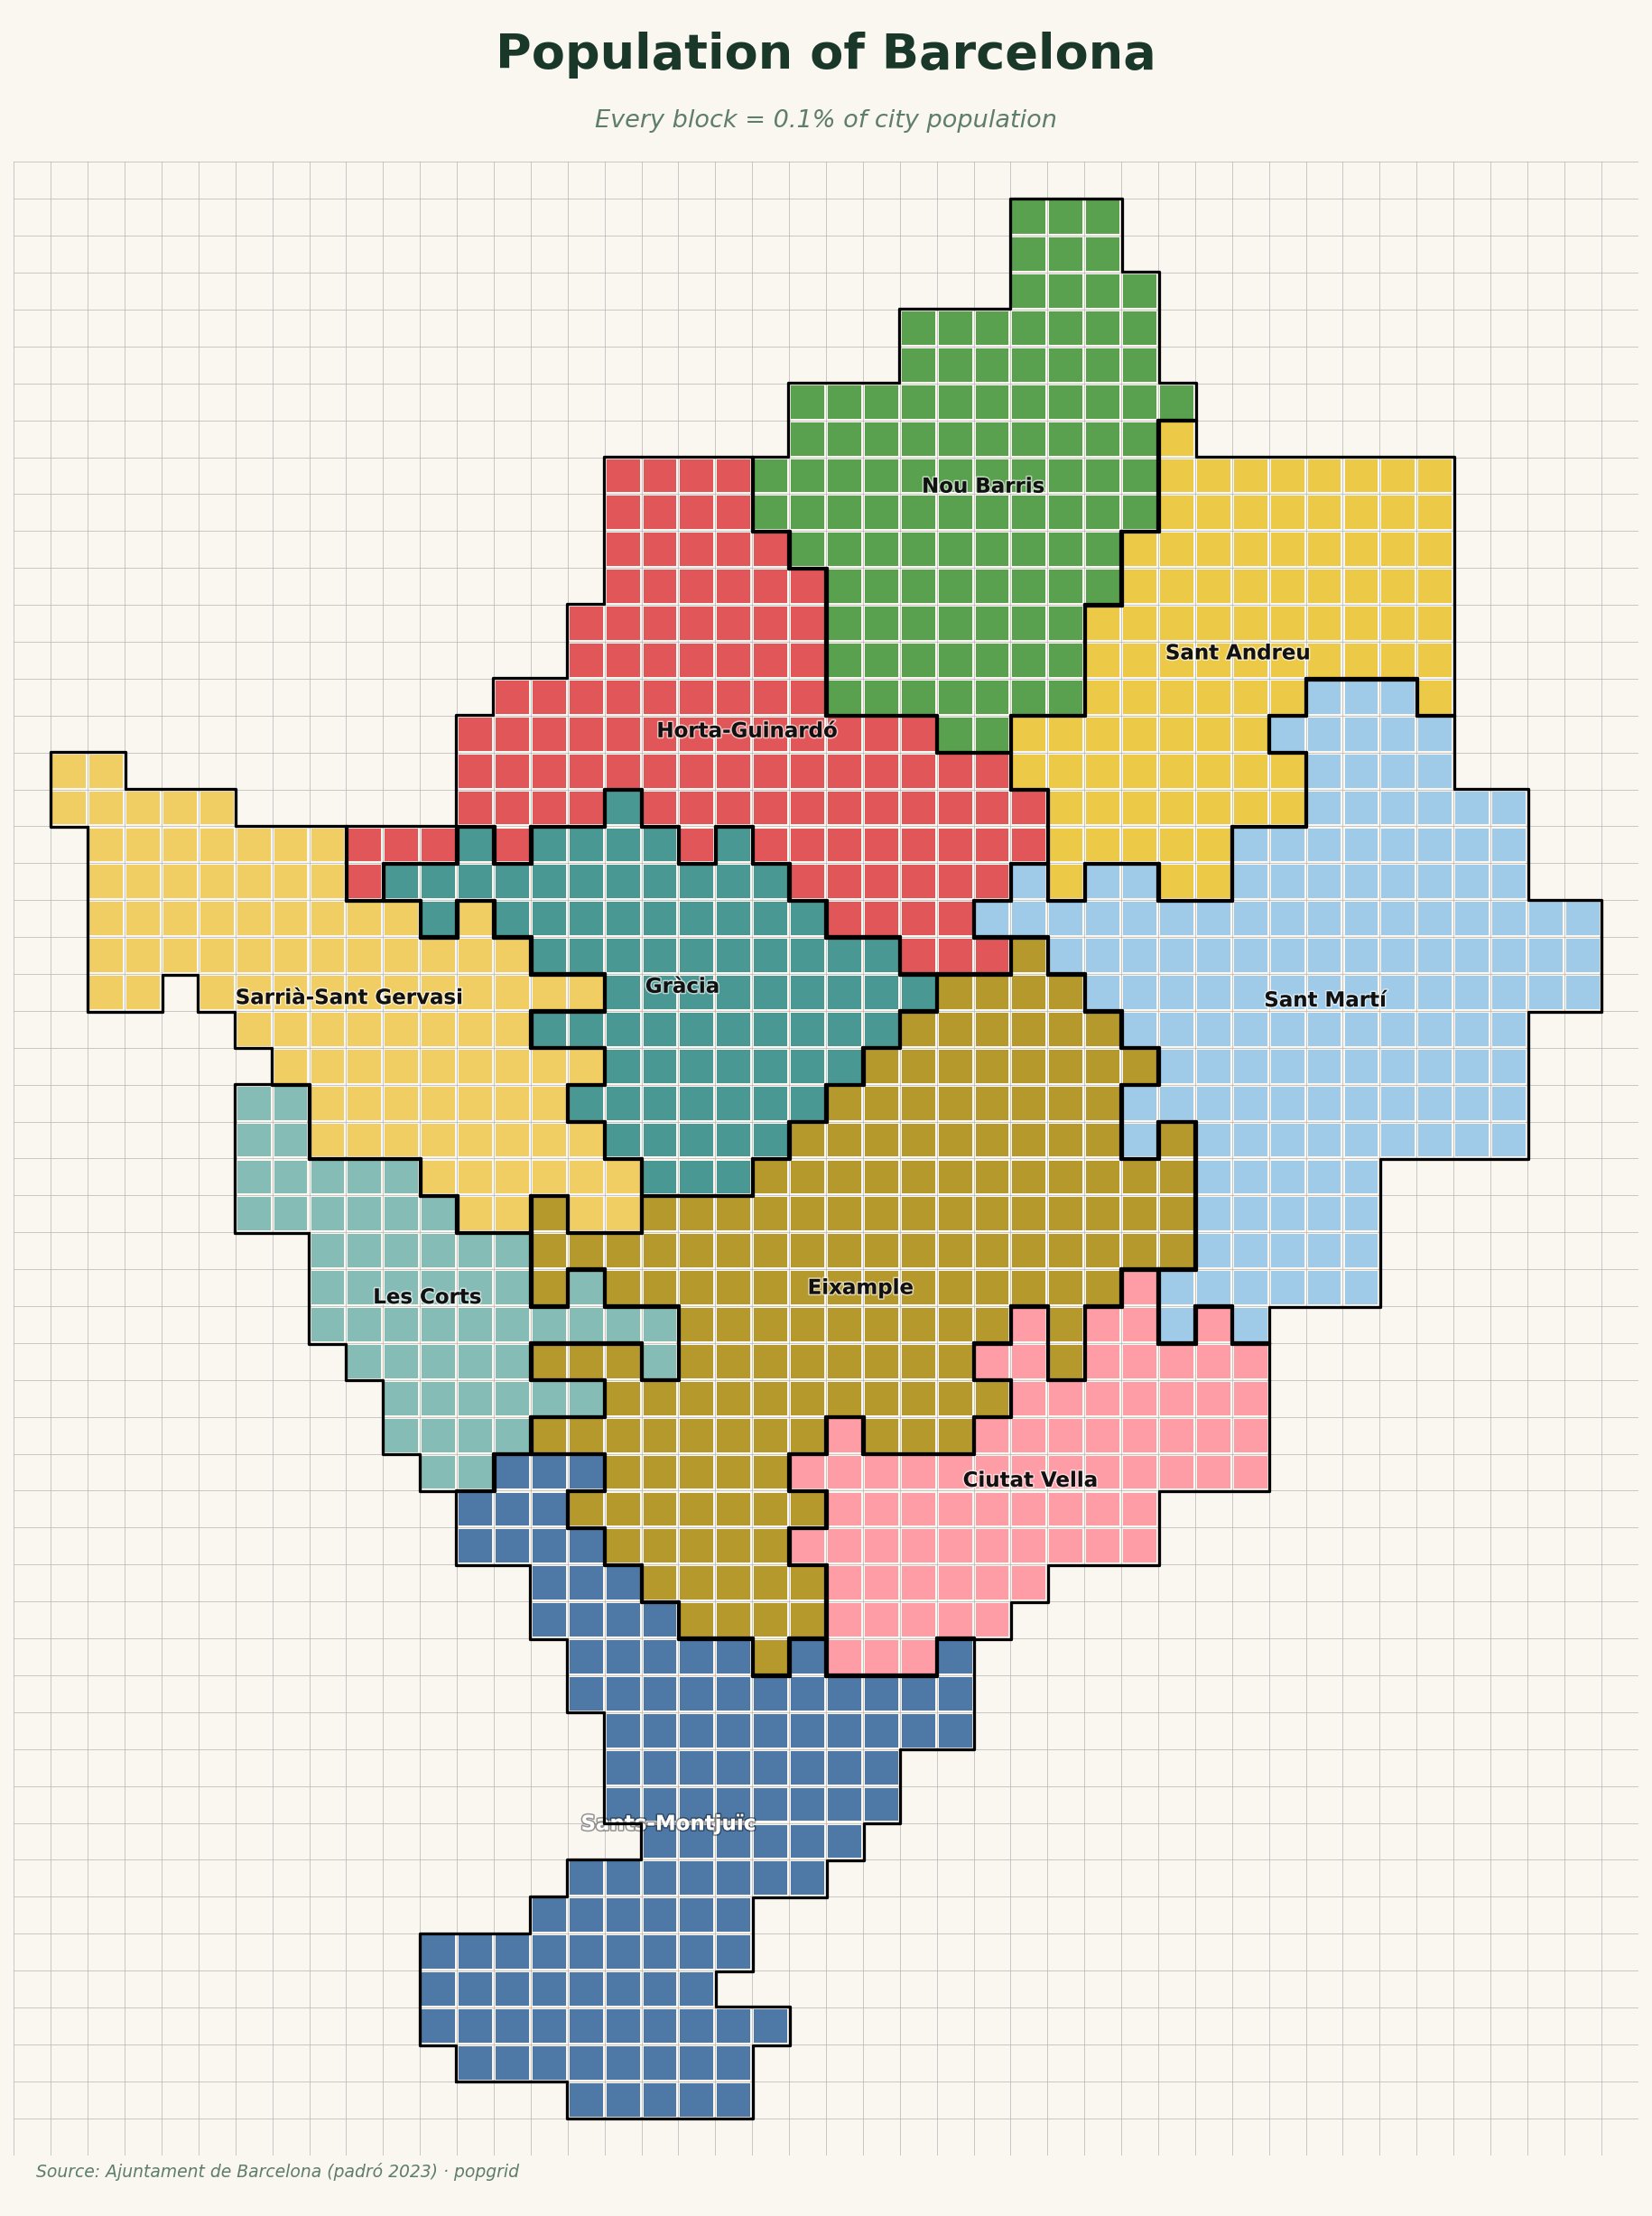
title="Population of Barcelona",
subtitle="Every block = 0.1% of city population",
)
Barcelona's 10 districts, built entirely from a custom GeoDataFrame. Eixample, the densest district, balloons under population; Les Corts and the green hills of Sarrià shrink.
| Land area | Population |
|---|---|
 |
 |
A full runnable version is in examples/barcelona.py, using the district boundaries in examples/data/barcelona_districts.geojson.
Command line
generate.py (at the repo root) renders one or many countries from the terminal.
# Population map of Spain
python generate.py ESP --mode pop

# Land-area map
python generate.py ESP --mode area

# Side-by-side comparison (land area vs population, equal block size)
python generate.py ESP --mode compare

# Several countries at once, into a folder
python generate.py ESP DEU FRA --mode compare --out compare/

# Everything bundled
python generate.py ALL --mode pop
Useful flags: --n (target block count, default 1000), --mainland (drop detached territories), --no-panels (keep nearby islands inline, drop distant panels), --palette, --dissolve, --no-labels, --bg, --background grid|solid|none, --title, --subtitle, --source, --dpi, --out. Run python generate.py --help for the full list.
Bundled countries
24 countries ship with population data and recommended regional segmentation:
ARG AUS BEL BRA CAN CHE CHN DEU ESP FRA GBR ITA JPN KOR MEX NLD NOR PHL POL PRT SWE TUR USA ZAF
For any other country, or for sub-national data such as cities, use from_geodataframe with your own polygons.
How it works
- Load admin-1 regions, project to an equal-area CRS, and choose a cell size so the country tiles into roughly
nblocks (default 1000, so one block ≈ 0.1%). - Allocate an integer block quota per region using the Hamilton (largest-remainder) method, weighted by area or population.
- For population maps, deform each landmass with a contiguous-area cartogram so a region's area tracks its population, then rasterise the deformed shapes onto the grid. Dense regions bulge, sparse regions pinch, relative position and silhouette are preserved.
- Fit each region to its exact quota and assign stable colours from the geographic adjacency graph, so the same region keeps the same colour across the area and population maps.
Notes and limitations
- China leaves a small interior void in the population map. The extreme density gradient between the eastern seaboard and the western interior is hard to tile without a gap; it is documented rather than hidden.
- Population currency. Bundled population figures are a fixed snapshot, not live data. For up-to-date or custom numbers, pass your own values through
PopGrid.from_geodataframe(..., weight_col=...). - Block counts land close to
nbut not always exactly, because of quota rounding and edge fitting (e.g. 984 or 1018 rather than 1000).
Data sources
- Country and admin-1 boundaries: Natural Earth (
ne_10m_admin_1_states_provinces), public domain. - Bundled population figures: World Bank and national statistical offices.
- Barcelona example: district boundaries from Ajuntament de Barcelona open data; population from the 2023 municipal register.
License & credits
MIT licensed. Built by Josep Ferrer at databites.tech, data and AI, clearly explained through diagrams.
The block-cartogram format is inspired by the "Population of X, Visualised" maps popularised by @Civixplorer.
Release history Release notifications | RSS feed

Download files
Download the file for your platform. If you're not sure which to choose, learn more about installing packages.
Source Distribution
Built Distribution
Filter files by name, interpreter, ABI, and platform.
If you're not sure about the file name format, learn more about wheel file names.
Copy a direct link to the current filters
File details
Details for the file popgrid-0.4.0.tar.gz.
File metadata
- Download URL: popgrid-0.4.0.tar.gz
- Upload date:
- Size: 68.1 kB
- Tags: Source
- Uploaded using Trusted Publishing? No
- Uploaded via: twine/6.2.0 CPython/3.10.11
File hashes
| Algorithm | Hash digest | |
|---|---|---|
| SHA256 |
d3244aca09f1d50e95cd3c07af342188f0c747861822696e8564dae76219ac80
|
|
| MD5 |
d42a087a91d2281b8e8eddef1097a657
|
|
| BLAKE2b-256 |
5e0e8bffec297976ac2cda38d0a055f5d35e2ed3e7871cd3ddffead9b08fbc6b
|
File details
Details for the file popgrid-0.4.0-py3-none-any.whl.
File metadata
- Download URL: popgrid-0.4.0-py3-none-any.whl
- Upload date:
- Size: 62.2 kB
- Tags: Python 3
- Uploaded using Trusted Publishing? No
- Uploaded via: twine/6.2.0 CPython/3.10.11
File hashes
| Algorithm | Hash digest | |
|---|---|---|
| SHA256 |
b942545ee5b90ae6f40594ae23a8c0f94973baf0556ed3b00f96cc1432bb54d2
|
|
| MD5 |
47d44d09339f76f742f9cd7d345794cd
|
|
| BLAKE2b-256 |
68272615b9896c77261d3342afed9dd55b23f0df4f69a63c1c7a5fc12116d40b
|


