
poseaudit





Your pose model has a good mAP. How far off are the angles it measures?
When keypoints are used to measure something (a joint angle, a tilt, a length),
position metrics such as OKS, PCK or pixel error do not say how far off the
measurement is. poseaudit reads the measurement off the ground truth and off
the prediction and reports the difference the way a measuring instrument is
judged: how large, how often large, where, biased which way, and how sure you
can be of each figure. The statistics are the familiar agreement ones (Bland-Altman
limits, ICC, CCC, Deming and Theil-Sen slopes); what poseaudit adds is the
path to them from the formats computer vision evaluates in (COCO, YOLO,
supervision): matching, counting what could not be read and why, intervals
that respect images or subjects, and a check of whether a slope below 1 is
more than keypoint jitter.
$ poseaudit audit --format coco --gt gt_200.json --pred pred_yolo11n.json \
    --angle 5,7,9 --big-error 15 --size-bands 30,60
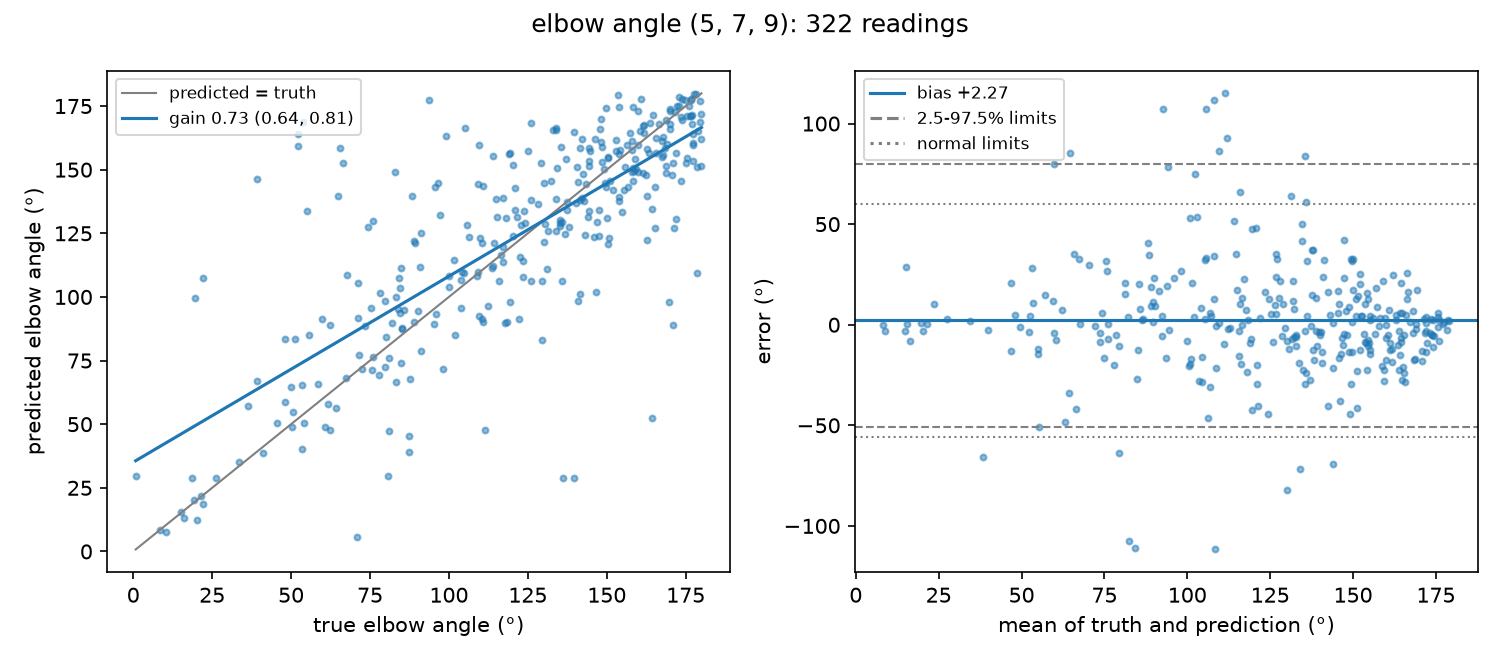
angle (5, 7, 9): read 322 of 380 labelled instances
  not read     no matching prediction 35, prediction lacked a point 23, unmeasurable 0
  not counted  206 with a point unlabelled in the truth, 79 unmatched predictions
  |error|      mean 19.55° [17.13 to 22.16], median 12.64°, 95th pct 68.99°
  >= 15°       43.5% [38.2% to 48.9%]
  by size      0-30 px 58% (n 134), 30-60 px 37% (n 112), 60+ px 28% (n 76)
  bias         +2.34° [-1.16 to +6.22], median +0.52°
  limits       -50.90° to +79.99° (2.5th to 97.5th percentile of errors)
  gain         0.731 [0.639 to 0.814]; robust 0.784
  vs jitter    0.871 from keypoint jitter alone; gap -0.140 [-0.199 to -0.077], p(squash) <= 0.002*
               * swaps and gross failures lower the gain too, and noisy
                 labels make p small for an honest model: read the gap
  ! 2.5% of errors fall below the normal limits and 4.3% above them, against 2.5% each for a normal error: use the percentile limits.
That is the left elbow angle (COCO keypoints 5, 7, 9: shoulder, elbow, wrist;
indices count from 0) of yolo11n-pose against COCO's human labels on 200
val2017 images. The data is in
examples/coco_elbow;
run the command from that folder.
These figures are disagreement between the model and one human label, not
the model's error against the world. COCO's own annotators disagree: placing
the three points with the spread COCO publishes for repeated labels (its OKS
sigmas) moves the elbow angle by 11 to 16° on average on these same arms,
depending on how those sigmas are read (a rough estimate that treats each
label's points as independent; validation/label_noise.py).
A good part of the 19.55° may be the labels'. With a reference better than
the model (motion capture, careful relabelling), the same figures describe
the model.
What a few lines of NumPy would miss:
- What was not read, and why. Unlabelled points, unmatched people and missing predicted points are counted apart, so a model that skips the hard cases does not look better for it.
- Intervals that respect the data. Readings from one image are resampled
together, and with
--clusterso are the frames of one video or the photos of one subject (left out, frames count as independent). - The sorting trap. When the labels are noisy, bias in bands sorted by the truth leans toward squashing even for an unbiased model, the more so the noisier they are (below).
- Decisions. Whether the prediction lands on the same side of a threshold as the truth, which is what a pass or fail rule depends on.
Install
pip install poseaudit                  # needs only numpy
pip install "poseaudit[plot]"          # plots (matplotlib)
pip install "poseaudit[images]"        # --images: read image sizes (Pillow)
pip install "poseaudit[supervision]"   # from_supervision
Quick start
poseaudit audit --format coco --gt annotations.json --pred results.json \
    --min-conf 0.5 --angle 5,7,9 --big-error 15 \
    --report report.md --plot panels.png --csv readings.csv
--big-error is required: the error, in the measure's unit, that counts as
large. report.md explains every line of the summary. In Python:
import poseaudit as pa

truth = pa.load_coco("person_keypoints_val2017.json")
predicted = pa.load_coco_results(
    "results.json", "person_keypoints_val2017.json", min_confidence=0.5
)

result = pa.audit(pa.pair(truth, predicted), pa.angle(5, 7, 9), big_error=15)
print(result.summary())  # summary(full=True) adds every agreement statistic
result.to_markdown("report.md")  # sizes, bands, decisions, largest errors
result.to_csv("readings.csv")  # one row per reading, to recompute anything
result.plot("panels.png")  # predicted against true, and a Bland-Altman plot
From your own arrays: xy of shape (K, 2) in pixel coordinates (not 0 to 1)
and a boolean visible of shape (K,) per object, here a 33-point skeleton:
import numpy as np

truth = {"frame_001": [pa.Instance.from_keypoints(xy_true, np.ones(33, bool))]}
predicted = {"frame_001": [pa.Instance.from_keypoints(xy_pred, visible_pred)]}
result = pa.audit(pa.pair(truth, predicted), pa.angle(23, 25, 27), big_error=10)
What the demo shows
Disagreement grows as the arms get smaller. When the arm segments average under 30 px, 58% of elbows are off by 15° or more; above 60 px, 28%. The signed bias of +2° hides all of this, and so does a single mAP. The link with size is an association; size is not the whole cause. Some of it is geometry: a pixel of error turns a short segment further than a long one, for the label as much as for the model, and an arm pointing toward the camera looks short and is hard to read even on a large person. Small people in COCO are also more often occluded, blurred and loosely labelled.
| arm segment | n | mean abs error | off by 15° or more | gain (no jitter reference per band) |
|---|---|---|---|---|
| 0 to 30 px | 134 | 25.55° | 58.2% [49.7% to 66.2%] | 0.526 |
| 30 to 60 px | 112 | 16.57° | 36.6% [28.3% to 45.8%] | 0.791 |
| 60+ px | 76 | 13.36° | 27.6% [18.8% to 38.6%] | 0.911 |
Which way you sort decides the story
The natural next check is the bias in bands of angle. Sort the same readings three ways and you get three stories:
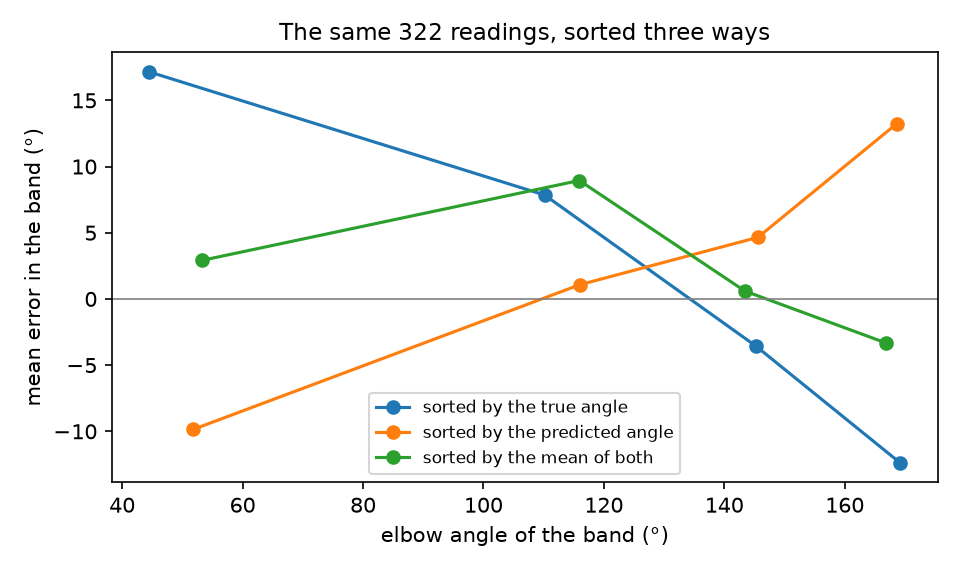
Whichever reading you sort by, its own noise puts its extreme values in the
extreme bands, where they read as bias (regression to the mean). Trust the
sort by the truth when the truth is much less noisy than the model (the
default, --band-by truth); sort by the mean of both (--band-by mean) and
read the Bland-Altman slope when the two are about equally noisy. Under the
wrong assumption, either view misleads: with a model much noisier than its
labels, the Bland-Altman slope calls an unbiased model expanding.
Options
Decisions at a threshold
When a measurement feeds a rule (flag a tilt of 10° or more, an elbow bent past
90°), what matters is whether the prediction lands on the same side of it. The
"truth" side is the same rule applied to the truth keypoints, not a defect
label: an inspector's pass or fail verdict can differ from any angle rule. A
model that reads angles differently may need its own threshold: give one with
--pred-threshold, and poseaudit also finds the one that flags as many
instances as the truth does. That one is fitted on the data it is scored on,
so its figures are optimistic until checked on other data. Only readings
count: a labelled instance that was not read is neither caught nor missed.
$ poseaudit audit ... --threshold 90 --side below --pred-threshold 100
  below 90°: caught 53 of 84 (63% [52% to 73%]), false alarms 11 of 238
  below 90°, predicted 100°: caught 63 of 84 (75% [65% to 83%]), false alarms 23 of 238
  below 90°, predicted 98.40° (same count, fitted here): caught 61 of 84 (73% [62% to 81%]), false alarms 23 of 238
Tilts relative to the rest of the photo
If a rule compares each object with the others in its photo, a tilted camera
moves every tilt together. --relative-to median reads each tilt against the
median tilt of the other objects in the image, on the truth and the prediction
separately, so a camera roll drops out. --relative-to p20 --relative-abs
reads how much more each object leans than the 20th percentile of the others'
absolute tilts. Each object's baseline leaves the object itself out, so none
is scored against itself. With --relative-abs a value below 0 means
straighter than the baseline, so band edges should start below 0. This is for
tilts; an angle inside a limb does not change when the camera rolls, and the
report says so.
Several readings of one subject
Frames of one video, or photos of one subject, are not independent. Name the
group with --cluster REGEX (its first capture group in the image name) or
cluster= in Python, for example cluster=lambda name: name.split("_")[0]
for names such as athlete3_trial2_f0041. Intervals then resample whole
groups, and limits of agreement for repeated readings (Bland and Altman 2007)
are added. Leave the groups out and every frame counts as independent: the
intervals come out far too narrow, and nothing warns about it.
By default the group is the image. With fewer than 20 groups the intervals are too narrow, and the report says so; nested groups (subject, trial, frame) are not supported. With named groups the jitter reference gives no p: it treats readings as independent, and when a subject carries the same error from reading to reading it would flag honest models as squashed far more often than it says. Read the gap's interval, which resamples whole groups.
Does the model squash large angles?
The gain is the least-squares slope of the predicted angle on the true one:
0.73 means that, on average over these readings, a 10° difference comes out as
about 7°. Keypoint jitter alone pulls a gain below 1 too: a straight arm can
only be read as more bent, a folded one only as more open. The jitter
reference (vs jitter) is the gain of predictions rebuilt from the truth
plus this model's own point displacements (how):
0.87 here. The model's gain is 0.140 lower (interval 0.077 to 0.199, paired
within resamples). With the default seed none of the 500 rebuilds comes out
as low as the model's (p(squash) <= 0.002); with some other seeds one does
(0.004).
The model reads angle differences as smaller than its own scatter explains.
What that is, the check cannot say:
-
Gross failures and swaps. Gross failures tied to the true angle (a straight arm read as folded) and left and right swapped on one side lower the gain just as squashing does; failures in random directions are part of the rebuilds and do not widen the gap. Leaving out the 31 readings off by 45° or more leaves a gap of -0.069 [-0.109 to -0.028] (about half the gap), and leaving out the 61 off by 30° or more, -0.038 [-0.073 to -0.003]. Those subsets are chosen by the outcome, so they describe where the gap comes from rather than test it, and trimming by the outcome changes a gap by itself, so what is left is not a clean measure of squashing either. Some of the largest errors may be the labels' (a point on the wrong limb), and the 58 instances not read may not be a random part of the rest.
-
Noise in the truth. The rebuild takes its displacements against the labels, so label noise is already in its scatter. On these same arms, honest models with labels as noisy as COCO's annotators fell 0.02 to 0.04 below the reference, far less than 0.140 (
validation/label_noise.py, with independent normal noise on each point). Under that model label noise does not explain this gap, but it does trip the p: those honest models gotp(squash) <= 0.05in 17 to 40% of 30 runs each. With noisy labels, read the size of the gap, not the p. -
Squashing is what remains, and it is not separated from the two above. The slopes that suit equal noise, the Bland-Altman slope (-0.049 [-0.119 to +0.017]) and Deming at a noise ratio of 1 (0.945 [0.870 to 1.019]), include no squashing, but do not rule out a small one. Which to trust depends on the noise ratio, which this data does not pin down. Deming for other ratios (
--noise-ratio, the variance of prediction noise over that of label noise):noise ratio 1 4 10 Deming slope 0.945 [0.870 to 1.019] 0.797 [0.708 to 0.878] 0.758 [0.667 to 0.842] On these arms honest models give a Deming slope at a ratio of 1 near 1 whether the labels are clean or as noisy as the model, with independent normal noise and no gross failures (
validation/label_noise.py): there, jitter at the ends of the range does not drag it down the way it drags the gain.
For this demo, then: a real gap, about half of it in the largest errors. Whether the rest is squashing of a few percent or nothing, this data cannot tell.
A few gross failures move a least-squares slope a lot. The robust gain, a Theil-Sen slope that they barely move, is 0.78 here against the least-squares 0.73. Noise that grows with the angle, or on smaller arms, also separates the two, so their difference alone does not say how much comes from gross failures, and a gross failure can also be a label on the wrong limb.
Measures
| measure | points | reads |
|---|---|---|
tilt(a, b) |
2 | degrees of the axis through a and b from vertical, -90 to 90, positive when the upper end leans right; the axis has no direction, so errors wrap (89° vs -89° is 2° off) and a part read upside down is not an error |
angle(a, b, c) |
3 | interior angle at b, 0 to 180° (180 is straight; a flexion angle is 180 minus this, which flips the sign of the bias); unsigned, so an angle read bending the other way is not an error |
length(a, b) |
2 | pixels |
ratio(a, b, c, d) |
4 | |a-b| / |c-d|, independent of scale |
The size of a reading is the mean length of its segments in the truth. There
is no directed angle (0 to 360) and no fixed axis other than vertical yet;
--relative-to reads tilts against the rest of the image instead.
Inputs
| source | loader |
|---|---|
| COCO keypoint annotations | load_coco(path, classes) (crowd regions skipped) |
| COCO results format | load_coco_results(path, annotations_path, min_confidence, classes) |
| Ultralytics YOLO pose labels or predictions | load_yolo(folder, image_size, num_keypoints, classes, min_confidence) |
sv.KeyPoints (supervision 0.30.6+) |
from_supervision(keypoints_by_image, detections_by_image=None) |
| anything else | Instance.from_keypoints(xy, visible) per object, in a dict of image name to list |
COCO annotations with no labelled keypoint (num_keypoints 0) and crowd
regions are skipped as they load, so they appear in no count.
- Bad values. NaN or infinite coordinates, scores or boxes stop the load with the file and the row.
- Confidence. In a results file or a YOLO prediction the third value of a point is a confidence. Without a threshold every returned point counts as seen, and a warning says so.
- Missing points. A YOLO point written as
0 0is missing, as in supervision. - Pixels. Angles are measured on the coordinates given. YOLO coordinates
are fractions of width and height, so an angle measured on them is
distorted on any non-square image. Give one size, a function of the image
name, or
--images DIRto read each image's size. A size given in the wrong order (height, width) passes every check and quietly distorts the figures (on upright parts it made them look better);--imagesavoids that. Arrays passed toInstance.from_keypointsmust be in pixels too. - Classes. Instances of different classes are not paired, and an audit
whose readings mix classes stops with an error: parts of different kinds can
hide each other's errors. Filter with
--classes(any format), or allow it with--mixed-classes. When the two sides number classes differently (COCO calls a person 1, Ultralytics 0) they are matched ignoring classes, with a warning. A class filter that keeps nothing names the classes that are there. - Wrong keypoint counts. A YOLO load stops on coordinates outside the
image, which usually means
--keypointsis wrong, and on a missing folder. If every row could also be read as fewer points in x y v form with flags 0, 1 and 2, a warning asks you to check--keypoints. - Skeletons of different sizes on the two sides are refused.
- supervision.
- The container's
visiblemask decides visibility: filter withkp.visible = kp.keypoint_confidence > 0.5, not with a 2D mask such askp[mask], which drops columns and so changes what each keypoint index means. from_ultralyticsdrops the model's boxes; to match by box, passsv.Detections.from_ultralyticsof the same result, row for row (notkp.as_detections(), which drops rows with no visible point). Boxes a model keeps inkp.data["xyxy"](RF-DETR) are used when no detections are given; RF-DETR also fillsvisiblewith confidence > 0, so set your own threshold on it.- When both carry the model's scores, rows whose scores rank differently stop the load. Without scores only geometry is left: two rows whose keypoints clearly fit each other's boxes better than their own give a warning, which crowded human labels can also trip.
- The container's
How pairs, counts and intervals are made
- Predictions are matched to the truth within each image, by image name and
never by list position (a file extension is ignored when only that differs,
with a warning). Within an image the most similar pairs are matched first:
by box IoU (
--min-iou, default 0.3), or by keypoint closeness when a side has no box (--min-similarity, default 0.5). Detection scores are ignored in matching: drop low-scoring detections first (--min-score, ormin_score=in the loaders), or a stray box that overlaps better can take the pair. - A prediction too far off to reach the matching threshold counts as missed, not as an error. When many such misses overlap a prediction that was left over, a warning names the threshold to lower.
- A reading needs every point of the measure in both. The report separates what was not read: points unlabelled in the truth (not the model's doing, and out of the denominator), no matching prediction, a predicted point missing, or geometry that cannot be measured.
- Intervals are percentile bootstraps over whole clusters (by default images), 2,000 resamples with a fixed seed. Rates of large errors and of decisions use Wilson intervals, which treat readings as independent, unless clusters are named; then the overall rate and the decision rates resample whole clusters too (never narrower than Wilson's). Rates per size band stay Wilson.
The jitter reference
Each rebuilt arm takes all its point shifts from one arm with a similar true angle (one of up to six equal-count groups; possibly itself), scaled to its own size. Shifts are expressed along and across each point's own segment, and mirrored for arms that bend the other way, so an error along the limb stays along it and one toward the inside of the bend stays there. The shift a whole group shares is removed first, because that shared shift is the tendency being tested. Drawing each point from a different arm instead would break the correlation within an arm (a whole limb shifting at once barely changes its angle) and set the reference too low.
Statistics used
| figure | definition |
|---|---|
| gain | least-squares slope of predicted on truth |
| robust gain | Theil-Sen slope: median of the slopes between pairs of readings |
| vs jitter | median gain over 500 rebuilds (see The jitter reference); the gap's interval averages 10 rebuilds per resample; p(squash) = (1 + rebuilds with gain at or below the model's) / 501 |
| BA slope | slope of the error on the mean of both readings (Bland and Altman 1999) |
| Deming | slope of predicted on truth with a known ratio of noise variances (Deming 1943; Linnet 1993); the ratio is prediction over label |
| limits | 2.5th and 97.5th percentiles of the error; normal limits are bias ± 1.96 SD (Bland and Altman 1986) |
| repeated limits | bias ± 1.96 √(between + within variance) (Bland and Altman 2007) |
| ICC(A,1) | two-way, absolute agreement, single rating (McGraw and Wong 1996); matches pingouin; its interval is the bootstrap, not the F interval |
| CCC | Lin's concordance correlation (Lin 1989) |
| intervals | percentile bootstrap over clusters (Davison and Hinkley 1997); Wilson score intervals for rates without named clusters (Wilson 1927) |
The robust gain uses every pair of readings up to about 1,000 readings and 500,000 random pairs above that.
References
- Bland JM, Altman DG (1986). Statistical methods for assessing agreement between two methods of clinical measurement. Lancet 327(8476):307-310.
- Bland JM, Altman DG (1999). Measuring agreement in method comparison studies. Statistical Methods in Medical Research 8(2):135-160.
- Bland JM, Altman DG (2007). Agreement between methods of measurement with multiple observations per individual. Journal of Biopharmaceutical Statistics 17(4):571-582.
- Davison AC, Hinkley DV (1997). Bootstrap Methods and their Application. Cambridge University Press.
- Deming WE (1943). Statistical Adjustment of Data. Wiley.
- Lin LI (1989). A concordance correlation coefficient to evaluate reproducibility. Biometrics 45(1):255-268.
- Linnet K (1993). Evaluation of regression procedures for methods comparison studies. Clinical Chemistry 39(3):424-432.
- McGraw KO, Wong SP (1996). Forming inferences about some intraclass correlation coefficients. Psychological Methods 1(1):30-46.
- Sen PK (1968). Estimates of the regression coefficient based on Kendall's tau. Journal of the American Statistical Association 63(324):1379-1389.
- Theil H (1950). A rank-invariant method of linear and polynomial regression analysis. Indagationes Mathematicae 12:85-91.
- Wilson EB (1927). Probable inference, the law of succession, and statistical inference. Journal of the American Statistical Association 22(158):209-212.
Output for machines
--json writes every figure, with poseaudit (the version) and schema
(1) at the top and the settings used. NaN and infinity become null. Note
that limits there are the normal limits; the percentile limits the summary
prints are empirical_limits. Warnings, including those raised while
loading, are in warnings. --csv writes one row per reading:
image, truth_index, predicted_index, class_id, cluster, size, truth, predicted, error, mean. Same inputs and seed, same bytes.
The command exits 0 on success (warnings included); 1 on bad input or
settings, a failed write, or nothing read (the JSON and CSV are still
written); and 2 when the arguments cannot be parsed. There is no pass or fail threshold built in; gate on the JSON, for
example jq -e '.mean_abs_error_ci[1] <= 3 and .n / .measurable >= 0.9'.
--resamples and --jitter-repeats trade precision for speed: 50,000
readings take about three minutes at the defaults.
Limitations
- The figures describe agreement with the ground truth, not with the world: the truth's own error is inside them, and 2D angles are not 3D joint angles.
- Every reading counts once: frames pooled from a few trials inflate ICC and CCC, and there is no per-trial or per-subject summary (peak angle, range of motion) yet.
- Tilts near horizontal wrap from +90 to -90; the report warns when many are close.
- The jitter reference is new, not a published method, and was checked by
simulation only (
validation/jitter_reference.py, seeded). For models with no tendency and clean labels, with 300 arms and 600 runs per case, the one-sided p was 0.05 or less in 2.3 to 5.7% of runs, and the gap's interval lay wholly below 0 in 2.2 to 4.3% with the 200 resamples that table uses, and in 1.3 and 2.7% for the two cases rerun at the tool's defaults (150 runs each; 2.5% nominal). With 40 arms and noise that grows on straight arms the p ran to 8%, hence the warning under 60 readings (where exactly to draw that line was not tested). With labels as noisy as the model, honest models were flagged in about 35% of runs (37% at 200 resamples, 35% at the defaults): the check assumes labels much cleaner than the model. A 7% squash was caught in every run, with point noise of 8% of the arm; with noisier points it is caught less often (not measured here). It assumes independent objects whose errors, apart from a shift shared by similar angles, depend only on the true value and the object's own frames. The p and the interval can disagree near the edge. - Matching is greedy and ignores scores (filter them first with
--min-score); in dense crowds an optimal assignment may pair differently. - One measure per run, one level of clusters, no time series.
Roadmap
- a label-noise reference beside the jitter one (from annotator spread or repeated labels)
- left-right swap detection
- several measures and several models per run, on the readings they share
- auditing angles given directly (filtered or from inverse kinematics)
- directed angles (0 to 360), signed joint angles, a chosen reference axis
- regression-based limits of agreement; per-subject summaries
License and data
Code: MIT. The demo's annotations are a subset of the
COCO 2017 keypoint annotations (keypoint fields
only), © COCO Consortium, licensed under
CC BY 4.0; the images are not
included. The demo's predictions were made with Ultralytics yolo11n-pose
(AGPL-3.0), which this package does not depend on or include.
1 maintainer

Metadata
1 maintainer
Release files for poseaudit 0.1.1
For a detailed explanation of source distributions (sdists) and built distributions (wheels), please see the package formats documentation.
Source distribution (sdist)
| File | Size | Uploaded | |
|---|---|---|---|
| poseaudit-0.1.1.tar.gz | 68.2 kB | Details |
Built distribution (wheel)
| File | Interpreter | ABI | Platform | Reset |
|---|---|---|---|---|
| poseaudit-0.1.1-py3-none-any.whl | Python 3 | none | any | Details |
Total release size: 125.4 kB
Release files / poseaudit-0.1.1.tar.gz
| Download URL | poseaudit-0.1.1.tar.gz |
|---|---|
| Size | 68.2 kB |
| Tags | Source |
|
SHA-256 checksum How to use checksums |
e62d9feaf7d9358fe846597c53c110c10d693f0d57032b66b73ef1bf1eec29dd
|
|
BLAKE2b-256 checksum How to use checksums |
2cdbf34ade309edaa8493a0451b3c1623f13ddfb69ad504fb646ff18eb0718b4
|
| Upload date | |
|
Uploaded using Trusted Publishing? What is trusted publishing? |
Yes |
| Uploaded via |
twine/7.0.0 CPython/3.13.14
|
Provenance
Provenance describes where a file came from. On PyPI, provenance is shared via attestations, which provide a verifiable record of the build or publishing details. View details, limitations and caveats.


PyPI Publish Attestation
PyPI verified that this artifact, at this checksum, originated from the publisher listed below.
Signed by GitHub Actions, verified by PyPI on Oct 3, 2026.
Transparency logRelease files / poseaudit-0.1.1-py3-none-any.whl
| Download URL | poseaudit-0.1.1-py3-none-any.whl |
|---|---|
| Size | 57.2 kB |
| Tags | Python 3 |
|
SHA-256 checksum How to use checksums |
197111d67ed635db89bff74623d8133408916809c5d7e645d838748f2ebb8063
|
|
BLAKE2b-256 checksum How to use checksums |
54d69c497d0c181603cf8ef94d366b9562cc059dc96a24c7670b09c6b8ab50e1
|
| Upload date | |
|
Uploaded using Trusted Publishing? What is trusted publishing? |
Yes |
| Uploaded via |
twine/7.0.0 CPython/3.13.14
|
Provenance
Provenance describes where a file came from. On PyPI, provenance is shared via attestations, which provide a verifiable record of the build or publishing details. View details, limitations and caveats.
PyPI Publish Attestation
PyPI verified that this artifact, at this checksum, originated from the publisher listed below.
Signed by GitHub Actions, verified by PyPI on Oct 3, 2026.
Transparency log













