
pragdml
Causal inference when your controls are AI-learned representations.




A Python implementation of Pragmatic DML with AI-Learned Representations (Aradillas Fernández, Chernozhukov, Cinelli, Klaassen, Newey, Spindler, Teichert-Kluge & Vijaykumar, 2026), together with the omitted-variable-bias theory it builds on (Chernozhukov, Cinelli, Newey, Sharma & Syrgkanis, Review of Economics and Statistics, 2026).
The problem it solves
You have a rich covariate — a product description, a product image, a clinical note, a panel of attributes. You compress it into an embedding with a foundation model and use that embedding as a control. Then you report an ATE.
That ATE is not the ATE you think it is. Compressing the covariate changes two things at once: the regression you adjust with, and the population parameter your procedure is centred on. The paper's central result says exactly how much:
$$\theta^* - \theta_\lambda = E\big[(g^* - g_\lambda)(\alpha^* - \alpha_\lambda)\big]$$
The gap between the true causal parameter and the one you estimate is the
product of two representation errors — one in the outcome regression g, one
in the balancing weight (Riesz representer) α. Not their sum. Their product.
Three consequences, and pragdml implements all three:
| 1. You can compress a lot, safely. | The representation need not reconstruct the covariate. It only has to preserve one of the two objects — regression or balancing weight. If either error is small, the target barely moves. |
| 2. You can fine-tune inside the folds. | Learn the representation fold-wise and the usual DML inference still holds, with no stability or differentiability condition on the tuning algorithm. Only the fitted functions' prediction rates matter. |
| 3. When loss is material, you get a region. | Not a point you cannot defend, but an identified interval for the true parameter with root-n inference for its endpoints — plus a robustness value that says, in one number, how strong the discarded information would have to be to overturn your sign. |
Install
pip install pragdml
Python 3.10+. Hard dependencies are only numpy, scipy, pandas,
scikit-learn, matplotlib and joblib.
Never used Python before? Jump to Starting from absolutely nothing.
Sixty seconds
import numpy as np
from pragdml import PragmaticDML

rng = np.random.default_rng(0)
X = rng.normal(size=(2000, 5))                      # your embedding goes here
e = 1 / (1 + np.exp(-X[:, 0]))                      # confounded assignment
D = (rng.uniform(size=2000) < e).astype(float)
Y = 2.0 * D + X[:, 0] - 0.5 * X[:, 1] + rng.normal(size=2000)

res = PragmaticDML(functional="ate", seed=0).fit(Y, D, X)
print(res.summary())

print("robustness value:", res.robustness_value())
                  Pragmatic DML -- ATE

  Observations      2000
  Folds (K)         5
  Variance          cross-fitted score variance (Eq. 12)
  Interval refers to: representation-based target (theta_lambda, Eq. 3)
  Representation dim 5
==============================================================================
quantity estimate std_error       t p_value [95% CI lower  upper]
------------------------------------------------------------------------------
     ATE   2.0183    0.0479 42.1392  0.0000        1.9244  2.1122  ***
==============================================================================
Signif.: *** p<0.01, ** p<0.05, * p<0.1
Score: psi = m(O, g) + alpha(W){Y - g(W)}  (Eq. 8), Neyman-orthogonal.
Under target adaptivity (Def. 1) the same interval covers theta*;
otherwise report a sensitivity region (Sec. 4): res.sensitivity().
Note what the table refuses to be vague about: which parameter the interval covers. That is the whole point of the paper.
The complete worked example (real data)
pragdml ships the 1991 SIPP 401(k) dataset — 9,915 households, the canonical
dataset of the DML literature and the empirical application of the parent paper.
python examples/pension_401k.py
The question
401(k) eligibility is not randomised: it depends on your employer. The naive gap in net financial assets between eligible and ineligible households is $19,559 — and it is confounded. How much survives adjustment, and how strong would unobserved firm characteristics have to be to overturn what is left?
Step 1 — load and estimate
import numpy as np
from sklearn.compose import ColumnTransformer
from sklearn.preprocessing import SplineTransformer

from pragdml import (AdditiveFeatures, LinearOutcomeLearner,
                     LinearRieszLearner, PragmaticDML)
from pragdml.datasets import load_pension, PENSION_COVARIATES

Y, D, X = load_pension(return_X_y=True)

# Flexible in the covariates, linear in the treatment: the "partially linear
# model" of the literature. This matters -- see "Practical guidance" below.
basis = ColumnTransformer(
    [("spline", SplineTransformer(n_knots=6, degree=3), [0, 1, 2, 3])],
    remainder="passthrough",
)

res = PragmaticDML(
    functional="ate",
    outcome_learner=LinearOutcomeLearner(AdditiveFeatures(basis=basis), ridge=1e-8),
    riesz_learner=LinearRieszLearner(AdditiveFeatures(basis=basis), ridge=1e-8),
    n_folds=5, n_rep=5, seed=20261017,
).fit(Y, D, X)

print(res.summary())
Result: $7,855 (se $1,392), 95% CI [$5,126, $10,583]. The published figures are about $9,000 and about $8,000 — both inside this interval. Adjustment removed 60% of the naive gap; a large positive effect remains.
Step 2 — ask how fragile that is
sa = res.sensitivity()
print(sa.summary())
print("RV(0, 0.05) =", round(sa.robustness_value(), 4))
Robustness value = 4.2%. Published values: 5.4% and 4.5%.
Read it as: unobserved firm characteristics explaining less than 4.2% of the residual variation — both of the outcome and of the treatment, in the worst-case alignment — cannot bring the lower confidence limit to zero.
Step 3 — see the whole surface
from pragdml._plots import plot_sensitivity_contour
plot_sensitivity_contour(sa, cy2_max=0.12, cd_share_max=0.12, rho=1.0)
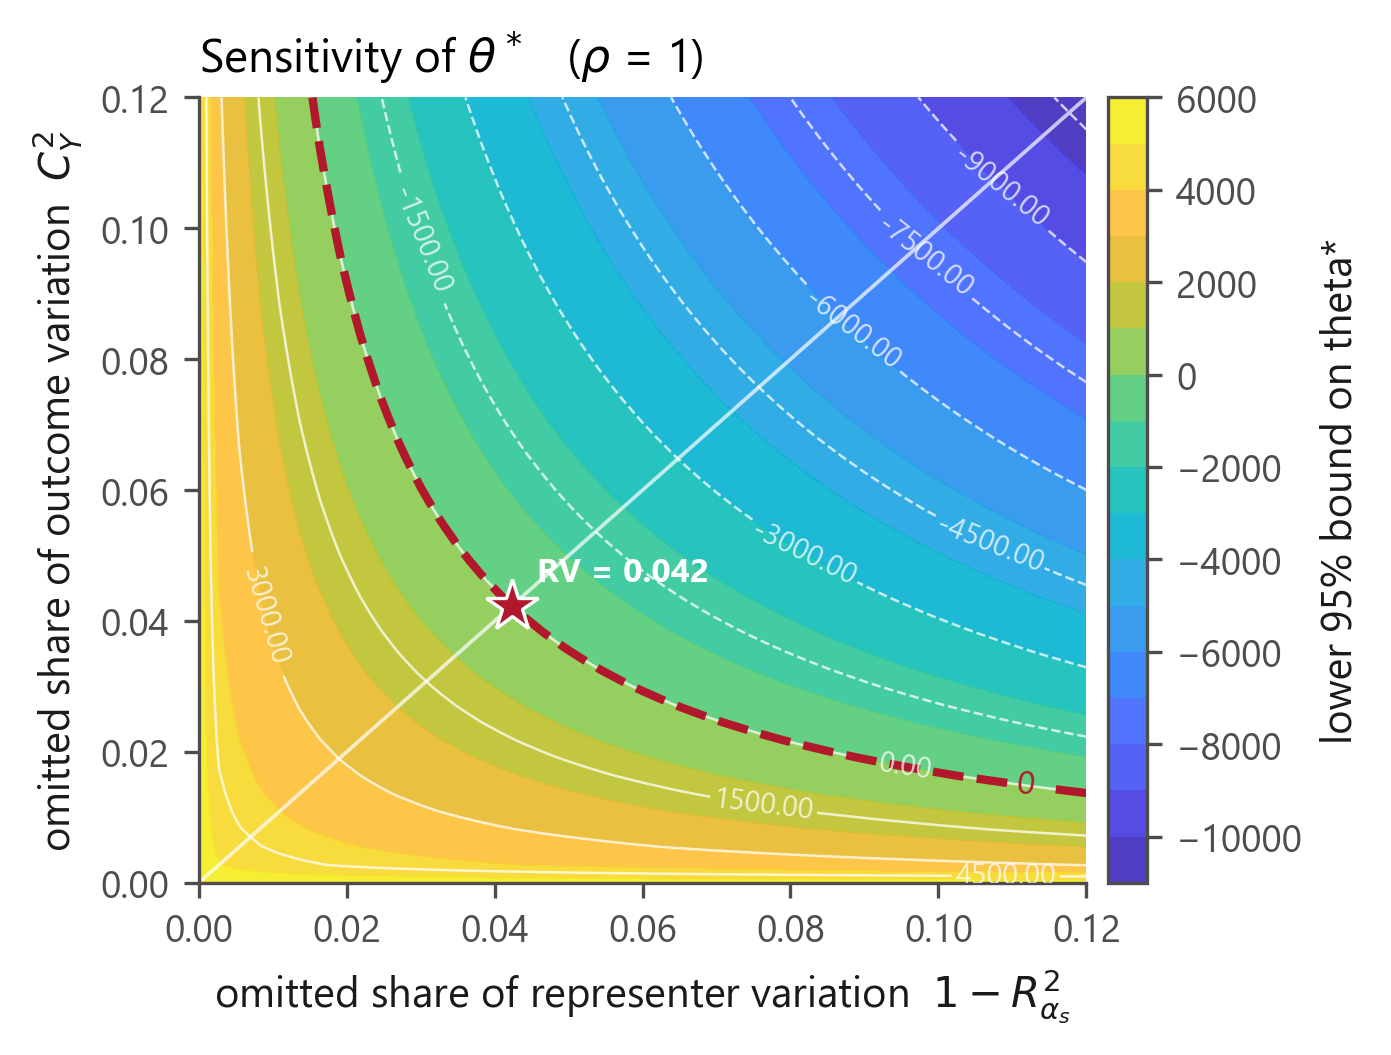
Every point is a confounding scenario. The colour is the lower 95% bound on the true effect. The red dashed line is where that bound hits zero — beyond it, the sign is no longer safe. The star sits where the 45° line crosses it: that is the robustness value, and it is why one number can stand in for the whole picture.
Step 4 — calibrate from observed covariates
Instead of asserting strengths out of thin air, anchor them: "the omitted information is no stronger than observed income."
from pragdml.sensitivity import benchmark_covariate

j = PENSION_COVARIATES.index("inc")
short = PragmaticDML(...).fit(Y, D, np.delete(X, j, axis=1))
bm = benchmark_covariate(res.crossfit_, short.crossfit_, name="inc", k_y=0.25, k_d=0.25)
print(bm.cy2, bm.cd_share)      # the implied scenario for "1/4 as strong as income"
Step 5 — compare information sets
from pragdml import compare_information_sets
cmp = compare_information_sets(Y, D, {"demographics": ..., "economic": ..., "all": X},
                               functional="ate", seed=0)
print(cmp.summary())
| information set | estimate | std error | CI lower | CI upper |
|---|---|---|---|---|
| demographics | 18382 | 1434 | 15572 | 21192 |
| economic | 7828 | 1432 | 5021 | 10636 |
| assets | 12159 | 1335 | 9542 | 14777 |
| all | 7805 | 1350 | 5159 | 10452 |
| Star aggregate | 8019 | 1315 | 5442 | 10597 |
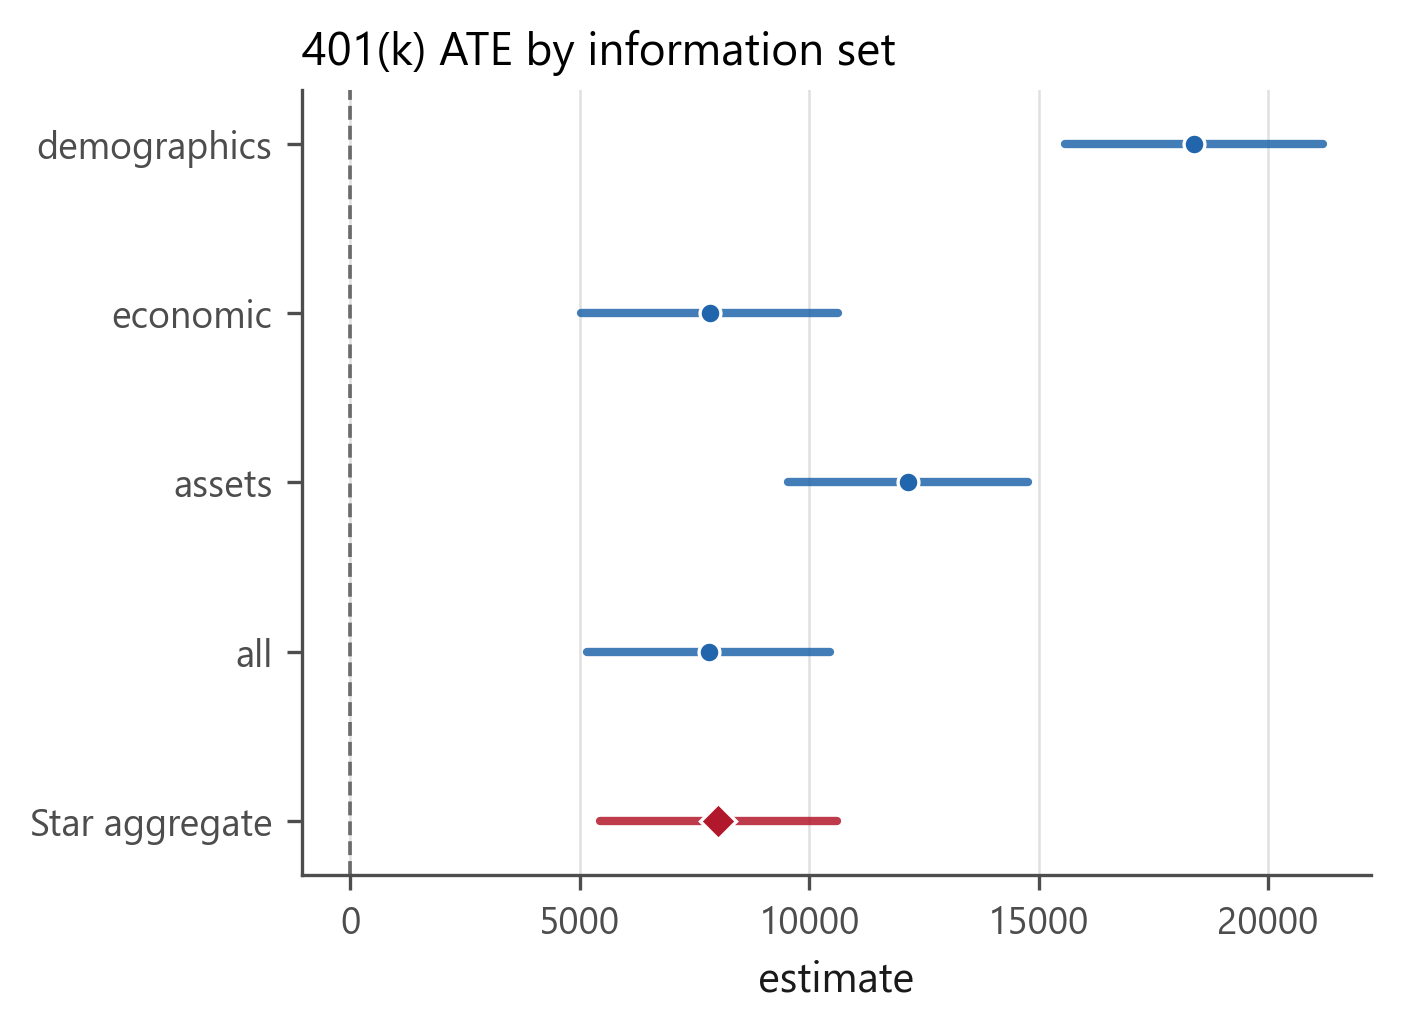
Each row is a different population target θ_λ, not a competing estimate of
one number. Reading them: demographics alone barely adjusts anything; the economic
block (income, education) reproduces almost the whole adjustment. Income is doing
the work — which is exactly why the parent paper benchmarks against it.
Interpreting the output
The summary table, line by line
| Line | What it means |
|---|---|
estimate |
θ̂, the cross-fitted orthogonal-score estimate (Eq. 11). |
std_error |
From the empirical variance of the cross-fitted scores (Eq. 12), or cluster-robust if you passed cluster=. |
[95% CI lower upper] |
The Wald interval of Eq. (16). |
Interval refers to: |
The most important line. θ_λ for a single information set; θ₀ for a pipeline. It is θ* only under target adaptivity. |
Folds (K) |
Cross-fitting folds, and repetitions if n_rep > 1. |
The sensitivity components
| Symbol | Meaning | Identified? |
|---|---|---|
σ₀² = E[(Y−g₀)²] |
Residual outcome variance | yes |
ν₀² = E[α₀²] |
Second moment of the balancing weight | yes |
S₀ = (σ₀²ν₀²)^½ |
The scale of any possible bias | yes |
C_Y² |
Share of residual outcome variation the omitted information could explain | no — you assume it |
C_D² |
The same for the balancing weight | no — you assume it |
ρ |
Alignment of the two omitted components, in [−1, 1] | no — you assume it |
Bias = ρ · C_Y · C_D · S₀. The library estimates S₀; you supply the rest, and
the robustness value tells you which values would matter.
ρ is not a strength. Confounding can be overwhelming in both equations and
still produce no bias if its functional form differs between them. The parent
paper's example: D = U², Y = D + U. Here U explains 100% of the residual
variation in both, yet U² is uncorrelated with U, so the bias is zero. That is
why ρ multiplies the other two rather than being implied by them.
A warning you may see
RuntimeWarning: the cross-fitted representer has nu_hat^2 = -1.48 <= 0 ...
ν̂² estimates E[α₀²] > 0. A negative value means the Riesz fit has failed —
almost always an over-wide basis making the normal equations ill-conditioned. Do
not report that estimate. Add ridge=, narrow the basis, or switch from
VaryingCoefficientFeatures to AdditiveFeatures.
Practical guidance
Choosing a feature map. VaryingCoefficientFeatures is the paper's own
architecture (Eqs. 68–69) and the default: φ(d,x) = [d·b(x), b(x)]. It doubles
the basis width, so with a wide basis prefer AdditiveFeatures ([d, b(x)]) and
a small ridge. If you see the ν̂² warning, this is the knob.
Flexible in X is not optional. On the 401(k) data a specification linear in
the covariates returns about $4,900 — essentially plain OLS — against about
$7,900 with splines on the continuous covariates. The treatment can be linear;
the covariates usually cannot.
Binary vs continuous treatment. ATE needs D ∈ {0,1}. For a continuous
treatment use AverageDerivative (Eq. 67) — and note that trees, forests and
boosting are inadmissible for it, because a piecewise-constant function has
zero derivative almost everywhere. pragdml warns you.
Clustered data. Pass cluster=. Whole clusters stay inside a fold and the
variance becomes cluster-robust. Section 5.1 of the paper requires this for
repeated observations on a unit but supplies no estimator; this is an addition.
Star or convex aggregation? Star costs log M and tolerates a menu that grows
faster than any power of n; convex costs √(M log n) and needs
M log n = o(√n). Call pragdml.diagnostics.pooling_conditions to decide on your
numbers rather than by feel.
Learn the two heads separately. The outcome regression and the Riesz representer solve different prediction problems and may legitimately select different candidates — the paper's own application does exactly that. Prediction quality alone does not summarise target preservation.
Syntax reference
PragmaticDML(...) — one information set
| Argument | Type | Default | What it does |
|---|---|---|---|
functional |
str or Functional |
"ate" |
"ate", "att", "apo", "average_derivative" (aliases "derivative", "elasticity"). Eq. (2)–(3). |
basis |
sklearn transformer | None |
b(X) inside the feature map. PCA, SplineTransformer, a Pipeline. |
outcome_learner |
OutcomeLearner |
linear over the map | The g head. |
riesz_learner |
RieszLearner |
linear over the map | The α head. |
ridge |
float | 0.0 |
Penalty for both default learners, in the rescaled space. |
n_folds |
int | 5 |
K ≥ 2. |
n_rep |
int | 1 |
Repeated splits, median-aggregated. |
seed |
int | None |
Seeds every split. |
.fit(Y, D, X, cluster=None) → DMLResult.
DMLResult
| Member | Returns |
|---|---|
.theta, .se, .tvalue, .pvalue, .n |
floats |
.conf_int(level=0.95) |
Wald interval, Eq. (16) |
.bootstrap_conf_int(n_boot=999, seed=None) |
multiplier-bootstrap interval |
.sensitivity() |
SensitivityAnalysis |
.robustness_value(target=0.0, level=0.95) |
float |
.summary(), .to_frame(), .to_latex(), .to_markdown() |
report |
.plot_influence(), .plot_sensitivity_contour() |
figures |
.crossfit_ |
CrossFitOutput with every fitted quantity |
SensitivityAnalysis
| Member | Returns |
|---|---|
.theta, .sigma2, .nu2, .S |
the Eq. (55)–(57) components |
.interval(cy2=, cd2=, rho=1.0) or .interval(rv=) |
the Eq. (51) region |
.evaluate(..., level=, method=) |
SensitivityResult with endpoints, SEs and envelope |
.envelope(c, method=) |
"bonferroni" (Eq. 65), "one_sided" ([9] Thm 4), "joint" |
.grid(rhos=, r2s=, parameterization=, tail=) |
the Table 3 layout |
.contour_data(...) |
the contour-plot grid |
.robustness_value(target=0.0, level=0.95) |
[9] Definition 2 |
Other entry points
from pragdml import (PipelineDML,              # a menu, aggregated fold-wise
                     compare_information_sets,  # the Table 1 layout
                     pragmatic_dml)             # one-call wrapper
from pragdml.sensitivity import benchmark_covariate, calibrate_deletion
from pragdml.diagnostics import (omitted_information_gap, target_adaptivity,
                                 product_rate, pooling_conditions)
Methods: step → equation map
Every block of code is named against the paper. The full map is in
docs/methods.md; the essentials:
| Paper | Code |
|---|---|
| Eqs. (2)–(3), the target class | functionals.Functional |
| Eqs. (4)–(5), Riesz representation | riesz.LinearRieszLearner |
| Prop. 1, Eqs. (6)–(7) — the omitted-information identity | diagnostics.omitted_information_gap |
| Eq. (8), the orthogonal score | _core.debiased_score |
| Eqs. (11)–(12), (16) — estimator, variance, interval | _core.CrossFitOutput |
| Def. 1, Eq. (17) — target adaptivity | diagnostics.target_adaptivity |
| Def. 2, Eq. (19) — adaptive efficiency | diagnostics.adaptive_efficiency |
Def. 3 — the pipeline targets on H |
features.FeatureMap span |
| Prop. 2, Eqs. (23)–(24) | diagnostics.mixed_bias_drift |
| Lemma 2, Eqs. (28)–(29) — excess risk = squared error | diagnostics.excess_risk_identity |
| Eq. (32), the product-rate condition | diagnostics.product_rate |
| Eq. (35), the critical radius | diagnostics.critical_radius_l1_hull |
| Def. 4, Eqs. (36)–(37) — star aggregation | aggregation.star_aggregate |
| Defs. 5–6, Eqs. (40)–(49) — pooled aggregation | aggregation.pooled_*_aggregate |
| Eq. (50) — the bias factorization | sensitivity.bias_factor |
| Eq. (51) — the identified region | SensitivityAnalysis.interval |
| Eqs. (52)–(54) — the auxiliary scores | SensitivityAnalysis.scores |
| Eqs. (55)–(57) — the estimated components | CrossFitOutput.sigma2_outcome, .nu2_representer, .S |
| Eq. (64) — the endpoint influence function | SensitivityAnalysis.scores |
| Eq. (65) — the confidence envelope | SensitivityAnalysis.envelope |
| Eqs. (67)–(70) — the application's specification | AverageDerivative, VaryingCoefficientFeatures |
| [9] Def. 2 — robustness values | sensitivity.robustness_value |
| [9] App. E — covariate benchmarking | sensitivity.benchmark_covariate |
How it is verified
170 tests, run on every push. The ones that matter:
- Exact identities. Proposition 1, Proposition 2 and Lemma 2 are algebra, not
approximations, and are asserted to machine precision. Linearity of
mis checked for all six functionals. - The paper's Table 3, reproduced. All eighteen endpoints, to the last printed digit, from the published centre and scale.
- Published numbers. The naive 401(k) gap to the dollar ($19,559.3); the ATE interval containing both published figures; the robustness value at 4.2% against published 4.5% and 5.4%.
- Cross-implementation. For the ATE with an analytic representer, the Eq. (8)
score is
DoubleML's IRM score; given identical folds the two agree to within 2% of a standard error. The average derivative with a partially linear map equals the OLS slope to1e-9. - Known-truth recovery with an asserted root-
nrate, reproducibility (bit-identical under a seed), and input contracts.
Two inconsistencies found in the source paper
Documented, not papered over (both pinned by tests):
- Table 3's note says
C_Y² = C_D² = r², but its printed endpoints are only reproducible underC_D² = r²/(1−r²)— the parent paper's convention. Max residual 0.00044 under that reading against 0.00147 under the note's. This is whypragdmlkeeps both parameterizations distinct ("cy_cd"vs"rv"). - Table 2's printed
C_Y² = 0.0017is the raw numeratorR²_full − R²_text, not the ratio(R²_full − R²_text)/(1 − R²_text) = 0.001752that Section 5.4 specifies.pragdmlimplements the stated formula.
Starting from absolutely nothing
For researchers who have never typed a command.
1. Install Python
Go to python.org/downloads and install the latest version. On Windows, tick "Add Python to PATH" on the first screen.
Alternatively install Anaconda, which bundles Python with the scientific libraries.
2. Open a terminal
- Windows: press
Win, typecmd, press Enter. - macOS: press
Cmd+Space, typeTerminal, press Enter.
Check it worked:
python --version
3. Install the package
pip install pragdml
4. Write your first script
Open Notepad (or TextEdit, or IDLE, which came with Python) and save this as
my_analysis.py:
from pragdml import PragmaticDML
from pragdml.datasets import load_pension

Y, D, X = load_pension(return_X_y=True)
res = PragmaticDML(functional="ate", seed=0).fit(Y, D, X)
print(res.summary())
print("robustness value:", res.robustness_value())
Run it:
python my_analysis.py
You will get about $3,980. That is the default specification, which is linear in the covariates — and as Practical guidance explains, that is too restrictive for this dataset. The headline $7,855 comes from the spline specification shown in the worked example. Seeing the two differ is the lesson, not a bug: how you model the covariates matters more here than anything else you will choose.
5. Use your own data
If your data is in Excel or CSV:
import pandas as pd
from pragdml import PragmaticDML

df = pd.read_csv("my_data.csv")        # or pd.read_excel("my_data.xlsx")

Y = df["outcome"]
D = df["treatment"]
X = df[["control1", "control2", "control3"]]

res = PragmaticDML(functional="ate", seed=0).fit(Y, D, X)
print(res.summary())
Your treatment must be 0/1 for "ate". For a continuous treatment use
functional="average_derivative".
6. Get the table into your paper
print(res.to_latex())        # paste into LaTeX
print(res.to_markdown())     # paste into Word, Google Docs or GitHub
res.to_frame().to_csv("results.csv")
7. Working more comfortably
Install Jupyter (pip install notebook, then
jupyter notebook) or Spyder, which gives you an
editor, a console and a variable explorer in one window.
Limitations
- The paper's own application is not reproducible here. Its product data is
scraped from Keepa.com and is neither public nor redistributable.
pragdmlreproduces the paper's arithmetic (Table 3's endpoints, Table 2's calibration) but cannot reproduce its data. If the authors release it, this will be added. - No reference implementation exists for the target paper, so the compatibility
evidence is the ATE special case against
DoubleMLplus the published numbers of the parent paper — not a line-by-line match against the authors' own code. - The sensitivity parameters are assumptions.
pragdmlestimates the scaleS₀; the strengths and the alignment are yours to defend. The robustness value and the benchmarking tools exist to make that defensible, not automatic. - Oracle bounds are rate shapes, not guarantees. The universal constants in
Propositions 5–8 are unspecified in the paper; the reported numbers use
C = 1and are useful for comparing designs, not as finite-sample bounds. RieszBoostis not implemented.PartitionRieszLearnercovers the nonlinear case.0.xversioning: the API may change.
References
All DOIs verified 17 October 2026.
- A. Aradillas Fernández, V. Chernozhukov, C. Cinelli, S. Klaassen, W. Newey, M. Spindler, J. Teichert-Kluge & S. Vijaykumar (2026). Pragmatic DML with AI-Learned Representations. arXiv:2610.01935
- V. Chernozhukov, C. Cinelli, W. K. Newey, A. Sharma & V. Syrgkanis (2026). Long Story Short: Omitted Variable Bias in Causal Machine Learning. Review of Economics and Statistics. doi:10.1162/REST.a.1705
- V. Chernozhukov, W. K. Newey & R. Singh (2022). Automatic Debiased Machine Learning of Causal and Structural Effects. Econometrica 90(3):967–1027. doi:10.3982/ECTA18515
- V. Chernozhukov, D. Chetverikov, M. Demirer, E. Duflo, C. Hansen, W. Newey & J. Robins (2018). Double/Debiased Machine Learning for Treatment and Structural Parameters. The Econometrics Journal 21(1):C1–C68. doi:10.1111/ectj.12097
- S. Vijaykumar (2021). Localization, Convexity, and Star Aggregation. NeurIPS 34:4570–4581. arXiv:2105.08866
- T. Liang, A. Rakhlin & K. Sridharan (2015). Learning with Square Loss: Localization through Offset Rademacher Complexity. COLT. arXiv:1502.06134
- J.-Y. Audibert (2007). Progressive Mixture Rules are Deviation Suboptimal. NeurIPS 20.
- P. Bach, V. Chernozhukov, M. S. Kurz & M. Spindler (2022). DoubleML — An Object-Oriented Implementation of Double Machine Learning in Python. JMLR 23:1–6.
- C. Cinelli & C. Hazlett (2020). Making Sense of Sensitivity: Extending Omitted Variable Bias. JRSS-B 82(1):39–67. doi:10.1111/rssb.12348
Citing
@software{roudane2026pragdml,
  author  = {Roudane, Merwan},
  title   = {pragdml: Pragmatic double machine learning with AI-learned representations},
  year    = {2026},
  version = {0.1.0},
  url     = {https://github.com/merwanroudane/PragDML}
}
Please also cite the papers the package implements (references 1 and 2 above).
Changelog
See CHANGELOG.md.
License
MIT. See LICENSE.
Author
Dr Merwan Roudane merwanroudane920@gmail.com github.com/merwanroudane
Related packages: QuantileOnQuantile,
mqqr, qqkrls, mqqcause (CRAN).
1 maintainer

Metadata
1 maintainer
Release files for pragdml 0.1.1
For a detailed explanation of source distributions (sdists) and built distributions (wheels), please see the package formats documentation.
Source distribution (sdist)
| File | Size | Uploaded | Provenance | |
|---|---|---|---|---|
| pragdml-0.1.1.tar.gz | 270.3 kB | Without provenance | Details |
Built distribution (wheel)
| File | Interpreter | ABI | Platform | Reset |
|---|---|---|---|---|
| pragdml-0.1.1-py3-none-any.whl | Python 3 | none | any | Details |
Total release size: 516.5 kB
Release files / pragdml-0.1.1.tar.gz
| Download URL | pragdml-0.1.1.tar.gz |
|---|---|
| Size | 270.3 kB |
| Tags | Source |
|
SHA-256 checksum How to use checksums |
f8d38b7ce8275b850add662ed8156c1df42d76333698ab7c01e7570d64dc0cce
|
|
BLAKE2b-256 checksum How to use checksums |
9f961abaef720f7e338558b318321d0551b3d04fde09898b7e24cfe6e400c0c3
|
| Upload date | |
|
Uploaded using Trusted Publishing? What is trusted publishing? |
No |
| Uploaded via |
twine/7.0.0 CPython/3.11.0
|
Release files / pragdml-0.1.1-py3-none-any.whl
| Download URL | pragdml-0.1.1-py3-none-any.whl |
|---|---|
| Size | 246.2 kB |
| Tags | Python 3 |
|
SHA-256 checksum How to use checksums |
41c956fed180f5b2fc7ee7f6fd6a49640c2653d89c5722a007387fc9844ee4e6
|
|
BLAKE2b-256 checksum How to use checksums |
64e2321154bdb2491c06fcefbdc43f926881ad82acc77d319fd43c509cc9e8f3
|
| Upload date | |
|
Uploaded using Trusted Publishing? What is trusted publishing? |
No |
| Uploaded via |
twine/7.0.0 CPython/3.11.0
|
Security for pragdml 0.1.1
Provenance
Provenance describes where a file came from. On PyPI, provenance is shared via attestations, which provide a verifiable record of the build or publishing details. View details, limitations and caveats.
No provenance found
None of the files in this release were uploaded with provenance metadata.
A note on package security
PyPI is a repository for distributing packages, not a service for auditing them. While third-party security researchers and our staff do their best to detect and remove malicious packages, PyPI cannot guarantee the quality, security or suitability of any given package.
To learn more about protecting yourself from malicious actors, visit our package security documentation.














