
predictr
predict + reliability, in other words: A tool to predict the reliability.
predictr is a Python package for Weibull-based life data analysis (reliability engineering). It covers parameter estimation, bias-correction, confidence bounds, and publication-ready Weibull plots in a single, consistent API.






Installation
pip install predictr
Requires Python >= 3.6.
Quick start
from predictr import Analysis

failures = [0.4508831, 0.68564703, 0.76826143, 0.88231395, 1.48287253, 1.62876357]

weibull = Analysis(df=failures, bounds='fb', show=True)
weibull.mle()

print(weibull.beta, weibull.eta)  # shape and scale estimates
This fits a two-parameter Weibull distribution via Maximum Likelihood Estimation, adds Fisher confidence bounds, and renders the probability plot below.
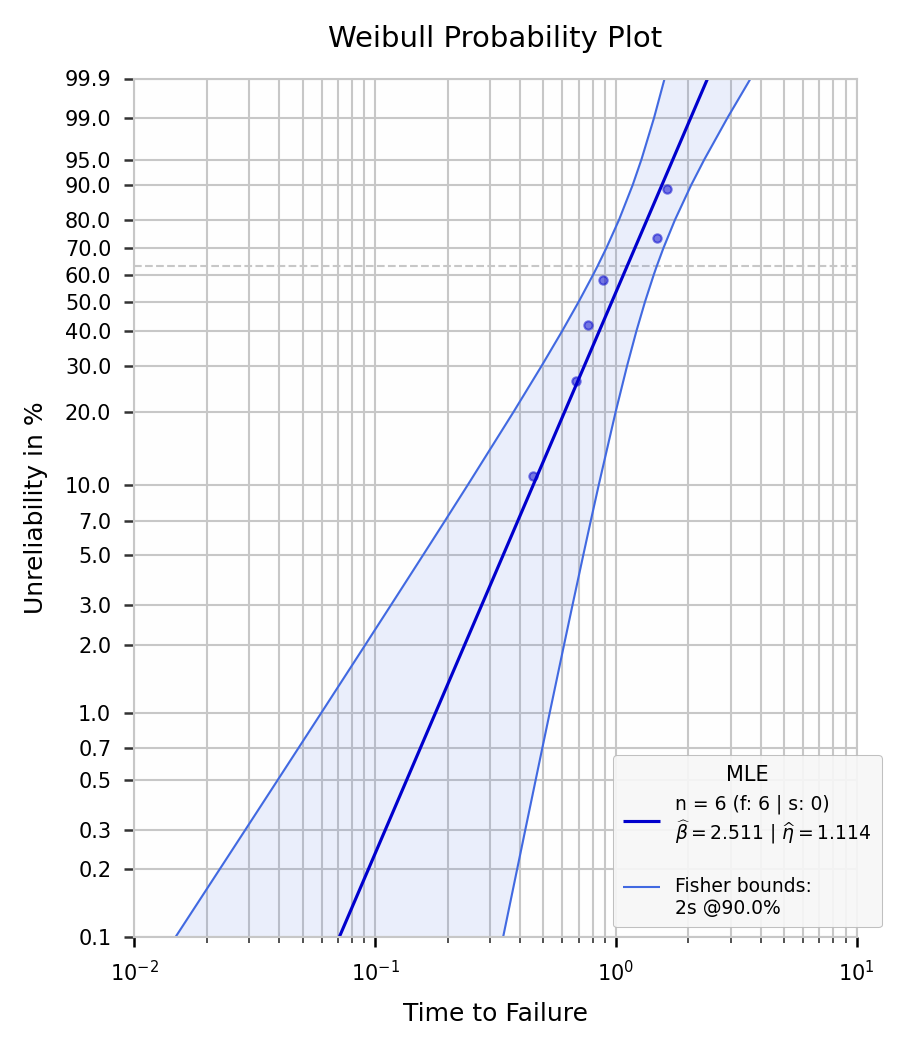
See it in action
A few of predictr's capabilities, from bias-corrected estimates to comparing entire distributions.
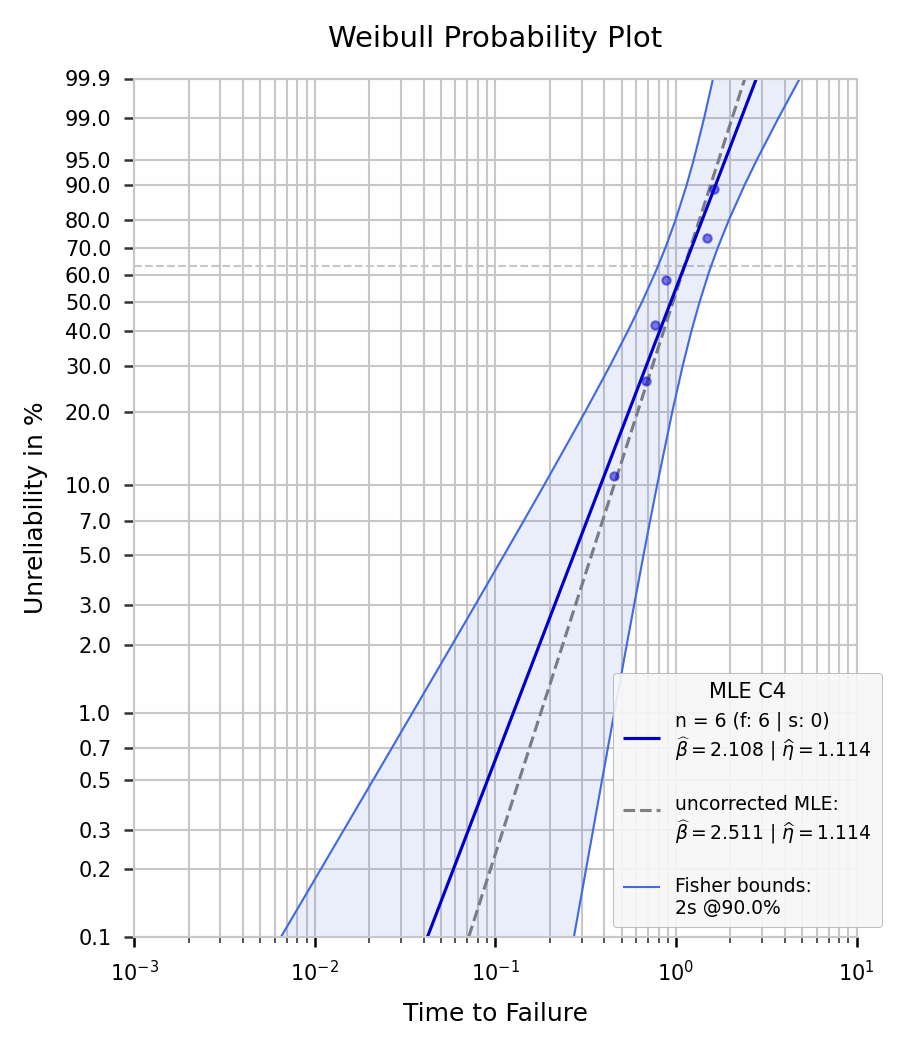
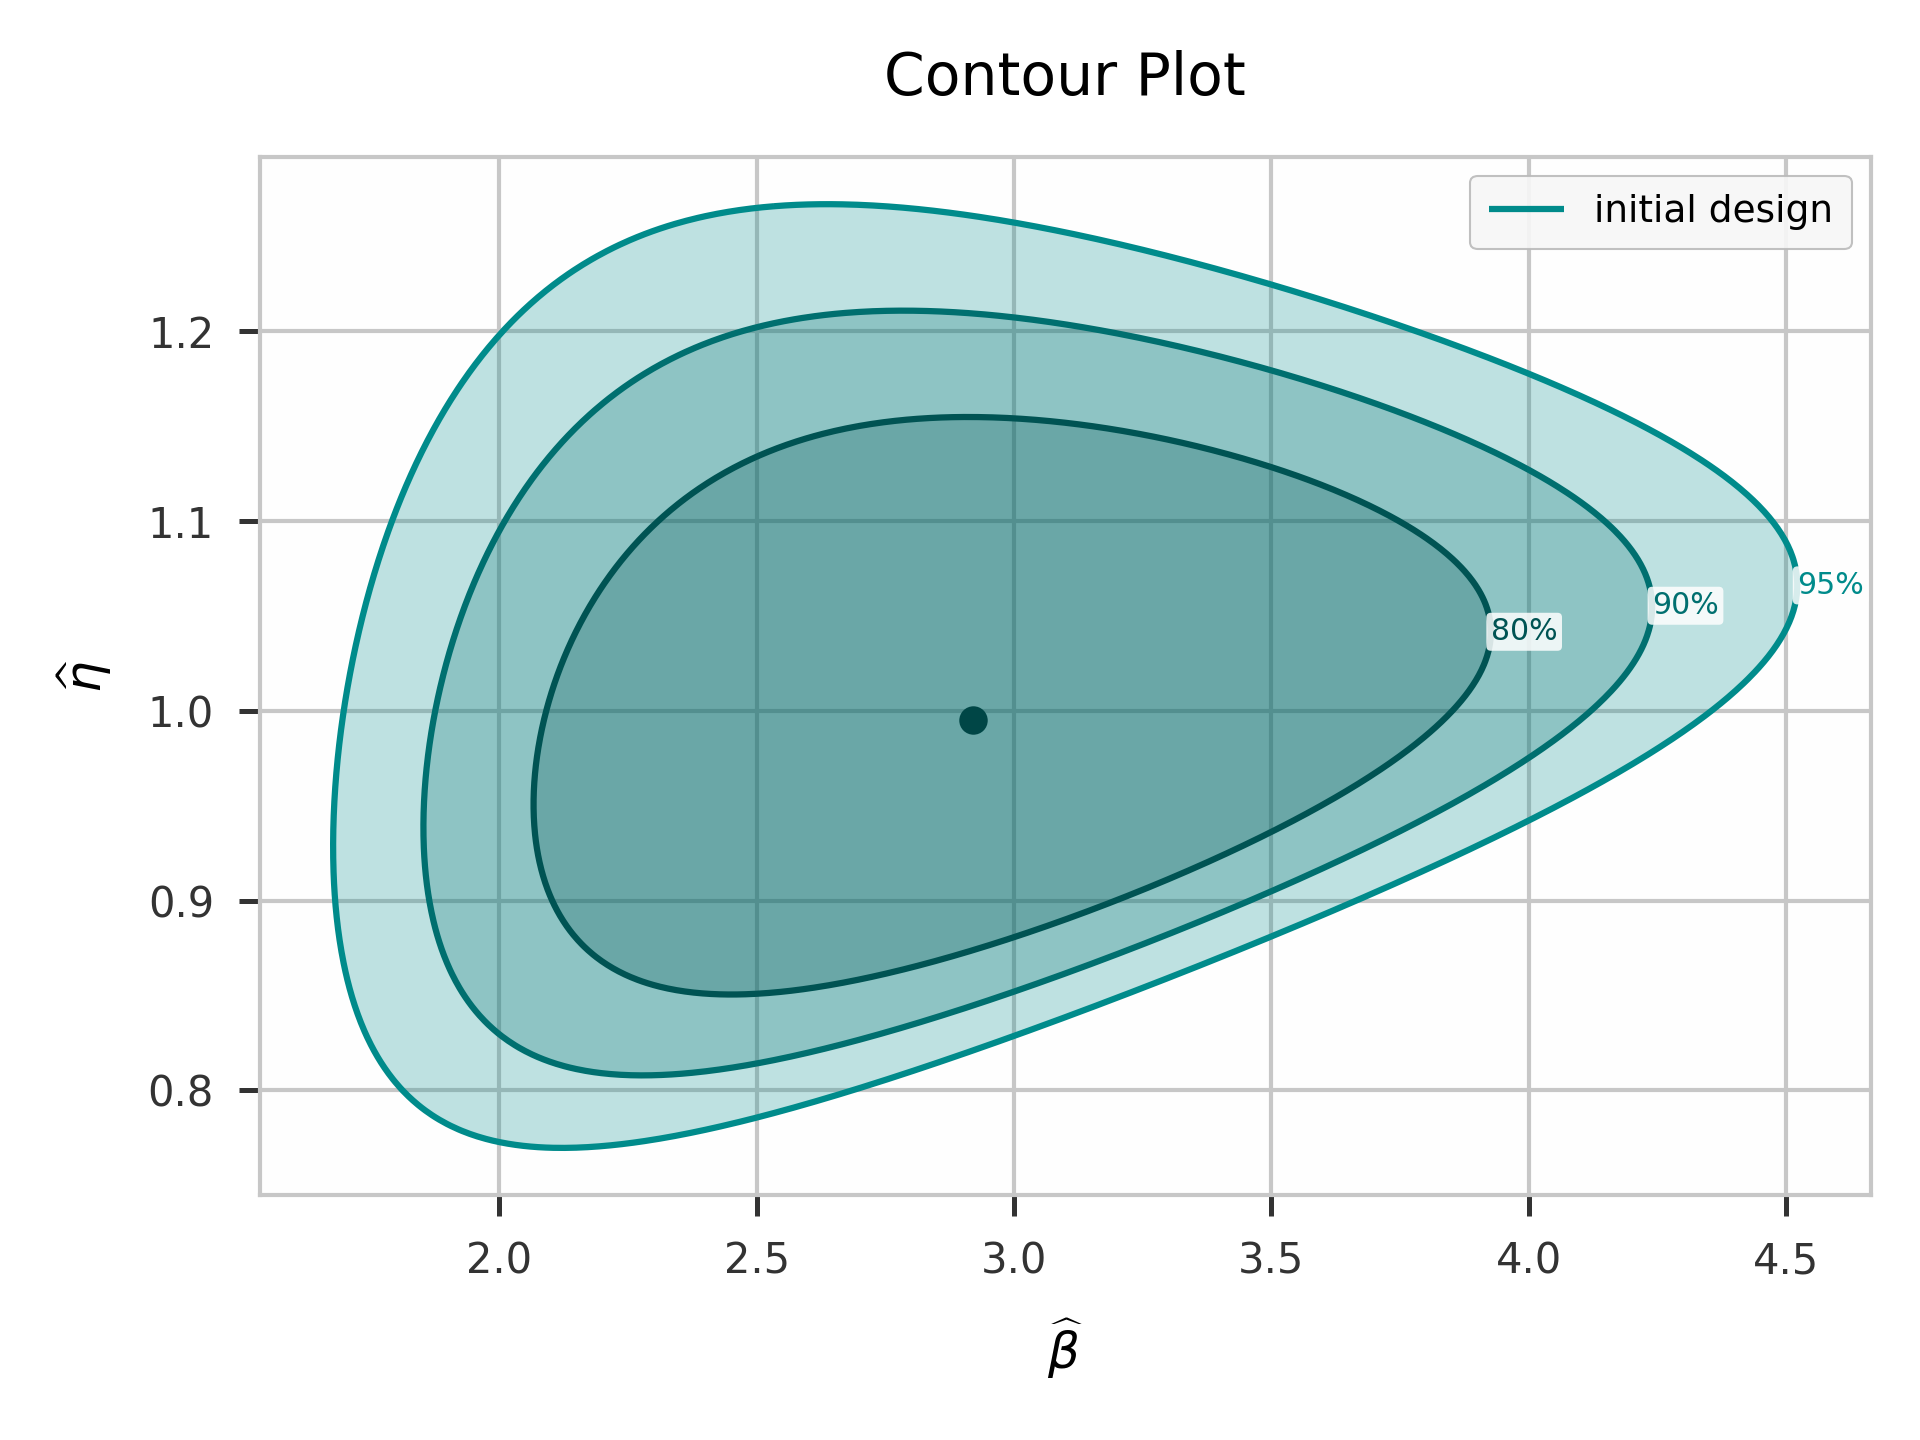
| Bias-corrected estimates | Confidence region, multiple levels |
|---|---|
 |
 |
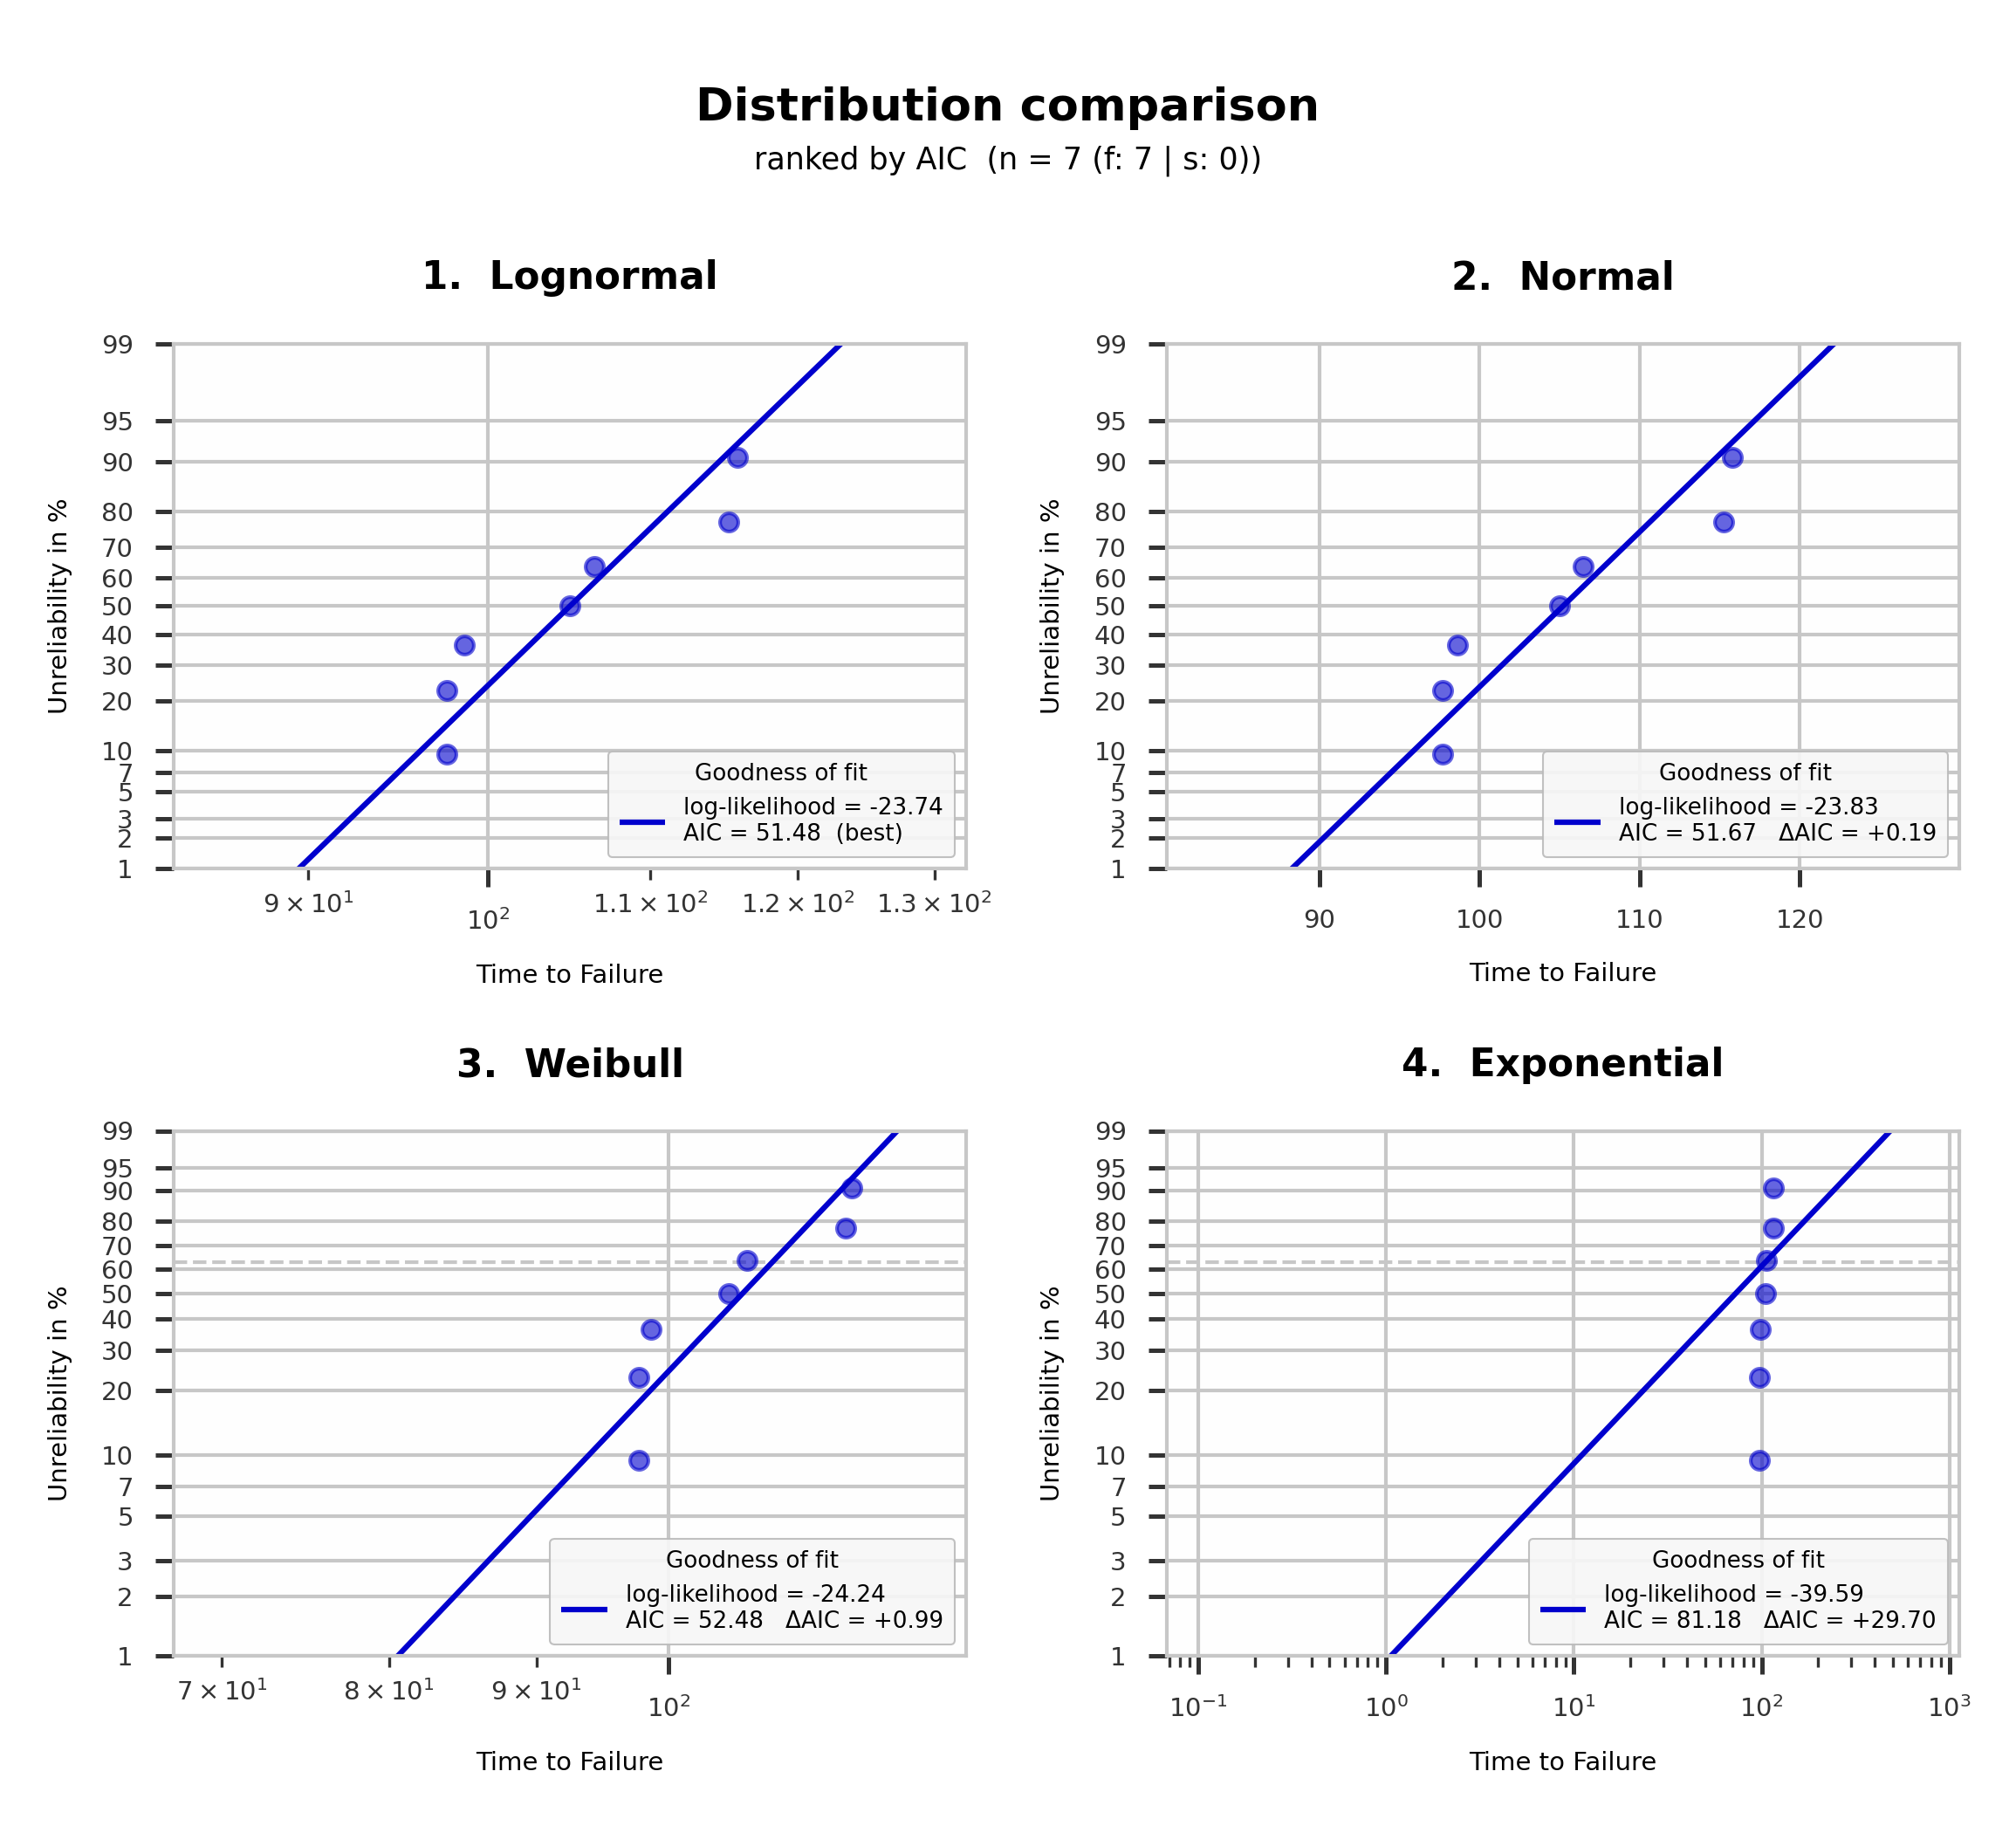
| Ranked by AIC | Distributions compared |
|---|---|
 |
 |
| Regression: survival per covariate profile | Regression: goodness of fit with verdict |
|---|---|
 |
 |
Main features
Parameter estimation
- Uncensored and type I / type II right-censored two-parameter Weibull distribution
- Maximum Likelihood Estimation (MLE) and Median Rank Regression (MRR)
- Bx-life calculator
- Normal, LogNormal and Exponential distributions, alongside Weibull
- Non-parametric Kaplan–Meier
kaplan_meier()and Nelson–Aalennelson_aalen()from the failure / suspension lists (no DataFrame), with pointwise bands and step plots
Lifetime regression (covariates)
- Weibull accelerated failure time (AFT) and Cox proportional hazards (Cox PH) models
- Uncensored and right-censored data, Efron/Breslow tie handling, Wald / profile-likelihood / bootstrap (parametric and non-parametric) bounds
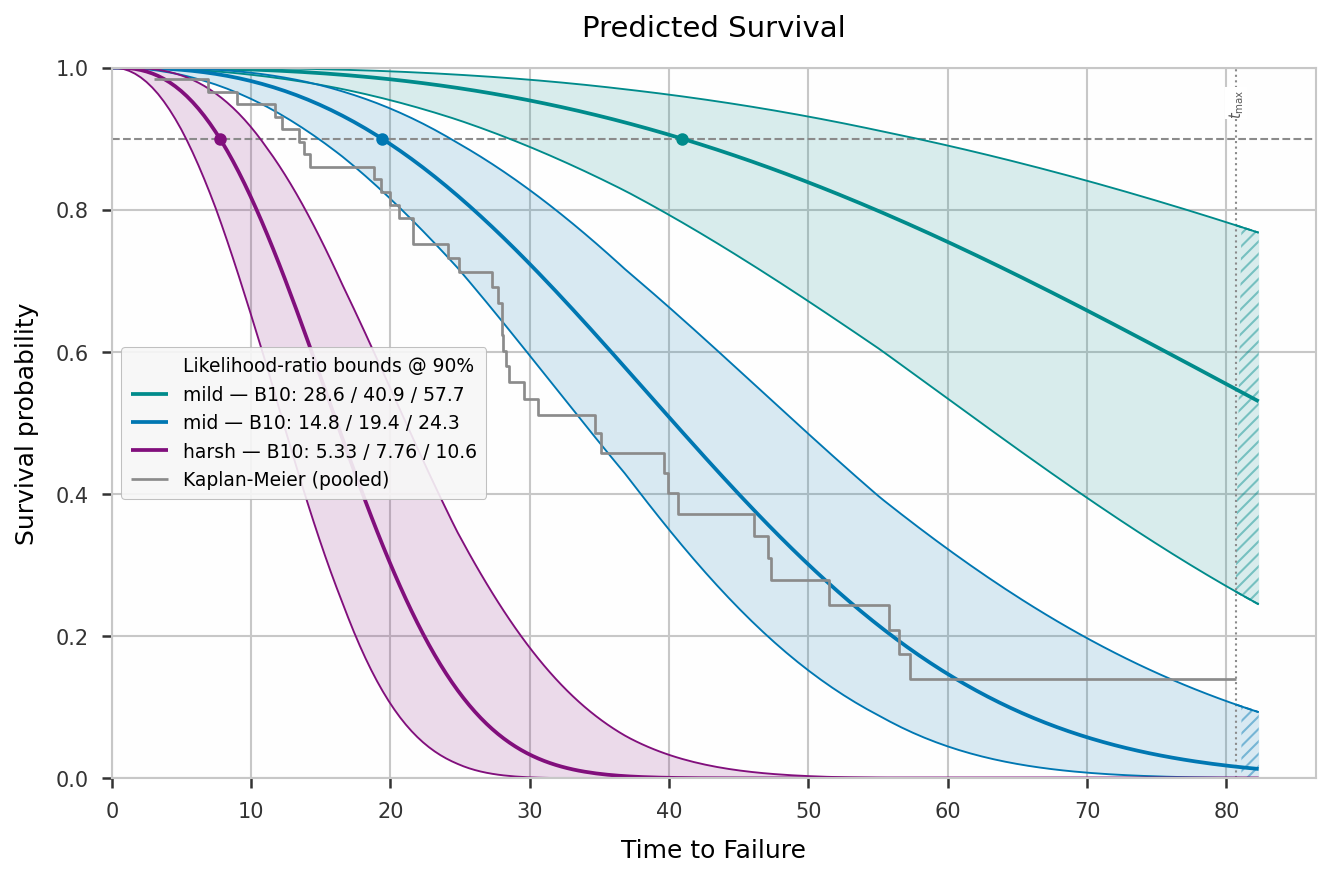
summary(), coefficient forest plot, survival-curve prediction per covariate profile (with pointwise and simultaneous confidence bands)- Goodness of fit:
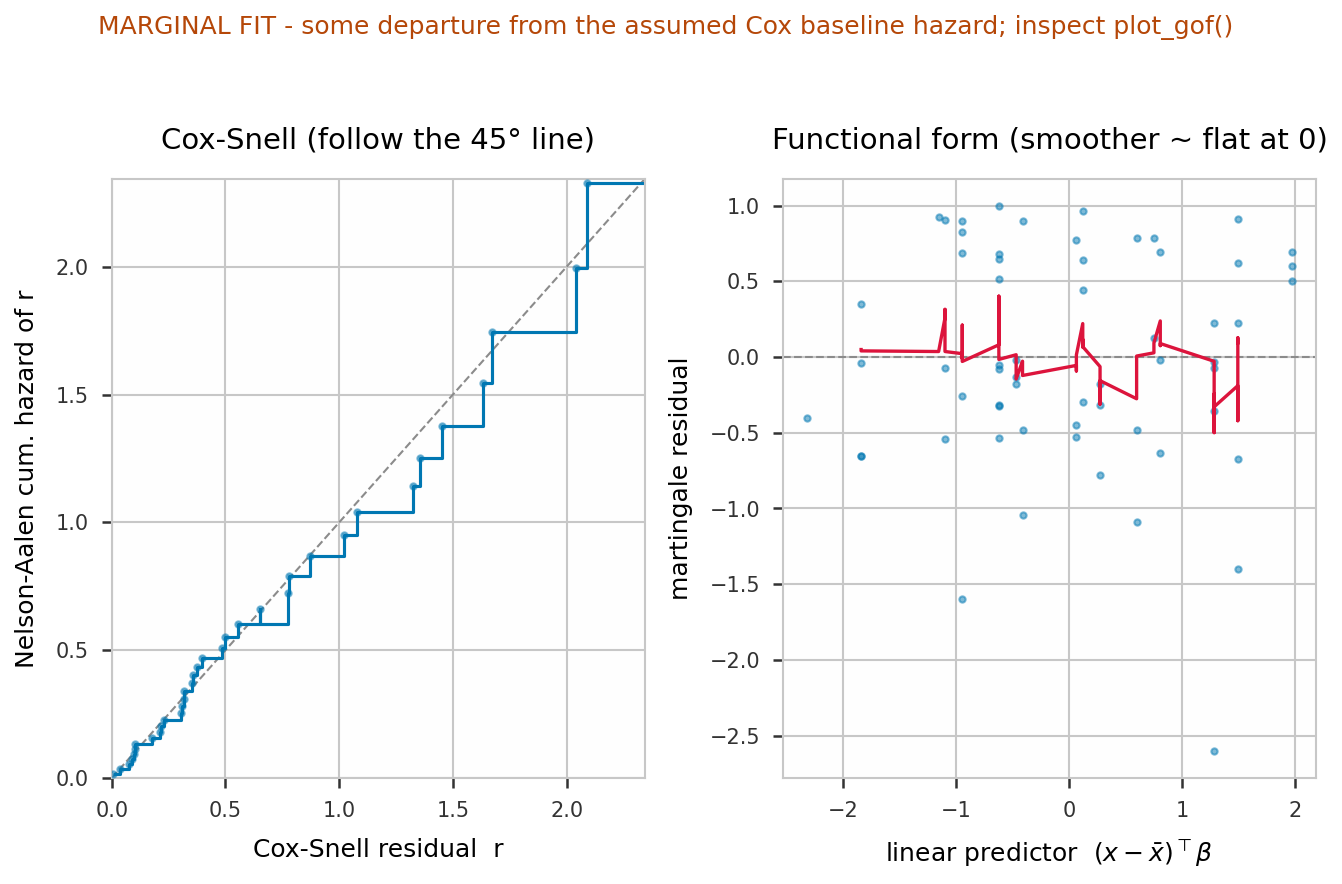
goodness_of_fit()with a good / marginal / poor verdict (concordance, Cox–Snell slope, proportional-hazards test), Cox–Snell / martingale / deviance residuals,plot_gof(),check_ph() - Non-parametric descriptors: the same
kaplan_meier()/nelson_aalen()asAnalysis, here also splittable by a covariate (by=), plusplot_km()/plot_na() - Accelerated life testing: named aging laws (
stress_model=— Arrhenius, inverse power, Eyring, Coffin–Manson), physical parameters (Ea,n) with CIs,acceleration_factor(), raw-unit predictions,plot_stress_life(),check_shape() - Monte-Carlo
power_analysis()andsample_size()
Bias-correction
- C4 method (reduced bias adjustment)
- Hirose and Ross method
- Parametric and non-parametric bootstrap correction (mean, median, trimmed mean)
Confidence bounds
- Fisher bounds
- Likelihood Ratio bounds (Weibull, Normal, LogNormal)
- Beta-Binomial bounds
- Monte Carlo Pivotal bounds
- Parametric and non-parametric bootstrap bounds
- Exact chi-square bounds (Exponential)
Plots
- Probability plots with all relevant statistics in the legend
- Multiple fits overlaid in one figure, for design comparisons
- Contour plots for the joint confidence region of shape and scale, with support for multiple confidence levels per dataset
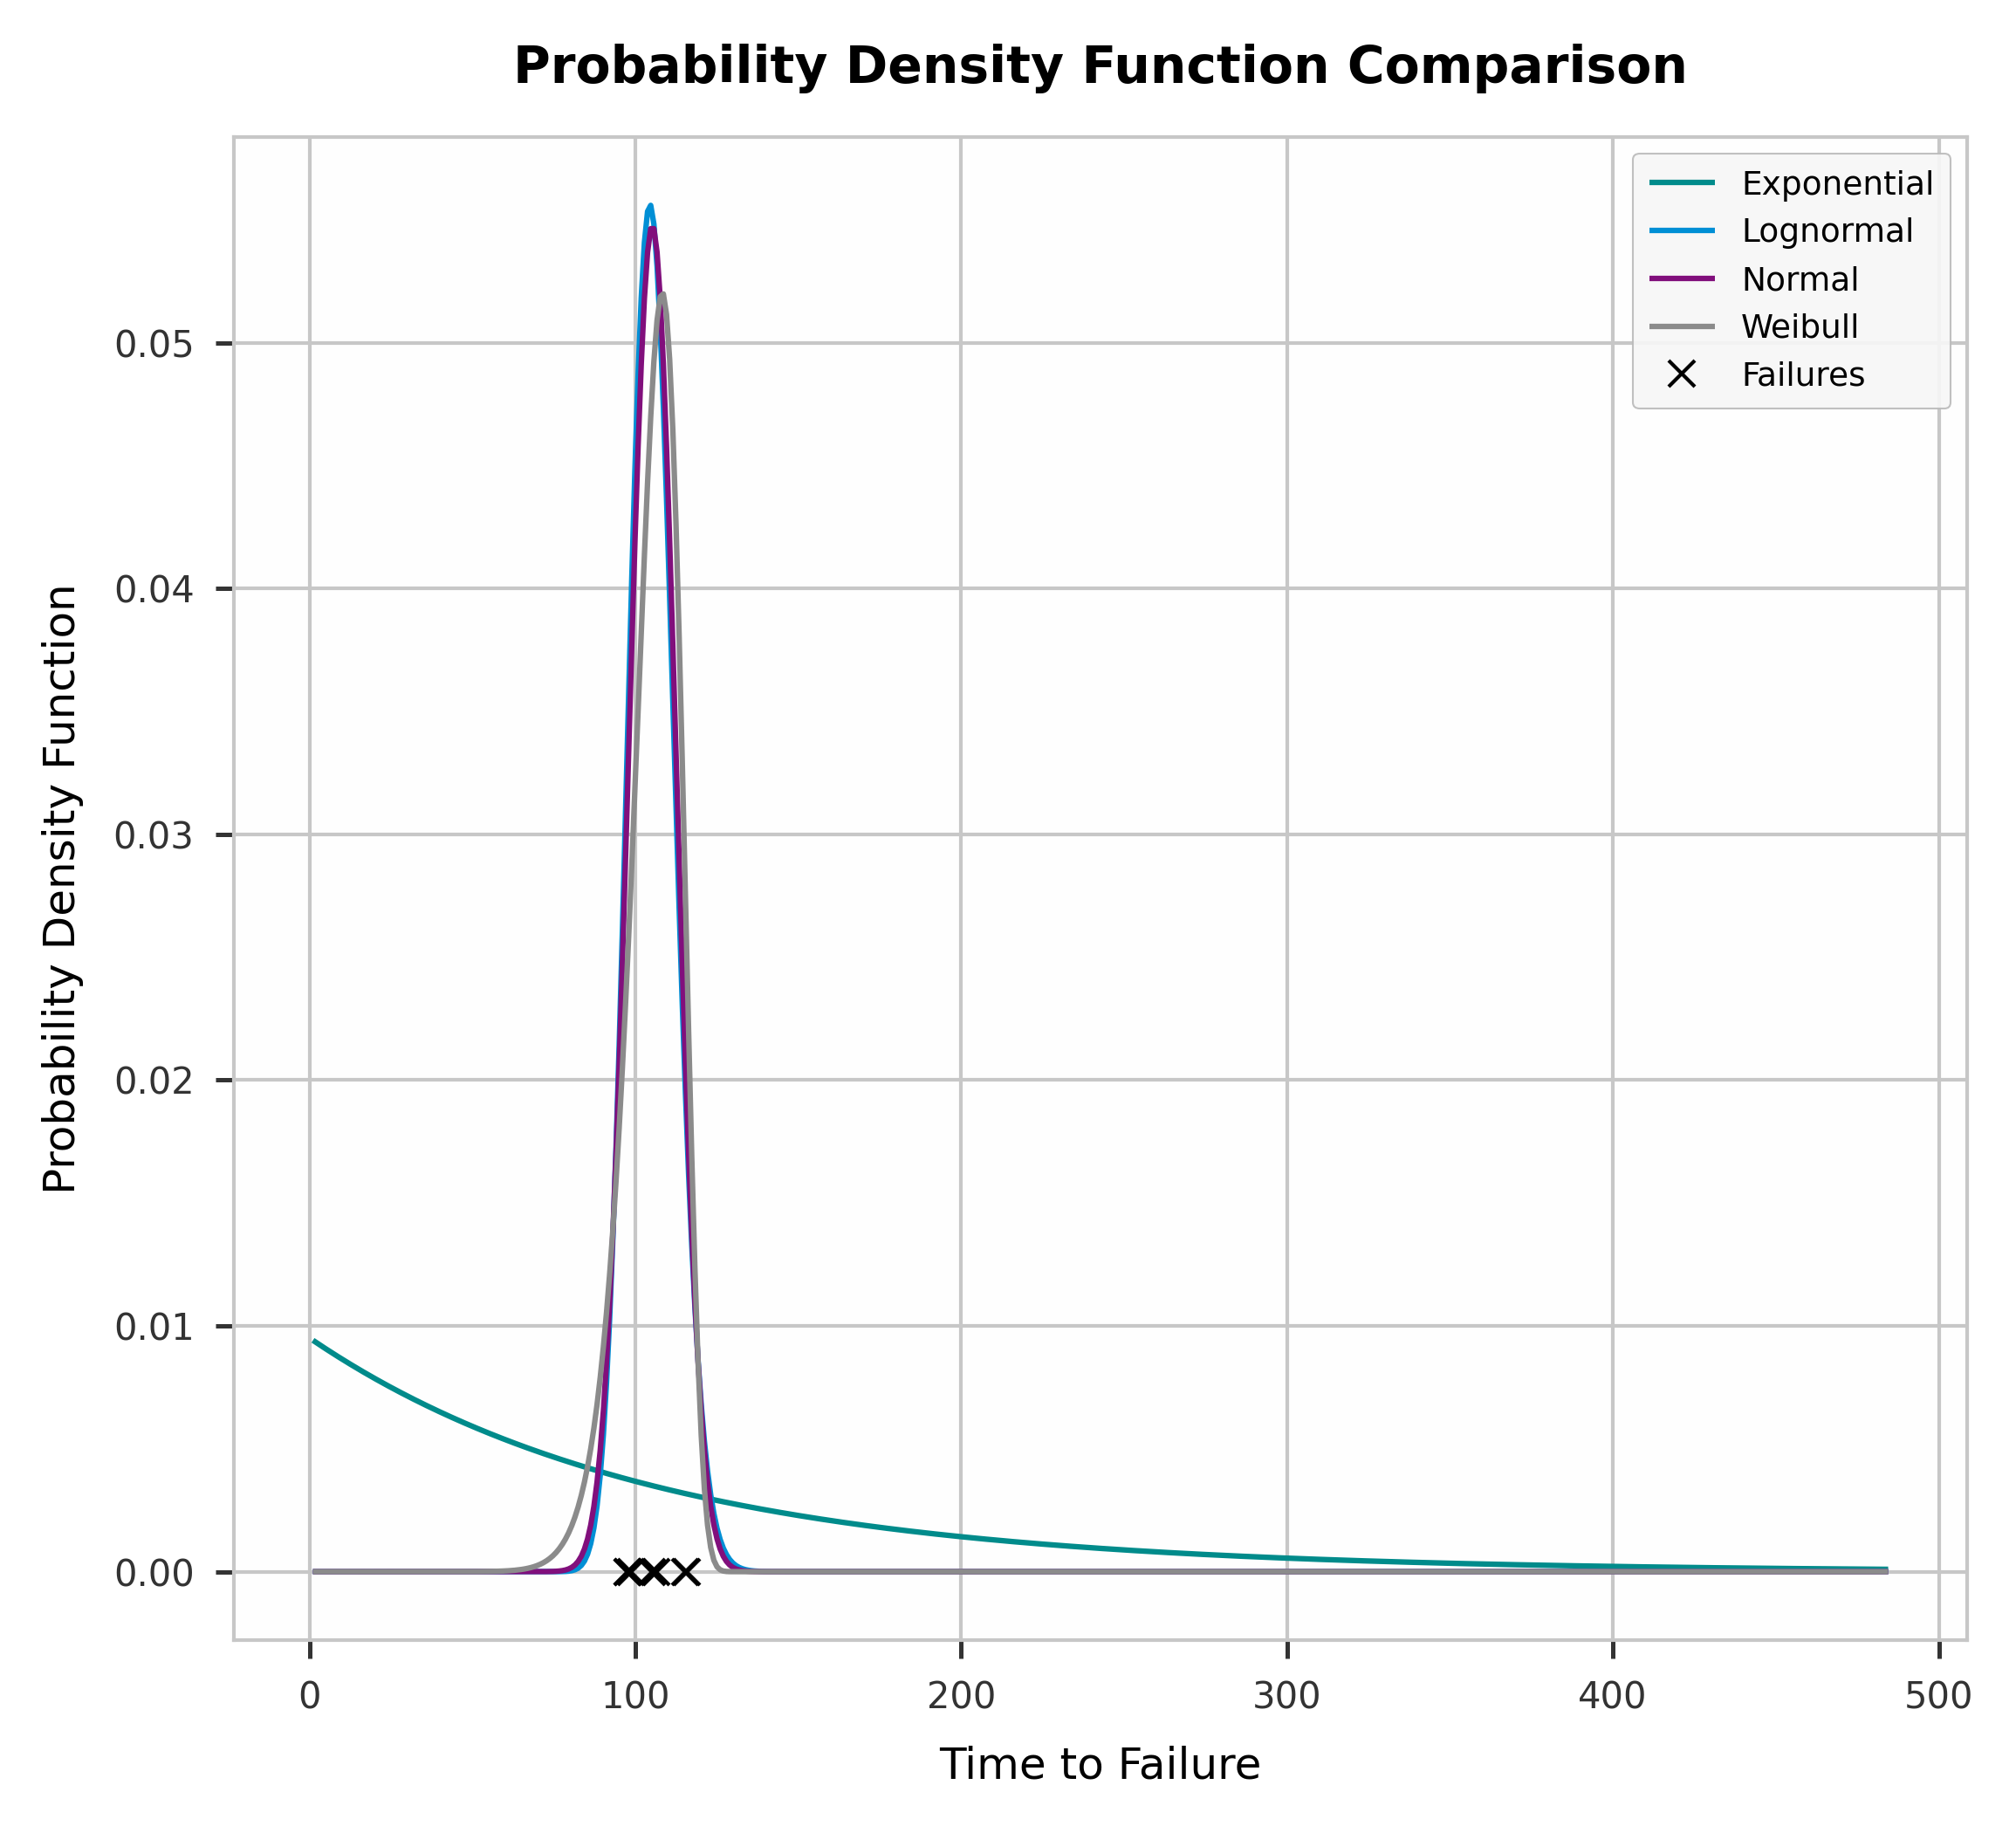
- Distribution comparison: fit every supported distribution to one dataset, ranked by AIC or Anderson-Darling, plus a combined PDF plot
See the class documentation for the full method and parameter reference, including censored-data and bias-correction examples.
Documentation and links
Citing predictr
If you use predictr in academic work, please cite it via its Zenodo DOI. See docs/citation.md for details.
License
MIT — see LICENSE.txt.
Contacte me
If you have any questions and / or suggestions, don't hesitate to contact me.
1 maintainer

Metadata
1 maintainer
Release files for predictr 0.1.37
For a detailed explanation of source distributions (sdists) and built distributions (wheels), please see the package formats documentation.
Source distribution (sdist)
| File | Size | Uploaded | |
|---|---|---|---|
| predictr-0.1.37.tar.gz | 4.4 MB | Details |
Built distribution (wheel)
| File | Interpreter | ABI | Platform | Reset |
|---|---|---|---|---|
| predictr-0.1.37-py3-none-any.whl | Python 3 | none | any | Details |
Total release size: 4.5 MB
Release files / predictr-0.1.37.tar.gz
| Download URL | predictr-0.1.37.tar.gz |
|---|---|
| Size | 4.4 MB |
| Tags | Source |
|
SHA-256 checksum How to use checksums |
fe0e20ecaf47df27c0c4c1f0cf5cf66fb209e4ae8734e42560e22468bc24593b
|
|
BLAKE2b-256 checksum How to use checksums |
f87f54027c407b80bffef7f9c643e6ee8aa9115bfe5f1a7354bcb8b0beba054d
|
| Upload date | |
|
Uploaded using Trusted Publishing? What is trusted publishing? |
No |
| Uploaded via |
twine/6.2.0 CPython/3.9.7
|
Release files / predictr-0.1.37-py3-none-any.whl
| Download URL | predictr-0.1.37-py3-none-any.whl |
|---|---|
| Size | 102.3 kB |
| Tags | Python 3 |
|
SHA-256 checksum How to use checksums |
13d49af8a7c8a71a8b88decad659d9eae0e6efd65a09a5b0ac4b3e1c7598d630
|
|
BLAKE2b-256 checksum How to use checksums |
d72c3c8c7b339d1def17ccada9610e7e4f57253ad85a0a12efb6685e6c680d80
|
| Upload date | |
|
Uploaded using Trusted Publishing? What is trusted publishing? |
No |
| Uploaded via |
twine/6.2.0 CPython/3.9.7
|














