
Prefixwise
Find out why your LLM prompt cache missed, what the miss cost, and how to fix it.
Prompt caching is what makes long agent sessions affordable: a request that starts with the same tokens as the last one reads them from cache, at a fraction of the price, and skips recomputing them. One changed byte early in the prompt (a timestamp in the system prompt, tools sent in a new order, an edited earlier message) and everything after it is paid for again. Providers and engines report how many tokens missed, not why. Prefixwise is a local proxy between your agent and the model (Claude, OpenAI, or a self-hosted vLLM or SGLang) that names the cause of every miss, says whether it was waste or a legitimate change, prices it, and tells you the fix.
Results
Every number below is from a live run against real models; each links to its record.
| What was tested | Setup | Result |
|---|---|---|
| Agrees with Anthropic's own miss reason | Claude Haiku 5.5, 7 kinds of miss, Anthropic's diagnostics chained | 32 of 32 misses Anthropic named, across 6 kinds; on 5 parameter changes Anthropic answered unavailable (no verdict) and Prefixwise named the parameter (1, 2) |
| Names injected causes on open models | 120 turns, 9 causes, Qwen3-4B on vLLM 0.33, vLLM + LMCache, SGLang 0.5.23 | 120 of 120 on each (vLLM, LMCache and SGLang) |
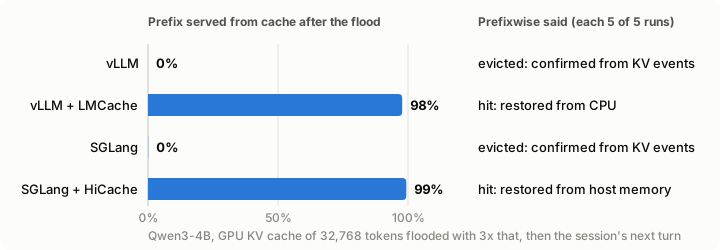
| Tells engine eviction from everything else | GPU KV cache flooded 3x; vLLM, SGLang, with and without LMCache / HiCache | evictions 5 of 5, confirmed from the KV events of vLLM and of SGLang; prefixes restored from CPU counted as hits 5 of 5 (record, SGLang events) |
| A fix pays what it predicts | --fix canonical_tools on 60 paired requests with tool-order drift |
99.9% (Claude) and 97.5% (vLLM) of predicted savings realised, task success unchanged (record) |
| Works with real agents | prefixwise run with Claude Code, Codex CLI, opencode, Anthropic and OpenAI SDKs |
all five (record); opencode building a small CLI: 92% cached, 0 avoidable tokens (record) |
| Costs almost nothing | proxy overhead and throughput, measured on a VM | 3 ms per request at 2k tokens, 13 ms at 120k; 185 requests/s per process (record) |
Not yet measured live: agreement with OpenAI's own miss reason (its diagnostics returned
unavailable on every call we made), TTL expiry and routing misses in real traffic, and how
often "not an eviction" occurs in real agent traffic. Limits has the full list.
Turning on a fix: what Prefixwise predicted, and what it saved
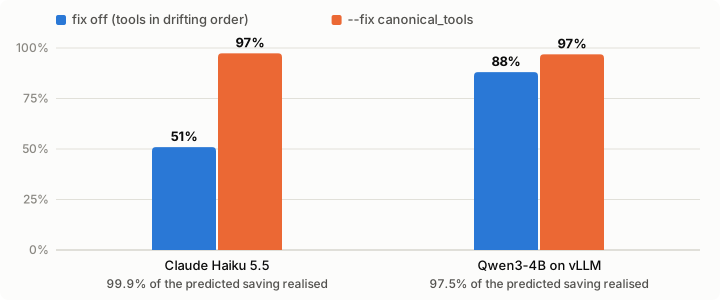
An agent sent the same tools in a drifting order, so every reorder re-paid the whole prefix.
Prefixwise named the cause (tool_reserialize) and predicted the saving; turning on
--fix canonical_tools then realised almost exactly that, with task success unchanged.
| cached, fix off | cached, fix on | predicted saving | realised | |
|---|---|---|---|---|
| Claude Haiku 5.5 | 114,835 of 225,395 (51%) | 219,451 (97%) | 104,732 tokens | 104,616 (99.9%) |
| Qwen3-4B on vLLM | 138,928 of 157,706 (88%) | 152,800 (97%) | 14,229 tokens | 13,872 (97.5%) |
The saving is larger on Claude because Anthropic puts tools first in the prompt, so a reorder
loses everything after them; Qwen3's template puts tools after the system prompt
(record). Charts are drawn from the records by
docs/figures/make_figures.py.
Why Prefixwise
- The cause, not the count. 19 causes, one per miss: the first thing, in prompt order, that broke reuse. Each comes with whether it was waste and what to change.
- Priced. Avoidable tokens and dollars, from the provider's own usage and a dated price table. Join requests to tasks and you get tokens per successful task.
- Evidence, not guesses. Where the provider explains a miss (Anthropic), Prefixwise checks
itself against it. Behind vLLM or SGLang it reads the engine's KV-cache events to confirm an
eviction, or rule it out. When the evidence is missing it says
unknown. - Zero setup.
prefixwise run -- <your agent>and read the report when it exits. Or change one base URL; responses come back unchanged. - Data first. Every request is a row of facts: an HTTP API (
/api/v1), JSONL or CSV export, and the same numbers in the CLI (docs/DATA.md). - Private and light. Hashes are stored, never prompts. Standard library only; Python 3.10+.
Quickstart
pip install prefixwise
prefixwise run -- claude                     # or any agent: your command after the --
prefixwise run starts the proxy, points the agent at it (ANTHROPIC_BASE_URL, OPENAI_BASE_URL; the agent keeps its own API key), and when the agent exits prints what that run's cache did, in plain English:
42 requests, 1,812,400 prompt tokens, 91% served from cache. Cost $3.08.
Avoidable: 96,500 tokens ($0.26), 5.3% of prompt tokens. Fix these, biggest first:
  1. The system prompt changed only in a date, time or id (14 requests, 88,200 tokens, $0.24).
     Fix: Move dates, times and ids out of the system prompt, to the end of the prompt or the latest user message.
  2. The same tools were sent in a different order or format (3 requests, 8,300 tokens, $0.02).
     Fix: Send tools in a fixed order with deterministic serialization (...)
     Prefixwise can do it for you: prefixwise serve --fix canonical_tools (proven)
Expected misses (not waste): 2 x first request of a session: nothing to reuse yet; 1 x switched model: each model has its own cache.
(Illustrative output. prefixwise run --mock -- <agent> tries it with synthetic responses and no API calls.)
On a Claude Pro or Max plan? A proxy cannot sit in front of a subscription login, but Claude Code keeps a log of every session. Read those instead, no setup and nothing sent anywhere:
prefixwise import claude-code # reads ~/.claude/projects (subagents included), read-only
It reports the same way, plus a line per agent (the main conversation, each subagent type), so subagent cost is visible. The logs record each response's usage (cache reads, and writes kept for 5 minutes or 1 hour), not the prompt itself, so a cause is named only from what the log shows changed in the cached prefix: a model switch, a compaction, a Claude Code upgrade, a changed system prompt, an effort change, an expired cache (ttl_shortened when 1 hour was asked and 5 minutes kept), or Anthropic's own diagnosis when present. What Claude Code appends mid-conversation (deferred tools, MCP and skill updates, the date) does not break the cache and is never blamed. Anything else is unknown, and says so. Dollars are API prices, what the usage is worth. Rows go to prefixwise-claude-code.db (apart from any proxy ledger, so nothing counts twice); run it again later and it adds only new requests.
Codex, signed in with ChatGPT? The same, from Codex's own logs: prefixwise import codex (reads ~/.codex). It names a model switch, a compaction, or a changed tool catalog; OpenAI's cache lifetime is not a fixed number, so other misses stay unknown. Checked on real Codex 0.167 logs.
Ctrl-C goes to the agent as usual. If you already set ANTHROPIC_BASE_URL or OPENAI_BASE_URL (a gateway), Prefixwise forwards there, so the agent reaches the same place. It works with agents that use an API key; an agent signed in with a subscription instead cannot be routed through a proxy, and the report says so if the provider rejects it. Codex ignores OPENAI_BASE_URL, so prefixwise run -- codex ... adds -c settings that point it at the proxy as a custom provider (plain HTTP, the key from OPENAI_API_KEY, no sign-in screen, nothing written to ~/.codex).
Running the proxy yourself
For a long-running proxy, start it and point any OpenAI- or Anthropic-compatible client at it:
prefixwise serve --mock # no API key, synthetic responses; try it first
from openai import OpenAI
client = OpenAI(base_url="http://127.0.0.1:8080/v1", api_key="sk-...",
                default_headers={"X-Prefixwise-Task-Id": "fix-bug-42", "X-Prefixwise-Session-Id": "fix-bug-42"})
raw = client.chat.completions.with_raw_response.create(model="gpt-5.6", messages=[...])
print(raw.headers["x-prefixwise-cause"], raw.headers["x-prefixwise-avoidable-tokens"])
Then:
prefixwise task fix-bug-42 --success         # when the task ends (or POST /tasks)
prefixwise report                            # what the cache did, and what to fix (--detail for tables)
prefixwise report --by agent_id              # compare agent / prompt versions per successful task
prefixwise explain examples/session.jsonl    # offline: diagnose a saved session (examples/ is in this repo)
For real traffic, drop --mock and name the upstream; your client's own API key is passed through:
prefixwise serve --upstream https://api.openai.com       # OpenAI: /v1/chat/completions, /v1/responses
prefixwise serve --upstream https://api.anthropic.com    # Anthropic: /v1/messages
prefixwise serve --upstream http://127.0.0.1:8000        # vLLM / any OpenAI-compatible server
docker build -t prefixwise . && docker run -p 127.0.0.1:8080:8080 -v pw:/data prefixwise   # mock in Docker
In your own code, or behind LiteLLM: no proxy
Wrap the SDK client you already have. Calls go straight to the provider, unchanged; each completed call is classified and recorded exactly as the proxy would:
import prefixwise
from anthropic import Anthropic                       # or OpenAI(), AsyncOpenAI(), AsyncAnthropic()

client = prefixwise.wrap(Anthropic())                 # ledger: ./prefixwise.db (or PREFIXWISE_LEDGER_PATH)
with prefixwise.session("fix-bug-42", task_id="fix-bug-42"):
    client.messages.create(...)                       # then `prefixwise report`, as above
Every call through LiteLLM (the SDK or its proxy server), with no change to your calls:
import litellm
from prefixwise.litellm_callback import PrefixwiseCallback
litellm.callbacks = [PrefixwiseCallback()]
# LiteLLM proxy server, config.yaml
litellm_settings:
  callbacks: prefixwise.litellm_callback.prefixwise_callback
Sessions come from LiteLLM's litellm_session_id, else metadata={"session_id": ..., "task_id": ..., "agent_id": ...}, else user. What is classified is the request LiteLLM actually sent the provider, after its translation and with the cache breakpoints it injects; Claude through Anthropic, Vertex AI or Bedrock is judged by Anthropic's rules and prices. Answers from LiteLLM's own response cache reached no provider and are not recorded. wrap covers create and parse (and with_raw_response), Anthropic's beta.messages too. Both record non-streamed calls for now (streams pass through unrecorded), never change a request (fixes are a proxy feature), and can never break a call: a recording failure is reported once and ignored.
More: docs/USE_CASES.md walks through eight concrete scenarios: a bill that jumped, a CI gate on prompt changes, A/B-testing prompt versions per successful task, Anthropic TTL choice, self-hosted vLLM, and more.
What it tells you
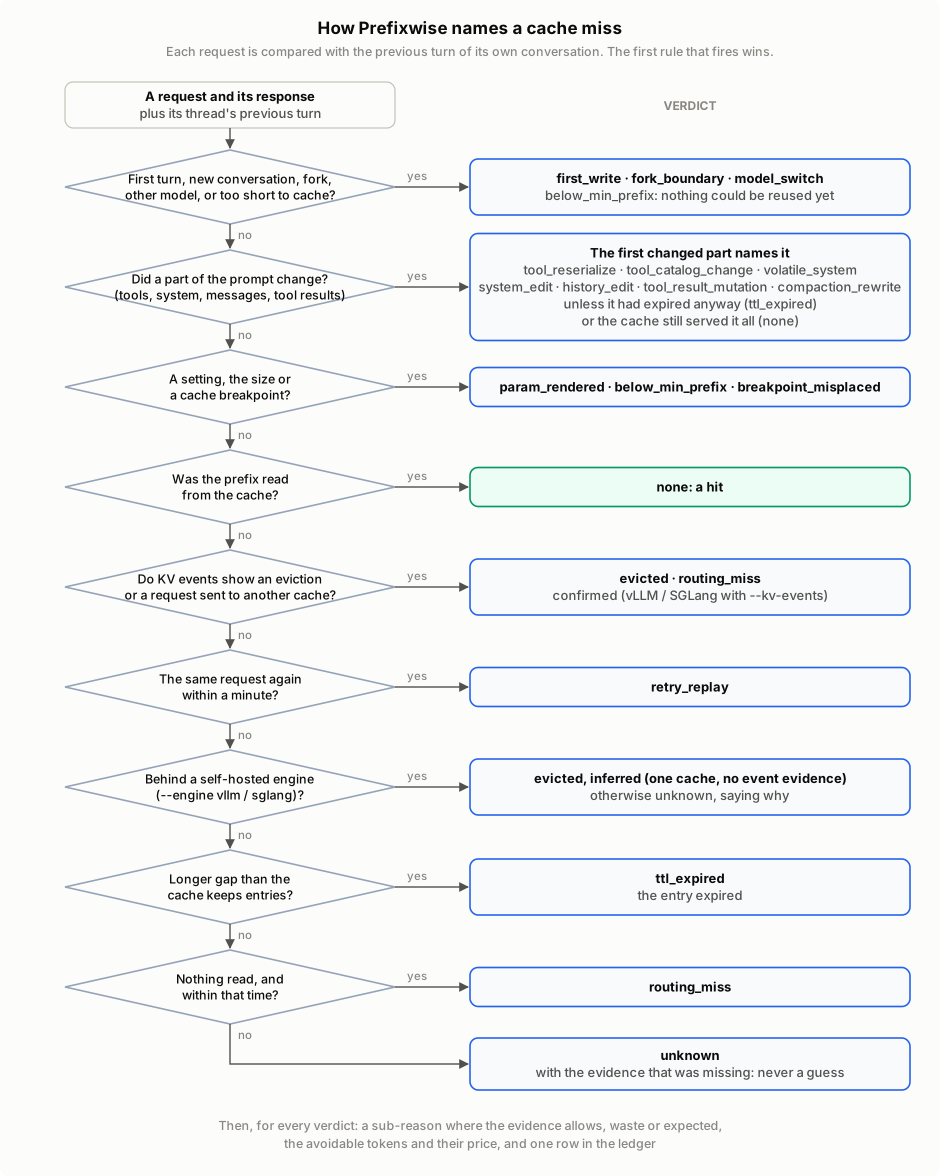
One cause per request: the first thing, in prefix order, that broke reuse. Each request is compared with the previous request to the same model in its session, so an agent's small-model side calls (titles, summaries) never mask what is happening on its main thread. Waste is avoidable; legitimate changes cost tokens but are not waste.
| Cause | Meaning | Waste? | Typical fix |
|---|---|---|---|
none |
Prefix reused; only new content was uncached | no | - |
first_write |
First request of a session | no | - |
volatile_system |
Only dates, times, ids or numbers changed in the system prompt | yes | Move volatile values to the end of the prompt |
system_edit |
The system prompt's wording changed | depends | Batch prompt edits; avoid per-turn rewording |
tool_reserialize |
Same tools, different order or bytes | yes | Sort tools; serialize deterministically |
tool_catalog_change |
A tool was added or removed | no | Mask tools instead of removing them, if frequent |
history_edit |
Earlier messages were rewritten without a compaction | yes | Append, do not rewrite history |
tool_result_mutation |
An earlier tool result was re-rendered or removed | yes | Freeze tool output once sent |
compaction_rewrite |
Context was compacted (send X-Prefixwise-Compaction-Event: 1) |
no | Compact at task boundaries, not per turn |
param_rendered |
Blocks equal, but tool_choice / thinking / reasoning / format changed | depends | Keep those params stable within a session |
model_switch |
First call to a different model in the session | no | - |
retry_replay |
Identical request within 60 s with nothing cached | yes | Check retry logic |
breakpoint_misplaced |
Anthropic: no cache_control breakpoint |
yes | Add cache_control after the stable prefix |
below_min_prefix |
Prompt below the provider's minimum cacheable length | depends | - |
ttl_expired |
Gap since the last turn exceeded the cache TTL | no | Longer TTL (e.g. Anthropic ttl: "1h") if gaps are common |
routing_miss |
Prompt and timing fine, still nothing cached | no | Set a stable prompt_cache_key / session affinity |
fork_boundary |
First turn of a forked session (X-Prefixwise-Fork-Of) |
no | - |
evicted |
Engine evicted this session's blocks | depends | More KV cache memory |
unknown |
Not enough evidence; never guessed | - | Send TTL / session headers, or check engine events |
Avoidable tokens for a waste turn = the part of the previous turn's prompt that could have been read from cache but was not. Appended content is never counted.
The why behind the cause. Where the evidence allows, a miss also gets a detail, for the ways agents break the cache in practice (from Claude Code, Codex, opencode and LiteLLM issue reports in 2026). Each is claimed only from facts in hand: the request bodies, the provider's usage, what this proxy saw in flight.
| Detail | Under | What happened | What to do |
|---|---|---|---|
ttl_shortened |
ttl_expired |
Every breakpoint asked for a 1-hour cache; Anthropic's usage shows the write was kept for 5 minutes, and more than 5 minutes passed | Check what downgrades the TTL (client version, settings, gateway) |
lookback_exceeded |
breakpoint_misplaced |
Prompt provably unchanged, gap within 5 minutes, but the previous write is 22+ positions back (Anthropic checks 20; a run of tool calls or results is one) | Add a breakpoint at the start of each turn |
markers_ignored |
any miss | cache_control on the last block, prompt of 8,192+ tokens, yet nothing written or read |
Check that no gateway strips the markers, and that the endpoint caches |
sent_before_cache_written |
first request | Sent within a second of another request (same model, key, tools, system) still waiting for its response | Stagger parallel requests (subagents, fan-outs) or warm the prefix first |
shared_prefix_not_reused |
first request | Anthropic: another session had just written an entry for the same model, key, tools and system prompt, within reach of a breakpoint here, yet little was read | Check cache keys, TTLs and breakpoint placement between the two |
thinking_stripped |
history_edit |
On a model that keeps earlier thinking (Opus 4.5+, Sonnet 4.6+, Haiku 5.5, Fable, Mythos), the only change is removed thinking blocks | Keep thinking blocks in history (client or gateway setting) |
cache_key_changed |
routing, expiry | OpenAI prompt_cache_key changed between turns |
Keep one key per conversation |
Each detail is claimed only when all of its conditions hold; otherwise there is none. prefixwise report lists them under each cause; /api/v1/breakdown?by=detail and ?detail= slice by them.
Reference
CLI
| Command | |
|---|---|
prefixwise serve [--upstream URL] [--mock] [--fix canonical_tools] [--engine vllm|sglang] [--kv-events ENDPOINT] [--host H] [--port P] [--ledger FILE] |
Run the proxy. --engine/--kv-events: see Self-hosted engines. Ledger defaults to ./prefixwise.db. --fix applies an opt-in, reversible rewrite to every request (see below). |
prefixwise run [--mock] [--fix NAME] -- <agent> |
Run an agent through Prefixwise and report on that run when it exits. |
prefixwise prices [--json] |
The dated price table behind dollar costs, and where each rate came from. |
prefixwise prune --older-than 30d |
Delete ledger entries older than that (retention). Add --include-undated to also drop rows written before 0.3.1. |
prefixwise export [--format jsonl|csv] [--since 7d] [--where session=s1] |
Every ledger row (facts, never prompt text) for a spreadsheet, notebook or warehouse. |
prefixwise fixes [--json] |
The fixes that would save the most, ranked by the avoidable tokens your own ledger attributes to each cause. |
prefixwise report [--by cause|session_id|agent_id|model|provider|task_id] [--json] |
Totals and a breakdown, most avoidable first. |
prefixwise task ID --success|--failure |
Record a task outcome (safe while the proxy runs). |
prefixwise request REQUEST_ID [--json] |
One request's ledger entry (from X-Prefixwise-Request-Id). |
prefixwise explain A.json B.json / explain SESSION.jsonl [--json] [--fail-on-waste] |
Offline diagnosis of saved request bodies, or {"request": ..., "usage": ..., "session_id": ..., "gap_seconds": ...} records. |
HTTP endpoints: POST /v1/chat/completions, POST /v1/responses, POST /v1/messages (streaming supported on all three; the same paths without /v1 also work, and query strings are forwarded). Any other path, such as GET /v1/models or count_tokens, passes through to the upstream unchanged and is not recorded. Also: POST /tasks {"task_id", "success"}, GET /requests/<id>, GET /ledger, GET /metrics (Prometheus), GET /health.
Request headers (all optional; stripped before forwarding):
| Header | Effect |
|---|---|
X-Prefixwise-Session-Id |
Groups turns into a session (also: session_id body field, or Anthropic metadata.user_id). Without it, all traffic is one session. |
X-Prefixwise-Task-Id |
Joins the request to a task for tokens per successful task (also: task_id body field). |
X-Prefixwise-Agent-Id |
Labels the agent or prompt version, for report --by agent_id. |
X-Prefixwise-Compaction-Event: 1 |
This turn follows a context compaction. |
X-Prefixwise-Fork-Of: <session> |
This session was forked from another. |
X-Prefixwise-Cache-Ttl: <seconds> |
The cache lifetime, when known. |
Response headers: X-Prefixwise-Request-Id always; X-Prefixwise-Cause, X-Prefixwise-Legit, X-Prefixwise-Avoidable-Tokens on non-streaming responses; X-Prefixwise-Fixes when a fix rewrote the request. Streamed requests are classified when the stream ends: read them from GET /requests/<id>.
Environment: PREFIXWISE_UPSTREAM_URL, PREFIXWISE_API_KEY (overrides client auth; x-api-key for Anthropic), PREFIXWISE_LEDGER_PATH, PREFIXWISE_HMAC_KEY (HMAC short blocks so their hashes cannot be dictionary-guessed), PREFIXWISE_MAX_SESSIONS (default 10,000), PREFIXWISE_FIXES (e.g. canonical_tools), PREFIXWISE_AUTH_TOKEN (require X-Prefixwise-Token), PREFIXWISE_MAX_BODY_BYTES, PREFIXWISE_PRICES (your own rates file), PREFIXWISE_CLIENT_TIMEOUT (default 120 s), PREFIXWISE_DRAIN_SECONDS (default 8), PORT.
Dollar costs. Each request is priced from the provider's own usage breakdown (uncached input, cache reads, cache writes by TTL, output), using a dated price table: prefixwise prices shows it. Avoidable cost is the avoidable tokens times (input price − cache-read price): what they would have cost as cache hits. A model with no rates shows -, never an estimate. To add other models or your negotiated rates, write a JSON file in the same format (prefixwise prices --json prints one) and set PREFIXWISE_PRICES=/path/prices.json. Your entries override the built-in ones. prefixwise report and prefixwise fixes then show dollars, and say how many requests were priced.
Fixes the proxy can apply. canonical_tools sorts tools by name and sorts each tool's keys before forwarding, so a tool list that drifts between turns (plugin reload, dict rebuild) stops breaking the cache. It is off by default; with it off, requests pass through unchanged. Prefixwise classifies the request the provider actually received. Fixes that would change what the model reads, like moving a timestamp out of the system prompt, are advice only: prefixwise fixes lists them. canonical_tools is proven: in E4, turning it on realised 99.9% (Anthropic Haiku 5.5) and 97.5% (vLLM Qwen3-4B) of the savings Prefixwise predicted, with task success flat.
Data and API
Every number Prefixwise shows is also data. Each request leaves a row of facts (verdict and its evidence, token breakdown, cost, latency, status; failed requests too), and every metric is defined once and served three ways: prefixwise report, the HTTP API at /api/v1 (summary, breakdowns by cause, session, model, day..., request rows, fixes, prices, explain; docs/API.md), and prefixwise export. GET /api/v1/metrics lists every metric and what it means. Design: docs/DATA.md.
Prometheus and Grafana: GET /metrics exports requests, tokens, avoidable tokens and dollars by provider, model and miss cause, plus Prefixwise's own latency and the KV-event stream's health. Import the Grafana dashboard (deploy/grafana/prefixwise.json) and the alert rules (hit rate below 80%, avoidable share above 10%, failures, lost KV events: deploy/prometheus/prefixwise-rules.yml). Setup and queries: docs/prometheus.md.
OpenTelemetry: PREFIXWISE_OTEL=1 (or prefixwise serve --otel) exports a span per request, following OpenTelemetry's GenAI semantic conventions (chat {model}, gen_ai.usage.cache_read.input_tokens and cache_write.input_tokens), with Prefixwise's verdict on it: prefixwise.cache.cause, .detail, .avoidable_tokens, .avoidable_cost_usd. Works the same from the proxy, prefixwise.wrap and the LiteLLM callback. Inside your app, spans go to the tracer provider your app sets up (Prefixwise never installs one there); serve and run export OTLP themselves, configured by the standard OTEL_* variables (pip install 'prefixwise[otel]'). Through the proxy, a traceparent header puts the span in the caller's trace and is passed on upstream. Already tracing your LLM calls? PREFIXWISE_OTEL=cause emits a separate span with only Prefixwise's attributes, so tokens are not counted twice. Details: docs/opentelemetry.md.
Security
- What it stores: the ledger keeps fingerprints of prompt blocks (hashes), token counts, causes, and your session, task and agent labels. It never stores prompt text or API keys. The ledger file is created readable by its owner only. Set
PREFIXWISE_HMAC_KEYso hashes of short, guessable blocks are keyed. - Where it listens:
127.0.0.1by default. To listen beyond localhost (a team server, or Docker with a published port), setPREFIXWISE_AUTH_TOKEN; clients then send it asX-Prefixwise-Token, and every endpoint but/healthrequires it. WithPREFIXWISE_API_KEYset, the proxy refuses to listen beyond localhost without a token, because anyone who reached the port could spend your key. Publish Docker ports on127.0.0.1(-p 127.0.0.1:8080:8080). - Keys: the client's own auth headers pass through to the upstream untouched and are never logged.
X-Prefixwise-*headers are never forwarded. - Limits: request bodies over 32 MiB (
PREFIXWISE_MAX_BODY_BYTES) get a 413, and malformed requests get a 400 naming the field.
Found a vulnerability? See SECURITY.md.
Self-hosted engines: vLLM, SGLang, LMCache
Step-by-step for vLLM users, with what each verdict means: docs/VLLM.md.
Prefixwise reads the engine's cached_tokens like any provider's: start vLLM with --enable-prompt-tokens-details, SGLang with --enable-cache-report. Tell it there is one self-hosted engine behind it:
prefixwise serve --upstream http://127.0.0.1:8000 --engine vllm # or --engine sglang
One engine means one cache and no routing, so a request whose prefix is unchanged but was not reused is named evicted (the engine ran out of GPU memory). That verdict is inferred, and the evidence says so: a chat template that renders history differently, or data-parallel routing, looks the same.
vLLM: confirm it with KV events. vLLM can tag the blocks each request uses with a session, so Prefixwise can check the block where the cache read stopped: removed means a confirmed eviction, still on the GPU means the prompt's tokens changed there:
pip install "prefixwise[engines]"     # pyzmq + msgspec; the core stays stdlib-only
vllm serve MODEL --enable-prefix-caching --enable-prompt-tokens-details \
  --kv-events-config '{"enable_kv_cache_events": true, "publisher": "zmq", "endpoint": "tcp://*:5557"}'
prefixwise serve --upstream http://127.0.0.1:8000 --engine vllm --kv-events tcp://127.0.0.1:5557
The verdict becomes evicted confirmed ("the engine removed N of this session's blocks"), or unknown with "not an eviction: the engine still holds this session's blocks" when the cause lies elsewhere. GET /engine shows the event stream's health.
Several caches (vLLM data-parallel ranks, or replicas behind a router): routing misses, confirmed. Each rank and each replica has its own cache, so a session whose turns land on different ones misses although nothing changed. --kv-events auto subscribes to every data-parallel rank (from vLLM's /kv_event_sources); behind a router, list each replica's stream: --kv-events tcp://replica-a:5557,tcp://replica-b:5557. The events themselves show which cache served each request, so the router only has to pass the request body through: llm-d, production-stack, AIBrix and the current SGLang model gateway do; Dynamo and the older SGLang gateway copy do not (details). A turn served by another cache while the previous one still held the very block it needed is a confirmed routing_miss; with several caches known, an eviction is never just inferred. How, and when nothing is claimed: docs/ENGINES.md. Live on two vLLM 0.33.0 replicas behind a router that never says which one it used (Colab L4): routing misses confirmed 5/5, and 5/5 hits with sticky routing, no false claim (record).
SGLang (0.5.20 or later): the same. SGLang also writes a request's session_id on the blocks it stores, so Prefixwise rebuilds each session's chain from SGLang's events:
python -m sglang.launch_server --model-path MODEL --enable-cache-report \
  --kv-events-config '{"publisher": "zmq", "endpoint": "tcp://*:5557"}'
prefixwise serve --upstream http://127.0.0.1:30000 --engine sglang --kv-events tcp://127.0.0.1:5557 --full-attention
Live on SGLang 0.5.23 (Qwen3-4B, L4): evictions confirmed 5 of 5 (record).
--full-attention says the model has no sliding-window or Mamba layers (Qwen3, Llama, most dense models). SGLang frees those layers without an event, so without the flag a missing block still confirms an eviction, but Prefixwise never says "not an eviction". At startup Prefixwise reads SGLang's /server_info (with PREFIXWISE_API_KEY if SGLang has --api-key) and judges only when it is safe: SGLang 0.5.20 or later, events on, no --enable-session-radix-cache; otherwise it says why and keeps the inference. With several data-parallel ranks, --kv-events auto follows every rank (from /server_info), and with --full-attention a turn sent to another rank while the previous one still held the very block it needed is a confirmed routing_miss, as on vLLM (not with prefill/decode disaggregation, or ranks across several nodes). Memory: about 80 bytes per token in SGLang's GPU cache at its default --page-size 1 (80 MB per million tokens; --page-size 16 cuts it 16-fold).
LMCache and HiCache need nothing extra. A prefix restored from CPU memory counts as a hit (vLLM's cached_tokens includes tokens loaded from LMCache), so only prefixes lost from every tier are evictions. Why it works this way, the alternatives considered and the known limits (several replicas, lost events): docs/ENGINES.md.
What it looks like on real engines. A session's prefix, after flooding the GPU's KV cache with three times its capacity (record):
| engine | prefix cached after the flood | correct cause | Prefixwise |
|---|---|---|---|
| vLLM | 0 of 3,404 | evicted | evicted 5 of 5; with KV events, confirmed ("211 of the previous request's KV blocks removed") |
| vLLM + LMCache | 3,328 of 3,404 | none (restored from CPU) | none 5 of 5 |
| SGLang | 3 of 3,404 | evicted | evicted 5 of 5 (inferred); with KV events, confirmed ("3,382 of the previous request's KV blocks removed", record) |
| SGLang + HiCache | 3,382 of 3,404 | none (restored from host memory) | none 5 of 5 |
Running in production
Measured by benchmarks/bench.py (results in benchmarks/runs/); rerun it on your own hardware.
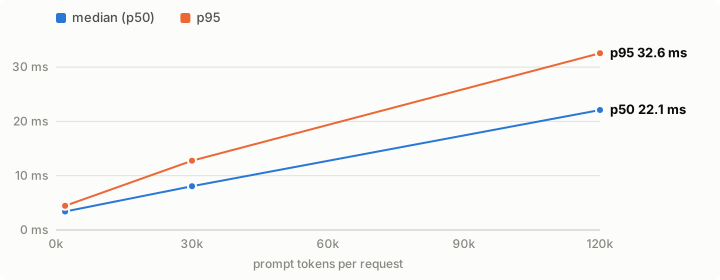
- Added latency: about 3 ms per request at a 2k-token prompt, 6 ms at 30k, 13 ms at 120k (p50; p95 under 22 ms). Streaming adds the same to time to first byte. A model call takes seconds, so this is well under 1%.
| prompt | added p50 | added p95 | added p99 |
|---|---|---|---|
| 2k tokens | 2.7 ms | 3.8 ms | 8.0 ms |
| 30k tokens | 5.6 ms | 7.5 ms | 8.8 ms |
| 120k tokens | 13.3 ms | 18.8 ms | 27.0 ms |
OpenAI request shape, not streamed; the cost grows with the prompt because each block is hashed.
- Live, against real providers (records: Anthropic, OpenAI): 20 pairs each, direct vs. through the proxy, from Colab. Cache hit share identical both ways (Anthropic Haiku 5.5: 98.1% and 98.1%; OpenAI GPT-5.6 Luna: 97.9% and 97.9%), every request recorded. Median added latency +29 ms and +43 ms on ~1 s calls, which is within the network variance between two separate calls; the proxy's own cost is 3-6 ms.
- Capacity: one proxy process handles about 185 requests/s of agent-sized traffic before CPU-bound, with no errors up to 128 concurrent clients. An agent sends roughly one request every few seconds, so one process serves hundreds of agents at once. Session state lives in the process: to run several, route each session to the same instance (e.g. hash
X-Prefixwise-Session-Id). - Memory: about 11 KB per tracked session, capped by
PREFIXWISE_MAX_SESSIONS(default 10,000: roughly 100-150 MB), plus a bounded cache of block hashes (about 8 MB). In a 15-minute soak (148,000 requests, 0 errors) RSS went 60 to 74 MB; Python-level memory is flat once the caches fill (tracemalloc: 16.2 MB at both 2,400 and 4,800 sessions), so the remainder is the allocator keeping freed request buffers. - It fails open. If the ledger cannot be written (disk full, locked) or classification fails, the client still gets the upstream response, with
X-Prefixwise-Error: not recorded; the proxy logs why to stderr. Upstream errors (429, 500, ...) reach the client unchanged, withretry-after,x-should-retry, rate-limit headers and the provider's request id, so SDK retries behave as without the proxy. An unreachable or broken upstream is a 502. - Timeouts: a client connection idle for
PREFIXWISE_CLIENT_TIMEOUTseconds (default 120) is closed, so idle or half-sent connections cannot pin threads. Upstream calls time out after 600 s (long generations stream for minutes). - Shutdown: on SIGTERM (
docker stop, systemd, Kubernetes) the proxy stops accepting connections, lets in-flight requests and streams finish for up toPREFIXWISE_DRAIN_SECONDS(default 8), then exits 0. - Ledger growth and retention: about 450 bytes per request (a million requests is about 450 MB);
prefixwise reporttakes about 2 s at a million rows. Delete old rows withprefixwise prune --older-than 30d, e.g. from a daily cron. Back it up while the proxy runs withsqlite3 prefixwise.db ".backup backup.db". - Not built yet: shared session state across processes, and request logging (the proxy logs only errors; metrics:
GET /metrics, traces: OpenTelemetry, above).
Limits
- Not verified yet:
- OpenAI native agreement. OpenAI's
prompt_cache_diagnosticsreturnedunavailablefor every comparison on gpt-5.6, -luna and -sol. That held with turn delays of 1 s, 30 s and 120 s, and on a minimal standalone call with a completed baseline. OpenAI's dashboard shows 0 diagnosed responses. Prefixwise still classifies OpenAI traffic; only the cross-check against OpenAI's own verdict is missing. - Causes E1 does not inject: TTL expiry, routing, eviction, tool-result mutation.
- Real agent traffic, which is messier than scripted turns.
- OpenAI native agreement. OpenAI's
- Self-hosted engines: with
--engine, an engine eviction is inferred from one cache and no routing; on vLLM and SGLang,--kv-eventsconfirms it or rules it out. Validated live on vLLM 0.33 and SGLang 0.5.23 (Colab L4): evictions named 5/5, confirmed with KV events on both (vLLM, SGLang), LMCache and HiCache restores counted as hits 5/5 (record). Not yet measured live: how often the "not an eviction" verdict (token-level divergence) occurs in real agent traffic. Several vLLM caches (ranks, replicas behind a router): routing misses confirmed from KV events, live 5/5 on two vLLM replicas (record); data-parallel ranks inside one server (vLLM and SGLang,--kv-events auto) not yet run live. - Divergence is located per block, not per token. An edit at the very end of a long system prompt is reported as
system_edit, even if the provider could have reused everything before it. In one live OpenAI call, appending three words to 2,100 tokens of instructions gave 0 cached tokens, which looks more like routing than the edit itself. - One proxy process keeps session state in memory: run one instance per agent fleet, or send all of a session's turns to the same instance.
- OpenAI's default in-memory cache TTL is not a fixed number, so after a long gap a cold OpenAI cache is
unknownunless you sendX-Prefixwise-Cache-Ttl. - Dollar costs: only models in the dated price table are priced: Claude Haiku, Sonnet and Opus 5.5, Fable 5.1 and Sonnet 4.6 (Anthropic's pricing page, 2026-11-06/07), and OpenAI GPT-5.6 Luna, Terra and Sol (OpenAI's pricing page, 2026-11-07; Sol's promotional price expires after 2026-11-30). Everything else shows
-until you add rates withPREFIXWISE_PRICES. OpenAI cache writes are priced at the 30-minute rate. Batch, fast-mode and data-residency multipliers are not modelled.
Working on Prefixwise
Agents and people working on this repo: read WORKLOG.md first. It has the current goal, why, what to run, and what happens with each result. build.log records outcomes.
The flowcharts are drawn by code: when the request flow or the classifier's order changes, update docs/figures/make_architecture.py, run it, look at the result, and commit the SVGs. CI fails if a committed figure differs from what its script draws, or if the decision flowchart leaves out a cause the classifier can return (tests/test_figures.py).
Development
pip install -e ".[dev]"
python -m pytest tests -q                              # about 200 tests, 40 s
python experiments/e1_open/e1_open.py --mock           # harness smoke test
Design notes
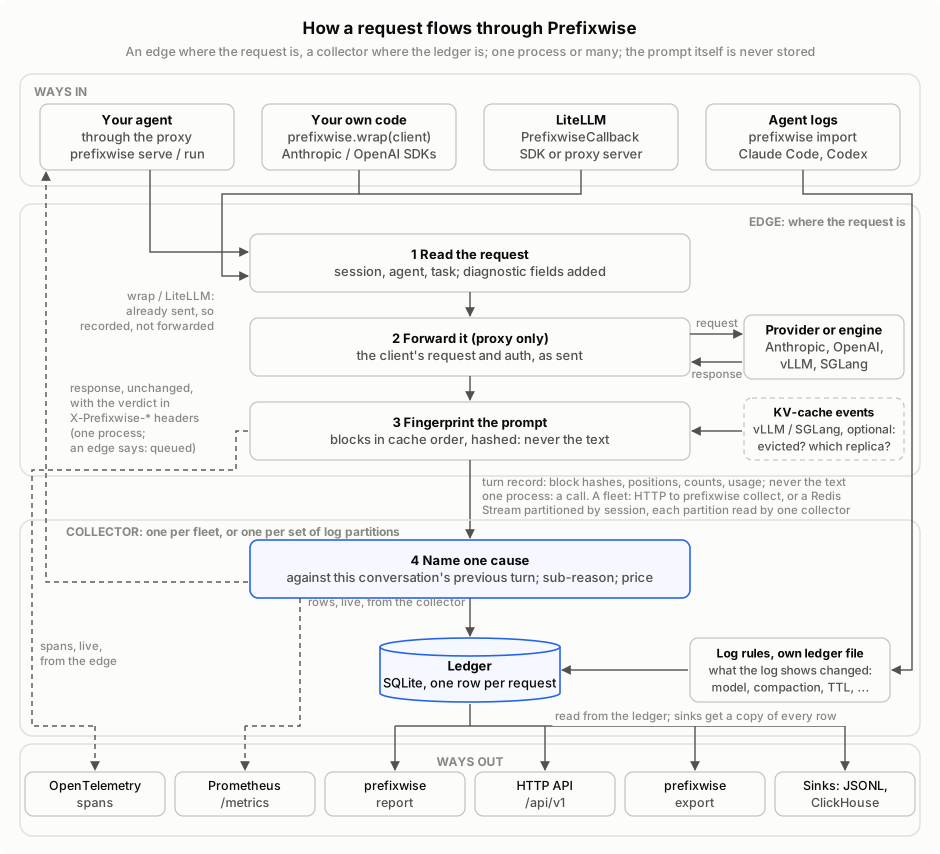
How it is built today (parts, request flow, how a cause is decided, data, rules): docs/ARCHITECTURE.md. The original research and architecture, kept as written: docs/DESIGN.md. Current designs: docs/DATA.md (data and metrics), docs/API.md, docs/ENGINES.md (vLLM and SGLang engine join).
License
MIT. See LICENSE.
1 maintainer

Metadata
1 maintainer
Release files for prefixwise 0.7.0
For a detailed explanation of source distributions (sdists) and built distributions (wheels), please see the package formats documentation.
Source distribution (sdist)
| File | Size | Uploaded | Provenance | Actions |
|---|---|---|---|---|
| prefixwise-0.7.0.tar.gz | 323.9 kB | With provenance | Details for prefixwise-0.7.0.tar.gz |
Built distribution (wheel)
| File | Interpreter | ABI | Platform | Actions Reset |
|---|---|---|---|---|
| prefixwise-0.7.0-py3-none-any.whl | Python 3 | none | any | Details for prefixwise-0.7.0-py3-none-any.whl |
Total release size: 456.3 kB
Release files / prefixwise-0.7.0.tar.gz
| Download URL | prefixwise-0.7.0.tar.gz |
|---|---|
| Size | 323.9 kB |
| Tags | Source |
|
SHA-256 checksum How to use checksums |
fb993581881c558592c7de2557c7188021034789647140af059bc63e0f68b00a
|
|
BLAKE2b-256 checksum How to use checksums |
f35eeaa5c57ed06d2373fc53693b751c74874c140d57b1548c8efcb055532bfa
|
| Upload date | |
|
Uploaded using Trusted Publishing? What is trusted publishing? |
Yes |
| Uploaded via |
twine/7.0.0 CPython/3.13.16
|
Provenance
Provenance describes where a file came from. On PyPI, provenance is shared via attestations, which provide a verifiable record of the build or publishing details. View details, limitations and caveats.


PyPI Publish Attestation
PyPI verified that this artifact, at this checksum, originated from the publisher listed below.
Signed by GitHub Actions, verified by PyPI on Nov 8, 2026.
Transparency logRelease files / prefixwise-0.7.0-py3-none-any.whl
| Download URL | prefixwise-0.7.0-py3-none-any.whl |
|---|---|
| Size | 132.4 kB |
| Tags | Python 3 |
|
SHA-256 checksum How to use checksums |
f468ef6f4b8943c11983ce2028ed8b272f68fdc7ba2723a65adebc49e4448256
|
|
BLAKE2b-256 checksum How to use checksums |
30d46945aec76c79f1c66d3114e69e1346afb3cbdf35cbc5e6ad05406de08b7c
|
| Upload date | |
|
Uploaded using Trusted Publishing? What is trusted publishing? |
Yes |
| Uploaded via |
twine/7.0.0 CPython/3.13.16
|
Provenance
Provenance describes where a file came from. On PyPI, provenance is shared via attestations, which provide a verifiable record of the build or publishing details. View details, limitations and caveats.
PyPI Publish Attestation
PyPI verified that this artifact, at this checksum, originated from the publisher listed below.
Signed by GitHub Actions, verified by PyPI on Nov 8, 2026.
Transparency logSecurity for prefixwise 0.7.0
Provenance
Provenance describes where a file came from. On PyPI, provenance is shared via attestations, which provide a verifiable record of the build or publishing details. View details, limitations and caveats.
Full provenance
Both files in this release have been uploaded with provenance metadata.
Attestation for prefixwise-0.7.0.tar.gz
PyPI Publish Attestation
PyPI verified that this artifact, at this checksum, originated from the publisher listed below.
Signed by GitHub Actions, verified by PyPI on Nov 8, 2026.
Transparency logA note on package security
PyPI is a repository for distributing packages, not a service for auditing them. While third-party security researchers and our staff do their best to detect and remove malicious packages, PyPI cannot guarantee the quality, security or suitability of any given package.
To learn more about protecting yourself from malicious actors, visit our package security documentation.














