Probability Distributions for Python.

Project description

Probability Distributions for Python

The Statistical Void
Stats can get tricky in the transition from plotting fun graphs to advanced algebraic equations. A classic example is the given sum:
1.0e14 + 1.0 - 1.0e14
The actual result is 1.0 but in double precision, this will result in 0.0.
While in this example the failure is quite obvious, it can get a lot trickier
than that. Instances like these hinder the community from exploring the
inferential potential of complex entities.
p=Gaussian(a,b)
q=Gaussian(x,y)
p+q
This snippet would be close to useless as python addition doesn't isn't attributed for
higher-level declarables such as Gaussian variables. probplotlib provides simple solutions
for probability distributions; posing a highly-optimized alternative to numpy and math,
in a niche that is scarce in options.
Usage
probplotlib has the following operative methods:
-
+: uses Dunder Methods for facilitating dist-additions. -
calculate_mean(): returns the mean of a distribution.
gaussianex = Gaussian()
calculate_mean(gaussianx)
calculate_stdev(): returns the standard deviation of a distribution.
binomialex = Binomial()
calculate_stdev(binomialex)
read_dataset(): reads an external .txt dataset directly as a distribution.
gaussianex.read_dataset('values.txt')
binomialex.read_dataset('values.txt')
params(): retrieves the identity parameters of an imported dataset.
gaussianex.params()
binomialex.params()
pdf(): returns the probability density function at a given point.
pdf(gaussianex, 2)
functions unique to Gaussian Distributions:
plot_histogram(): uses matplotlib to display a histogram of the Gaussian Distribution.
gaussianex.plot_histogram()
plot_histogram_pdf(): uses matplotlib to display a co-relative plot along with the Gaussian probability density function.
gaussianex.plot_histogram_pdf()
functions unique to Binomial Distributions:
plot_bar(): uses matplotlib to display a bar graph of the Binomial Distribution.
binomialex.plot_bar()
plot_bar_pdf(): uses matplotlib to display a co-relative plot along with the Binomial probability density function.
binomialex.plot_bar_pdf()
Data Visualization
probplotlib therefore allows you to analyze raw numerical data graphically in minimial lines of code. The example below makes for better understanding.
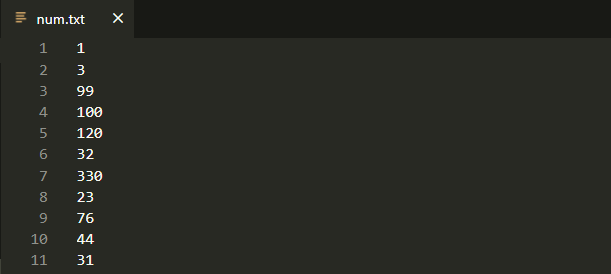
a bag of numbers in a .txt file corresponds to the following plots:
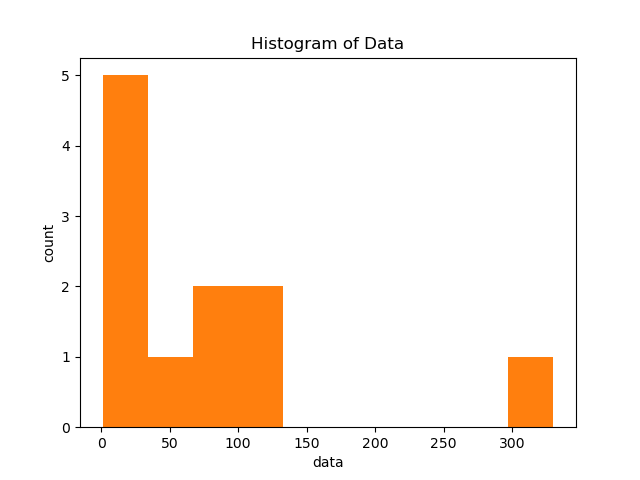
histogram plot:
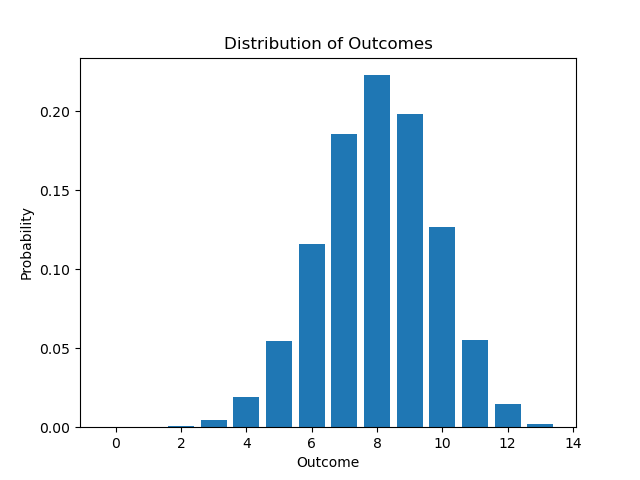
bar plot:
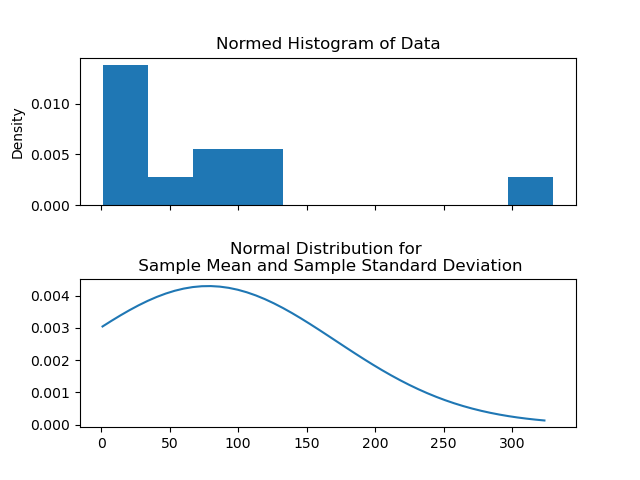
histogram plot with pdf:
References
Stanford Archives: CS109- The Normal(Gaussian) Distribution
A Practical Overview on Probability Distributions: Andrea Viti, Alberto Terzi, Luca Bertolaccini
Awesome Scientific Computing: Nico Schlömer, GitHub Repository
math.statistics: Python 3.10 Source Code
Dependencies
probplotlib depends on the matplotlib library on top of your regular python installation.
pip install matplotlib
or
conda install matplotlib
Installation
probplotlib is available on the Python Package Index. You can install it directly using pip.
pip install probplotlib
Testing
To run the tests, simply check to this directory and run the code below.
python -m unittest test_probplotlib
Release history Release notifications | RSS feed

Download files
Download the file for your platform. If you're not sure which to choose, learn more about installing packages.
Source Distribution
Built Distribution
Filter files by name, interpreter, ABI, and platform.
If you're not sure about the file name format, learn more about wheel file names.
Copy a direct link to the current filters
File details
Details for the file probplotlib-1.0.tar.gz.
File metadata
- Download URL: probplotlib-1.0.tar.gz
- Upload date:
- Size: 4.2 kB
- Tags: Source
- Uploaded using Trusted Publishing? No
- Uploaded via: twine/3.4.2 importlib_metadata/4.8.1 pkginfo/1.7.1 requests/2.26.0 requests-toolbelt/0.9.1 tqdm/4.62.3 CPython/3.9.7
File hashes
| Algorithm | Hash digest | |
|---|---|---|
| SHA256 |
8f8c734fc0fa9ae12410f90daffae9aa8cf7e3fa5de91798f3c83fa2db0f499f
|
|
| MD5 |
32e0aeb2c18420cc8a3d45bc0ec18470
|
|
| BLAKE2b-256 |
ab5f29d18e54e56db8376bcfd47f222d455bdba12b48a77ad08456c370b781f1
|
File details
Details for the file probplotlib-1.0-py3-none-any.whl.
File metadata
- Download URL: probplotlib-1.0-py3-none-any.whl
- Upload date:
- Size: 4.0 kB
- Tags: Python 3
- Uploaded using Trusted Publishing? No
- Uploaded via: twine/3.4.2 importlib_metadata/4.8.1 pkginfo/1.7.1 requests/2.26.0 requests-toolbelt/0.9.1 tqdm/4.62.3 CPython/3.9.7
File hashes
| Algorithm | Hash digest | |
|---|---|---|
| SHA256 |
fbb73b65954eef177d7160fba26a2f896922c62e1420f522783d074ad483d4db
|
|
| MD5 |
9dc9231987e889e8194e794d1b2c460f
|
|
| BLAKE2b-256 |
3dc373660937e87ac7635a4ab05a9050089a68e6d7d3ea41a72395f4cf4b658c
|


