
process-improve
Designed experiments, multivariate analysis and process monitoring for Python. Built for the chemometrics, manufacturing and pharma workflows where you need to know not just what fits, but which factors matter, is this observation normal, which variable moved, and how sure am I?
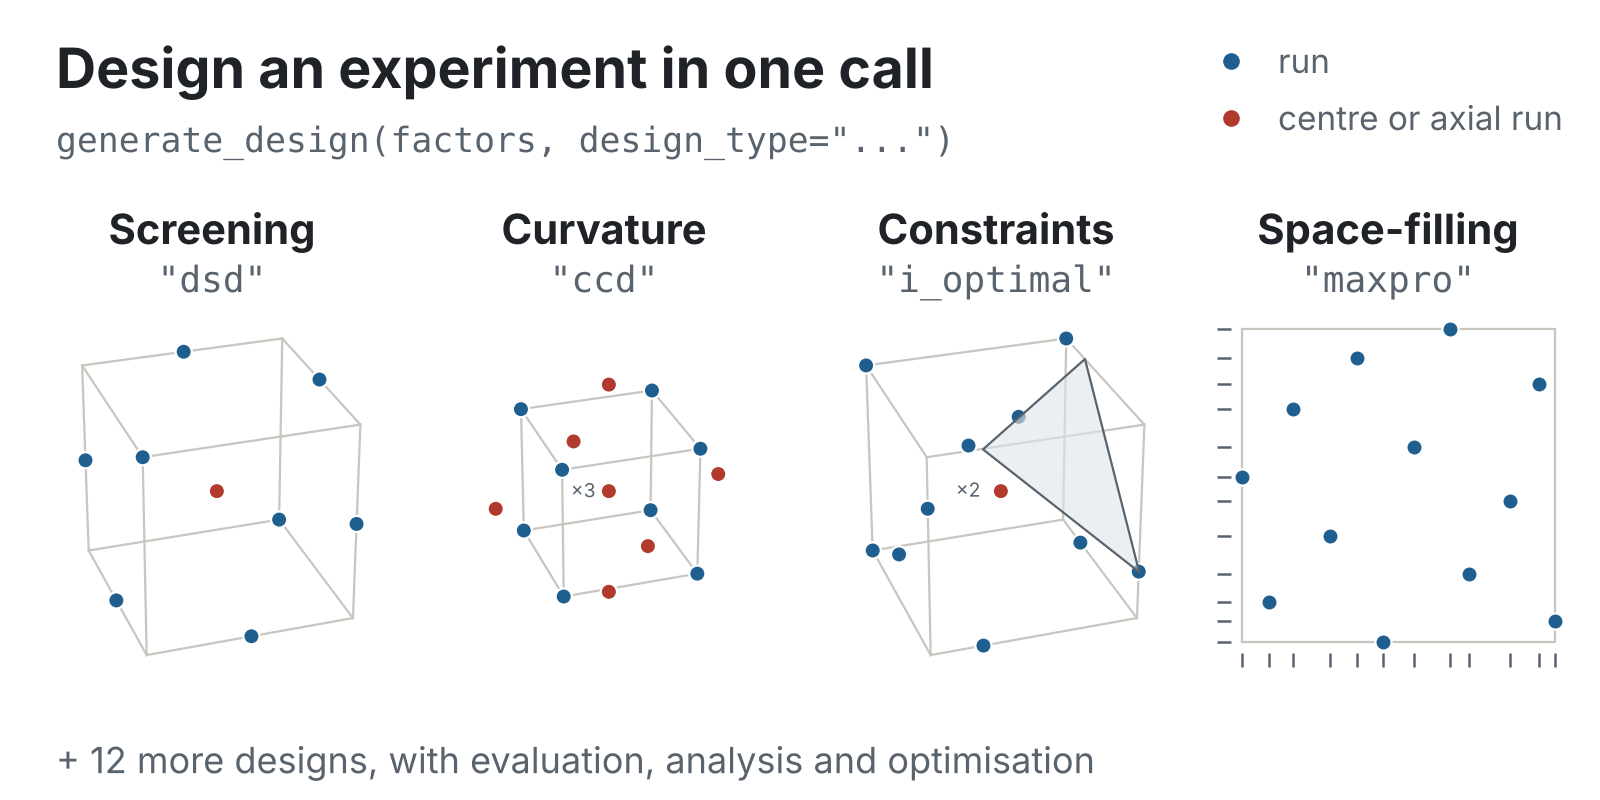








Try it in your browser · Documentation · Free textbook · Design gallery
pip install process-improve
Try it without installing anything
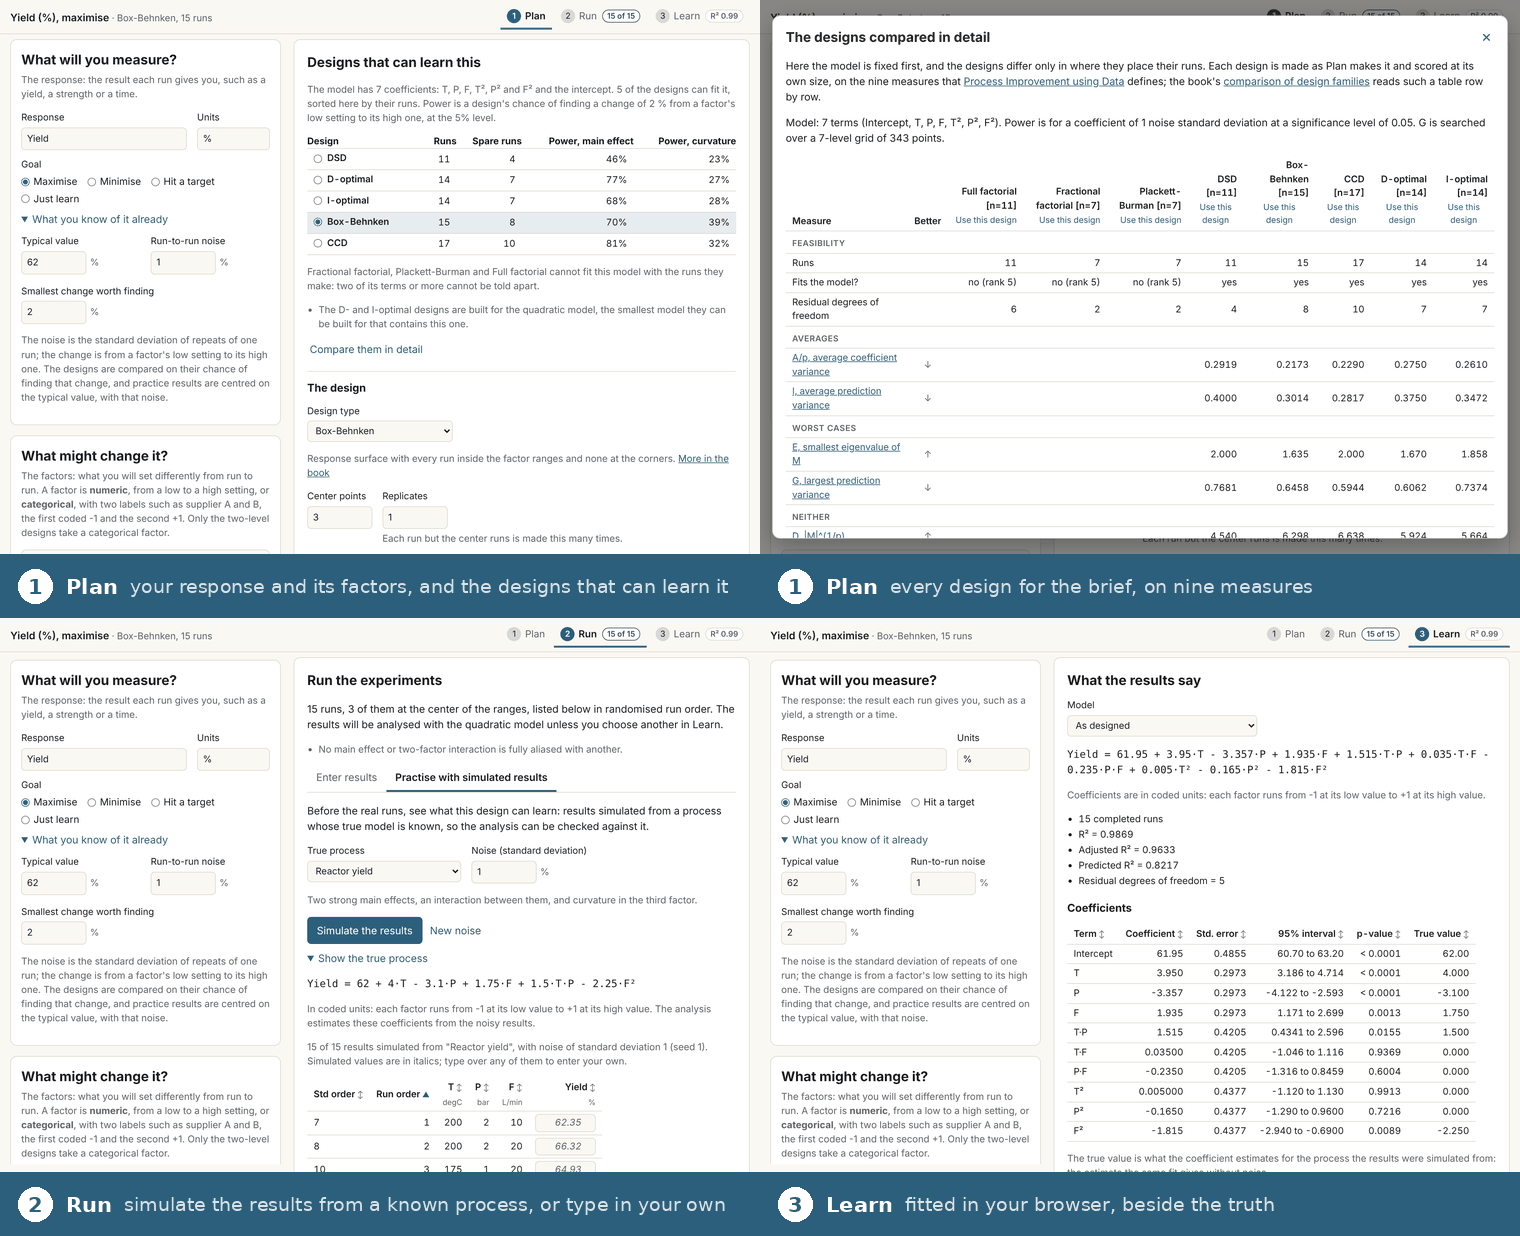
Factorial, the designed-experiments app, runs this package inside your browser tab (Pyodide / WebAssembly). Say what you will measure, with its units and goal, and what might change it: the app lists the designs that can learn how the one depends on the other, scored on the nine measures of Process Improvement using Data and on their power to find the change you care about. Run the one you pick, type in the results or practise with results simulated from a process whose true model is known, and read the analysis, beside the truth when it is known. Copy the Python behind each step. The analysis runs on your machine, and your data never leave it.
Learn the methods
- Free textbook: Process Improvement using Data, the companion to this package, from data visualization to latent-variable models, designed experiments and process monitoring.
- API reference and user guide: https://kgdunn.github.io/process-improve/
- Applied DoE tutorial (8 modules): https://kgdunn.github.io/process-improve/applied_doe/index.html
- Every design family and its
design_type: https://kgdunn.github.io/process-improve/user_guide/doe_coverage.html - Fully worked quickstart: https://kgdunn.github.io/process-improve/quickstart.html
Ask a question, get one line of code and the chapter that explains it
Under each question is the chapter of the free textbook that explains the method.
| You want to know | One call |
|---|---|
| Which design should I run? Comparing design families |
recommend_strategy(factors=factors, budget=30) |
| Which of my factors matter? Definitive screening designs |
generate_design(factors, design_type="dsd") |
| Which effects are real? Significance of effects |
analyze_experiment(design.design, responses) |
| Which way is the optimum? Response surface methods |
optimize_responses([fit], method="steepest_ascent") |
| Is this observation normal? Hotelling's T² |
pca.diagnose(new).spe |
| Which variable moved? Contribution plots |
pca.spe_contributions(new) |
| How sure is this prediction? Projection to latent structures |
pls.prediction_interval(new) |
| Which recipe hits my target? Using a PLS model backwards |
model.invert(y_desired=20.9) |
| Is the process in control? Shewhart charts |
ControlChart().calculate_limits(y) |
| Is this batch on track? Batch process monitoring |
BatchMonitor(model).fit(good).monitor(batch) |
Designed experiments in one call
from process_improve.experiments import Factor, generate_design

factors = [
    Factor(name="Temperature", low=150, high=200, units="degC"),
    Factor(name="Pressure", low=1, high=5, units="bar"),
    Factor(name="Catalyst", low=0.5, high=2.0, units="g"),
]
design = generate_design(factors, design_type="dsd")  # a definitive screening design
print(design.n_runs)  # 9
run_sheet = design.design_actual  # in your units, ready to run
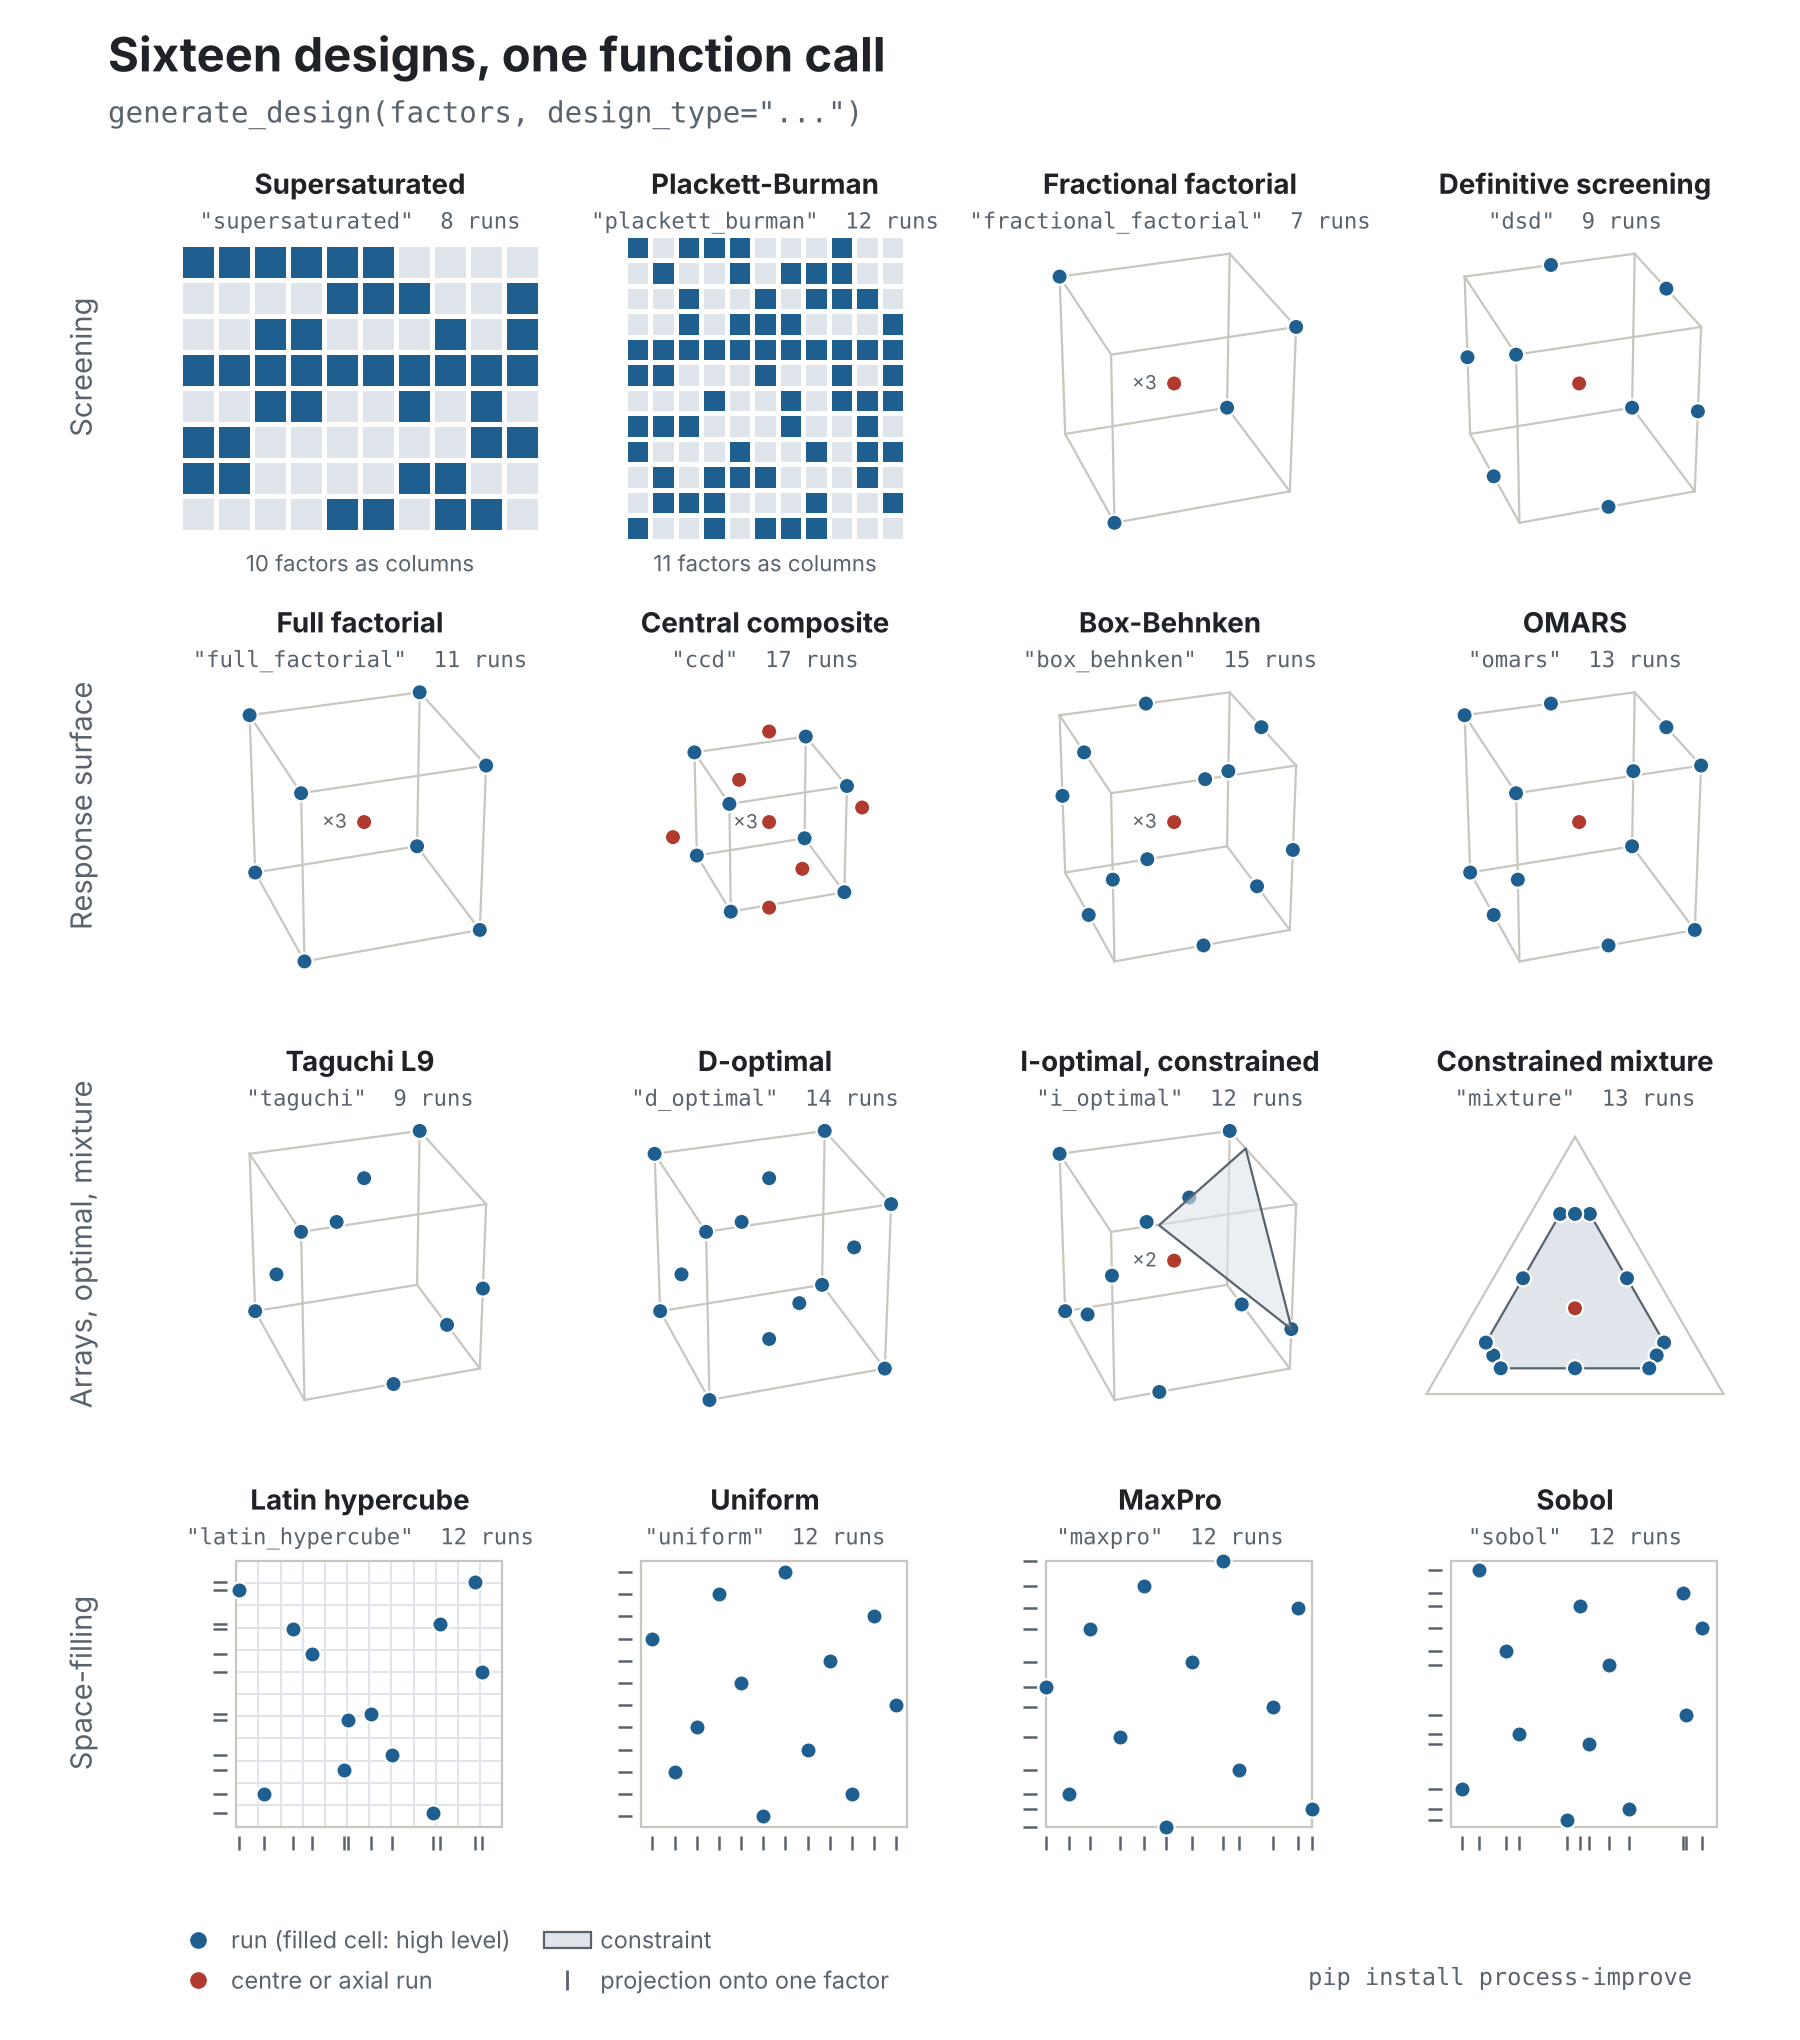
Change design_type and the same call builds any of these, each true to its
published definition.
Leave design_type out and give a budget, and one is chosen for you.
evaluate_design scores any design (efficiencies, prediction variance, fraction of design
space, aliasing), analyze_experiment fits it, augment_design extends it, and
optimize_responses finds the best settings for several responses at once. Not sure where
to start? Ask for a whole strategy:
from process_improve.experiments import Response
from process_improve.experiments.strategy import recommend_strategy

strategy = recommend_strategy(
    factors=factors,  # the three factors above
    responses=[Response(name="Yield", goal="maximize", units="%")],
    budget=30,
)
print([(stage["design_type"], stage["estimated_runs"]) for stage in strategy["stages"]])  # [('full_factorial', 8), ('ccd', 17), ('replicates_at_optimum', 3)]
Quick start: real data, real answers
The examples below use measurements from a low-density polyethylene reactor: 54 runs, 14 process variables and 5 quality measurements of the polymer. The last four runs come from a process upset. Paste the blocks in order and you get the numbers in the comments.
Is this observation normal, and which variable moved?
import pandas as pd
from process_improve.multivariate import PCA, MCUVScaler

ldpe = pd.read_csv("https://openmv.net/file/LDPE.csv", index_col=0)
process, quality = ldpe.loc[:, "Tin":"Press"], ldpe.loc[:, "Conv":"SCB"]

# Learn normal operation from the first 50 runs, then check the last four
scaler = MCUVScaler().fit(process.loc[:50])
pca = PCA(n_components=3).fit(scaler.transform(process.loc[:50]))
new = scaler.transform(process.loc[51:])

# SPE above its limit means "unlike anything seen in normal operation"
print(pca.diagnose(new).spe.round(1).to_list())  # [2.3, 3.7, 5.3, 7.6]
print(round(pca.spe_limit(conf_level=0.95), 1))  # 3.4

# Which variables moved in run 54? All three belong to the second reactor zone
print(pca.spe_contributions(new).loc[54].abs().nlargest(3).round(1).to_dict())  # {'z2': 5.9, 'Fi2': 3.1, 'Tcin2': 1.9}
pca.score_plot()  # interactive Plotly figure
How sure is this prediction?
from process_improve.multivariate import PLS

# Hold out runs 41 to 50 and predict their 5 quality measurements, with 95% intervals
x_scaler, y_scaler = MCUVScaler().fit(process.loc[:40]), MCUVScaler().fit(quality.loc[:40])
n = PLS.select_n_components(process.loc[:40], quality.loc[:40], max_components=6, random_state=0).n_components
pls = PLS(n_components=n).fit(x_scaler.transform(process.loc[:40]), y_scaler.transform(quality.loc[:40]))
interval = pls.prediction_interval(x_scaler.transform(process.loc[41:50]))
low, high = y_scaler.inverse_transform(interval.lower), y_scaler.inverse_transform(interval.upper)

# Cross-validation picks 3 components, and 48 of the 50 held-out measurements land inside
inside = (quality.loc[41:50] >= low) & (quality.loc[41:50] <= high)
print(n, int(inside.to_numpy().sum()))  # 3 48

# The quality is driven by the same reactor zone that moved in the upset
print(pls.vip().nlargest(3).round(2).to_dict())  # {'z2': 1.38, 'Fi2': 1.38, 'Tmax2': 1.37}
Which recipe hits my target?
from process_improve.multivariate import OPLS

# Acetic acid, H2S and lactic acid in 26 cheddar cheeses, and their taste score
cheese = pd.read_csv("https://openmv.net/file/cheddar-cheese.csv").iloc[4:]
X, y = cheese[["Acetic", "H2S", "Lactic"]], cheese[["Taste"]]
model = PLS(n_components=2).fit(X, y)

recipe = model.invert(y_desired=20.9)  # the inputs predicted to give a taste of 20.9
print(recipe.x_new.round(2).to_list())  # [5.52, 5.56, 1.4]
print(round(recipe.hotellings_t2, 2))  # 0.06
print(recipe.null_space_dimension)  # 1

# One free direction: a line of recipes with the same predicted taste
walk = [model.invert(20.9, null_space_coordinates=[s]).x_new.round(2).to_list() for s in (-1.0, 0.0, 1.0)]
print(walk)  # [[4.95, 6.1, 1.33], [5.52, 5.56, 1.4], [6.09, 5.02, 1.46]]

# O-PLS separates that freedom while fitting, so inversion becomes one division
opls = OPLS(n_orthogonal_components=1).fit(X, y)
print(opls.invert(y_desired=20.9).x_new.round(2).to_list())  # [5.46, 5.62, 1.39]
The freedom along that line is what you spend on cost, supply or a regulatory window; the
hotellings_t2 tells you when a recipe has walked past the evidence. The
user guide and the
book chapter
go further.
Has the process drifted?
from process_improve.multivariate import AdaptivePCA

# Learn from the first 50 runs in their own units (the model centres and scales itself),
# then stream the last four, one at a time
monitor = AdaptivePCA(n_components=3).fit(process.loc[:50])
alarms = [not monitor.update(row.to_numpy()).in_control for _, row in process.loc[51:].iterrows()]
print(alarms)  # [False, True, True, True]
AdaptivePCA and AdaptivePLS keep learning as data arrive, so a model does not go stale
when the process drifts, and they report how far it has moved from where it was trained.
What's inside
- Designed experiments: factorial, screening (Plackett-Burman, DSD, supersaturated), response-surface (CCD, Box-Behnken, OMARS), mixture, space-filling and optimal (D, I, A, E, G, K) designs, in constrained regions too; design evaluation, analysis (including split plots), augmentation, multi-response optimisation and a multi-stage strategy recommender.
- PCA with SVD and NIPALS, native missing-value handling by Trimmed Score Regression, Hotelling's T² and SPE limits, and score, T² and SPE contributions.
- PLS regression with a scikit-learn API, VIP, cross-validated component selection and prediction intervals; PLS-DA classification with a Bayesian decision rule for unbalanced classes and a permutation test that says whether the separation is real.
- Model inversion:
PLS.invert()andOPLSsolve for the inputs that reach a target and return the null space of equally valid designs. - Multi-block and T-shaped data: TPLS (PLS for T-shaped data structures), MBPCA and MBPLS.
- On-line models:
AdaptivePCAandAdaptivePLSfor monitoring and soft sensing. - Process monitoring: Shewhart, EWMA, CUSUM and Holt-Winters control charts, process capability.
- Batch data: alignment, feature extraction, batch PCA and PLS, on-line batch monitoring.
- Sensory panels: panel validation, the Mixed Assessor Model, attribute-to-product relations.
- Robust regression: repeated-median and Theil-Sen estimators for data with outliers.
- Interactive Plotly diagnostics on every fitted model, and
pandas-native outputs that keep your row and column labels.
Release notes are in the changelog.
Works alongside scikit-learn
process-improve sits next to scikit-learn, not in place of it. Its estimators follow the
same conventions (fit, predict, score, the _ suffix on fitted attributes), so they
drop into Pipeline, GridSearchCV and cross_val_score. What it adds is the
process-analytics layer: the diagnostics that tell you whether a new observation is normal,
which variable moved, and how confident a prediction is.
| Capability | scikit-learn | process-improve |
|---|---|---|
| PCA, PLS with sklearn-style API | ✓ | ✓ |
| Missing-data fitting (NIPALS / TSR) | - | ✓ |
| Hotelling's T² + SPE outlier limits | - | ✓ |
| Variable-level contributions | - | ✓ |
| Prediction intervals for PLS | - | ✓ |
| Multi-block models (TPLS, MBPLS) | - | ✓ |
| Model inversion: design inputs for a target | - | ✓ |
| On-line / adaptive monitoring (recursive PCA/PLS) | - | ✓ |
| Designed experiments, incl. OMARS & optimal | - | ✓ |
| Shewhart, EWMA, CUSUM, Holt-Winters charts | - | ✓ |
| Batch process monitoring | - | ✓ |
| Plotly diagnostics built in | - | ✓ |
Labeled DataFrame outputs |
partial | ✓ |
fit() returns self, fitted attributes end with an underscore (scores_, loadings_,
spe_, hotellings_t2_, r2_cumulative_, ...), predict() returns predictions, and
diagnose() returns an sklearn.utils.Bunch with named fields such as spe and
hotellings_t2. Pipelines that mix scaled numeric and one-hot encoded columns, and the
current gaps, are in
SKLEARN_COMPATIBILITY.md.
Installation
pip install process-improve                    # core: numpy, pandas, scipy, scikit-learn, statsmodels, ...
pip install 'process-improve[plotting]'        # adds matplotlib, plotly, seaborn, ridgeplot
pip install 'process-improve[batch]'           # adds openpyxl, ruptures, scikit-image (batch data IO, change points)
pip install 'process-improve[control]'         # adds osqp (the batch mid-course correction solver)
pip install 'process-improve[mcp]'             # adds mcp (the MCP server runtime)
pip install 'process-improve[fast]'            # adds numba (JIT speedups for batch alignment)
pip install 'process-improve[all]'             # everything above
Requires Python 3.10 or newer. The core install pulls in numpy, pandas, scipy,
scikit-learn, statsmodels, patsy, pydantic, pyyaml, threadpoolctl and tqdm.
Heavier optional surfaces (plotting, Taguchi arrays, batch IO, batch control, the MCP server, numba JIT)
live in extras, so a caller who only needs, say, detect_multivariate_outliers does not have
to install Plotly or numba.
Use it from Claude
The designed-experiments tooling ships as a Claude Skill, so you can plan, generate, verify and analyse experiments in your own Claude account with no server involved:
/plugin marketplace add kgdunn/process-improve
/plugin install doe-designer@process-improve
The skill's first rule is that a design matrix is never written out by the model: it is
generated from a catalogue and then verified, because a language model asked to produce a
fractional factorial will often return one that looks right and is a lower resolution than
it claims. See skills/README.md
for the other install routes (local folder, claude.ai upload) and for the MCP server, which
exposes the same tool registry without the workflow guidance.
Citing process-improve
If you use this package in academic work, please cite it. The
CITATION.cff file carries
the current version and release date, and GitHub renders a "Cite this repository" button
in the sidebar with ready-made BibTeX and APA entries:
@software{dunn_process_improve,
  author  = {Dunn, Kevin G.},
  title   = {{process-improve: Multivariate Analysis for Process Improvement}},
  year    = {2026},
  url     = {https://github.com/kgdunn/process-improve}
}
Add the version field from CITATION.cff (or the release tag you installed) when citing a
specific version.
License
MIT: see LICENSE for details.
Contributing
Bug reports, feature requests and pull requests are welcome. See CONTRIBUTING.md for development setup, testing and code style, and the architecture overview for a map of the codebase. Bugs and feature requests go on the issue tracker.
1 maintainer

Metadata
1 maintainer
Release files for process-improve 1.99.0
For a detailed explanation of source distributions (sdists) and built distributions (wheels), please see the package formats documentation.
Source distribution (sdist)
| File | Size | Uploaded | |
|---|---|---|---|
| process_improve-1.99.0.tar.gz | 3.1 MB | Details |
Built distribution (wheel)
| File | Interpreter | ABI | Platform | Reset |
|---|---|---|---|---|
| process_improve-1.99.0-py3-none-any.whl | Python 3 | none | any | Details |
Total release size: 6.4 MB
Release files / process_improve-1.99.0.tar.gz
| Download URL | process_improve-1.99.0.tar.gz |
|---|---|
| Size | 3.1 MB |
| Tags | Source |
|
SHA-256 checksum How to use checksums |
93567e17bdf666bb67e23fe735b3d7cd58c8c4db7f7dd8883a3d496dfb4d67b3
|
|
BLAKE2b-256 checksum How to use checksums |
572174b9bae5ce9a1b634227299ebff50608fdedd42462e9cce1b695c2cb8d11
|
| Upload date | |
|
Uploaded using Trusted Publishing? What is trusted publishing? |
Yes |
| Uploaded via |
twine/7.0.0 CPython/3.13.14
|
Provenance
Provenance describes where a file came from. On PyPI, provenance is shared via attestations, which provide a verifiable record of the build or publishing details. View details, limitations and caveats.


PyPI Publish Attestation
PyPI verified that this artifact, at this checksum, originated from the publisher listed below.
Signed by GitHub Actions, verified by PyPI on Oct 15, 2026.
Transparency logRelease files / process_improve-1.99.0-py3-none-any.whl
| Download URL | process_improve-1.99.0-py3-none-any.whl |
|---|---|
| Size | 3.3 MB |
| Tags | Python 3 |
|
SHA-256 checksum How to use checksums |
741baecd90bacd46de6f57aba79f251f0ced5967b4450a57e13c61e632e87af0
|
|
BLAKE2b-256 checksum How to use checksums |
7e2fd56bdd2b56a4284454ac70650b18d41dbea95299a7917802da03d9386a76
|
| Upload date | |
|
Uploaded using Trusted Publishing? What is trusted publishing? |
Yes |
| Uploaded via |
twine/7.0.0 CPython/3.13.14
|
Provenance
Provenance describes where a file came from. On PyPI, provenance is shared via attestations, which provide a verifiable record of the build or publishing details. View details, limitations and caveats.
PyPI Publish Attestation
PyPI verified that this artifact, at this checksum, originated from the publisher listed below.
Signed by GitHub Actions, verified by PyPI on Oct 15, 2026.
Transparency log













