
Prohori (প্রহরী)
























A laptop-sized mini-SOC: from raw logs to detections, enriched incidents and analyst-ready reports, with honest machine-learning evaluation and a streaming data pipeline.
Prohori (প্রহরী) is Bengali for "guard". It is an open-source, defensive security-operations toolkit in Python that runs on a single laptop with free tools only, offline by default.
Status: alpha (v0.2.0). One command goes from a log file to scored incidents and shareable reports, a labelled attack simulator measures the rules, and v0.2.0 adds machine learning: anomaly detectors over your own logs, and flow models on public datasets evaluated with leakage controls, a model card and a cross-dataset test. The streaming pipeline and the LLM analyst follow. See the CHANGELOG and the roadmap.
60-second demo
pipx install prohori        # or: pip install prohori
prohori demo
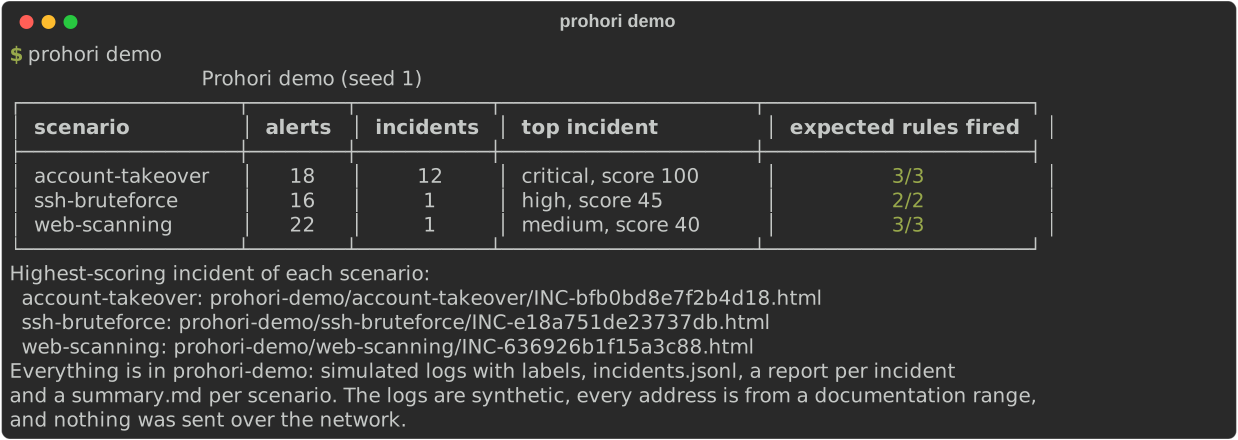
The demo simulates an account takeover, an SSH brute force and a web scan, triages each one
offline and writes an HTML report per incident to prohori-demo/. It needs no configuration and
sends nothing over the network. Sample reports: Markdown,
HTML (download and open it) and
redacted.
Contents
- What it does
- Install
- Quick start
- Example: an account takeover
- Commands
- Built-in detection rules
- How well the rules work
- Machine learning
- Streaming pipeline
- Privacy and safety
- Documentation
- Limitations
- Roadmap
- Development
What it does
flowchart LR
    A[Log files<br>auth.log, nginx, app JSON] --> B[parse<br>common event schema]
    B --> C[detect<br>15 YAML rules<br>+ anomaly detectors]
    C --> D[incidents<br>group, score, ATT&CK]
    E[enrich<br>GeoLite2, AbuseIPDB, VirusTotal] --> D
    D --> F[report<br>Markdown, HTML, JSON, CSV]
| Stage | Today |
|---|---|
| Parse | Linux auth.log (sshd, sudo, PAM), nginx/Apache access logs, application security events (JSON Lines) and any JSON Lines layout through a YAML field mapping, into one typed event schema. Format detection, streaming with bounded memory, hostile input handled (oversized lines, bad encodings, control characters). |
| Detect | 15 readable YAML rules (Sigma-inspired) with field modifiers, thresholds, distinct counts, ratios, sliding and tumbling windows and ordered sequences. Every rule ships with test fixtures and a runbook; regular expressions run on RE2, so no pattern can hang a run. With --models, anomaly detectors (robust z-score, Isolation Forest) also flag source IPs that behave unlike the rest of the log. |
| Enrich | IP geolocation, network owner and reputation from local GeoLite2 files, AbuseIPDB and VirusTotal, all optional. SQLite cache, daily budgets, rate limiting and bounded retries. Private and documentation addresses never leave the machine. |
| Incidents | Related alerts (same IP, account, request or session within a time gap) become one incident with a points-based score you can read line by line, severity, confidence, MITRE ATT&CK v20.0 mapping, a timeline, recommended actions and stated limitations. Detects sign-ins from an IP or app new to the account. |
| Simulate | Eight labelled attack scenarios (SSH brute force, password spraying, credential stuffing, token reuse, account takeover, web scanning, injection, admin misuse) hidden in realistic background activity, byte-identical for a seed, documentation IP addresses only. Used to measure every rule's precision and recall. |
| Report | Markdown, a self-contained HTML page, JSON or a CSV timeline, with an appendix of input and rule-file SHA-256 hashes. --redact replaces account names, ids and emails (and optionally IPs) with keyed pseudonyms, and refuses to write a report that would still leak one. |
| Stream | The same parsers, rules and incident builder, continuously: lite mode in one process with DuckDB (no Docker), or a Docker stack with Redpanda, one container per stage and a PostgreSQL warehouse. Follow live logs through rotation or replay files, with at-least-once delivery, dead letters and each row stored once. |
Prohori only recommends actions. It never blocks addresses, disables accounts or touches remote systems.
Install
Prohori needs Python 3.11 or newer. CI tests it on Linux and Windows; macOS should work but is not tested.
- From PyPI:
pipx install prohoriputs theprohoricommand in its own environment;pip install prohoriworks in any virtual environment. Optional parts are extras:pip install "prohori[geoip]"for local GeoLite2 files,pip install "prohori[ml]"for the machine-learning code (scikit-learn, pandas, pyarrow) andpip install "prohori[pipeline]"for the streaming pipeline (DuckDB, confluent-kafka, psycopg). The base install never needs them. - As a Docker image:
docker run --rm ghcr.io/utshabasak/prohori:latest demoruns the same command line with the pipeline extra, for linux/amd64 and linux/arm64. Mount a folder to read your own logs:docker run --rm -v "$PWD:/data" ghcr.io/utshabasak/prohori triage /data/auth.log. - From source: install uv, then
git clone https://github.com/UtshaBasak/Prohori.git && cd Prohori && uv sync, and run commands asuv run prohori .... The sample files used below are in the repository.
Quick start
Everything below runs offline on the synthetic samples in the repository (run from a clone).
uv run prohori triage samples/logs/account-takeover.jsonl -o triage/   # the whole pipeline
uv run prohori parse samples/logs/auth.log                      # normalise a log
uv run prohori detect samples/logs/auth.log                     # run the 15 rules
uv run prohori enrich 203.0.113.7 --offline                     # look up an IP (demo data)
uv run prohori incidents samples/logs/account-takeover.jsonl    # group alerts into incidents
uv run prohori report samples/incidents/INC-ee7c8818fbb34989.json -f html -o report.html
uv run prohori simulate account-takeover --seed 1 --out out/      # your own labelled attack
prohori triage writes triage/summary.md, triage/incidents.jsonl and an HTML report per
incident. Open a report in a browser: one file, no scripts, no external resources. For your own
logs, prohori triage /var/log/auth.log --year 2026 -o triage/ works the same way (add
--redact-ips before sharing the output).
Example: an account takeover
samples/logs/account-takeover.jsonl is a synthetic attack on a web shop account: twelve wrong
passwords from one IP in 33 seconds, a successful sign-in, two-step verification switched off and
the bKash payout number changed. Prohori raises four alerts and joins them into one critical
incident:
$ uv run prohori incidents samples/logs/account-takeover.jsonl     # first lines
INC-ee7c8818fbb34989  critical  score 100
+-------------------------------------------------------------------------------------------------+
| title       | Successful sign-in after many failures from one IP and 3 related alerts           |
| time (UTC)  | 2026-10-24 21:10:00 - 2026-10-24 21:13:10                                         |
| confidence  | high                                                                              |
| rules       | PRH-ACCT-001, PRH-AUTH-001, PRH-AUTH-003                                          |
| entities    | source.ip: 203.0.113.7                                                            |
|             | user.email_hash: 0cc175b9c0f1b6a831c399e269772661                                 |
|             | user.id: u-2001                                                                   |
Every point of the score is explained (from prohori report):
| Points | Reason |
|---|---|
| +50 | Most severe alert: PRH-AUTH-003 (critical) |
| +20 | 2 more rules fired: PRH-ACCT-001, PRH-AUTH-001 |
| +20 | A sign-in succeeded after failed attempts |
| +15 | Sensitive account or admin change: account.2fa.disabled, account.bkash.changed |
| +20 | Reputation of 203.0.113.7: abuse confidence 97; 9 vendors flag it as malicious (from bundled demo data) |
| +10 | Sign-in to u-2001 from 203.0.113.7, an IP not seen for this account before (1 earlier IP) |
| +5 | Sign-in to u-2001 with client web, not seen for this account before |
| -40 | Capped at 100 |
| 100 | Total |
The report adds the timeline, the IP's enrichment, the ATT&CK techniques (T1110 Brute Force, T1078 Valid Accounts, T1098 Account Manipulation, T1556.006 Multi-Factor Authentication), recommended actions from the runbooks and the limitations, such as "single log source" and "enrichment is bundled demo data".
Commands
| Command | What it does | Docs |
|---|---|---|
prohori demo |
Simulate attacks, triage them and show the results; no configuration, offline | CLI.md |
prohori triage FILE |
Log in, incidents and a report per incident out (--format, --redact, --online) |
CLI.md |
prohori parse FILE |
Parse and normalise a log; table or JSON Lines | PARSERS.md |
prohori detect FILE |
Run the 15 built-in rules (and --rules DIR, --models for the anomaly detectors); exit code 3 when alerts are found |
RULES.md |
prohori rules list / validate / test |
Show, check and test detection rules | RULES.md |
prohori enrich IP... |
Geolocation and reputation; --offline never uses the network |
ENRICHMENT.md |
prohori incidents FILE |
Parse, detect and group alerts into scored incidents; offline enrichment unless --online |
INCIDENTS.md |
prohori report INCIDENT |
Render an incident as md, html, json or csv; --redact, --redact-ips |
REPORTS.md |
prohori simulate SCENARIO --out DIR |
Write a labelled attack scenario (--list, --seed, --variant heldout, --set) |
SIMULATOR.md |
prohori score FLOWS --model NAME |
Score a CSV of network flows with a saved model; needs the ml extra (--fpr, --top, -f json) |
CLI.md |
prohori pipeline replay FILE... / tail FILE... |
Stream log files through the lite pipeline into DuckDB, or with --bootstrap into the Docker stack; tail follows live logs until Ctrl+C; needs the pipeline extra |
PIPELINE.md |
prohori pipeline up / status / down |
Start, check and stop the Docker stack (Redpanda, PostgreSQL, one container per stage); needs Docker and a clone | PIPELINE.md |
prohori version |
The version, ATT&CK release and built-in rule set |
Commands that take a file also read standard input with -, and every command has --help.
Exit codes are the same everywhere: 0 nothing found, 3 alerts or incidents found
(--exit-zero turns this off for CI pipelines), 1 nothing could be processed and 2 invalid
usage. The full reference is docs/CLI.md.
Built-in detection rules
| Rule | Detects | Severity | ATT&CK |
|---|---|---|---|
| PRH-AUTH-001 | Brute-force sign-in attempts from one IP | high | T1110, T1110.001 |
| PRH-AUTH-002 | Password spraying or credential stuffing from one IP | high | T1110.003, T1110.004 |
| PRH-AUTH-003 | Successful sign-in after many failures from one IP | critical | T1110, T1078 |
| PRH-AUTH-004 | Account lockouts across many accounts | high | T1110 |
| PRH-SESS-001 | Refresh-token reuse | high | T1528, T1550.001 |
| PRH-ACCT-001 | Sensitive account change shortly after sign-in | high | T1098, T1556.006 |
| PRH-AUTHZ-001 | Authorisation denials across many resources | medium | T1595.003 |
| PRH-ABUSE-001 | Rate-limit bursts or bot-check failures from one IP | medium | T1499.002 |
| PRH-ADMIN-001 | Admin role granted | high | T1098 |
| PRH-ADMIN-002 | Admin action at an unusual hour (22:00-07:00 local time) | medium | T1078 |
| PRH-WEB-001 | Web scanning from one IP | medium | T1595.003 |
| PRH-WEB-002 | Injection patterns in request paths | medium | T1190 |
| PRH-WEB-003 | Scanner or empty user agent at a high request rate | medium | T1595.002 |
| PRH-WEB-004 | Probes for sensitive files and admin tools | medium | T1595.003 |
| PRH-SSH-001 | SSH invalid-user storm or repeated authentication-limit disconnects | high | T1110, T1110.001 |
ATT&CK tags are verified against the official Enterprise ATT&CK v20.0 data. Each rule has a
runbook in src/prohori/runbooks/. Writing your own rules is covered in
docs/RULES.md.
How well the rules work
prohori simulate writes each attack scenario in two variants: default, the attack the rules
were designed for, and held-out, the same attack done the way a careful attacker would
(slower, from more addresses, with a browser user agent, obfuscated, or at another hour).
scripts/evaluate_rules.py runs all rules over five seeds of each and compares the alerts with
the line labels.
| Default | Held-out | |
|---|---|---|
| Attacks caught by at least one expected rule | 40/40 | 35/40 |
Expected rules that missed in the held-out variants (runs missed out of runs):
account-takeover: PRH-ACCT-001 3/5, PRH-AUTH-001 5/5admin-misuse: PRH-ADMIN-002 5/5credential-stuffing: PRH-AUTH-001 5/5, PRH-AUTH-002 5/5, PRH-AUTH-003 5/5password-spraying: PRH-AUTH-001 5/5ssh-bruteforce: PRH-AUTH-001 5/5web-scanning: PRH-WEB-003 5/5
PRH-ACCT-001 has low precision on purpose: it flags every sensitive change soon after a sign-in, including the owners' own. These are synthetic results written by the rules' author; the full per-rule table and caveats are in docs/SIMULATOR.md.
Machine learning
Two tracks, both evaluated the way a SOC would judge them: how many attacks are caught for how many false alerts, never accuracy.
Anomaly detection on your logs
--models on detect, incidents and triage cuts the parsed events into five-minute windows
per source IP, computes thirteen behaviour features (sign-in attempts and failures, accounts and
paths touched, 4xx share, path entropy, user-agent diversity, new clients, night activity) and
flags windows that are unusual for that log: a robust z-score (base install) and an Isolation
Forest (ml extra). Their alerts are marked detector_kind: model, explained with numbers only,
and join the incidents. Compared with the rules on the simulator's held-out attacks:
| Detector | Attacks caught | Precision | False alerts a run | Caught only by it |
|---|---|---|---|---|
| Detection rules (any rule) | 36/40 | 39 % | 6.47 | - |
| Robust z-score | 15/40 | 100 % | 0.0 | 0 |
| Fixed thresholds | 10/40 | 49 % | 0.93 | 0 |
| Isolation Forest | 17/40 | 70 % | 0.35 | 0 |
Held-out variants, seeds 1 to 5; an attack is caught when a true-positive alert is credited to it. Any rule counts here, which is why the rules catch one attack more than in the expected-rule count above.
The detectors catch the loud attacks (brute force, scanning, injection) with almost no false alerts, but nothing the rules miss: a slow or spread-out attack looks ordinary in a five-minute window from one address. They are a quiet second signal, not a new way to find attacks. Details and the false alerts' causes: docs/ANOMALY.md.
Flow models on public datasets
Intrusion-detection models trained on two public network-flow datasets, UNSW-NB15 and the improved CIC-IDS-2017:
- Leakage-controlled data. Identifier, address, port, time and label-derived columns are dropped; duplicates and contradictory rows are removed; test rows that also occur in training are removed and counted; transforms are learned from training data only. On CIC-IDS-2017, 18 % of the 2.1 million flows are duplicates once identifiers are gone, most of them port-scan probes; on UNSW-NB15, 41 % of the rows. DATASETS.md has the numbers.
- Two models: gradient boosting (supervised) and an Isolation Forest trained on benign traffic only.
- Honest metrics. Thresholds are chosen on a validation split for a 1 % or 0.1 % false-positive rate and frozen; the test split is scored once per seed. Reported: PR-AUC, recall, the false-positive rate actually reached on test, false alerts per 10,000 flows and recall per attack class, as mean and standard deviation over three seeds. Never accuracy.
| Dataset | Model | PR-AUC | Recall | Test FPR | False alerts / 10k |
|---|---|---|---|---|---|
| unsw-nb15 | Gradient boosting (supervised) | 0.952 | 46.00 % | 0.07 % | 4.2 |
| unsw-nb15 | Isolation Forest (benign only) | 0.522 | 0.71 % | 0.11 % | 6.9 |
| cicids2017 | Gradient boosting (supervised) | 0.999 | 99.98 % | 0.10 % | 8.7 |
| cicids2017 | Isolation Forest (benign only) | 0.527 | 0.00 % | 0.10 % | 8.7 |
Means over seeds 0, 1, 2 on the cleaned test splits, with thresholds chosen for a 0.1 % false-positive rate on the validation split and then frozen.
What the numbers say: gradient boosting catches about half of UNSW-NB15's attacks at a false-alert rate a SOC could live with, misses most fuzzing and analysis traffic, and on CIC-IDS-2017 catches nearly everything, which says more about that lab dataset than about the model. The 1 % threshold chosen on UNSW-NB15's validation data gave 4.5 % false positives on its test file. The Isolation Forest is not a usable detector on either dataset. Without the leakage controls the same pipeline would report a PR-AUC of 0.989 instead of 0.952 on UNSW-NB15. Details, failure cases and limitations: docs/MODEL_CARD.md.
Do the models work on another network? Not usefully. Trained on the twelve features both datasets share and tested on the other dataset, gradient boosting's ROC-AUC falls from 0.95 and 1.00 to 0.64 and 0.61, weak but above chance, and the threshold that gave 1 % false positives at home flags 42 % to 60 % of the other dataset's benign flows:
| Trained on → tested on | ROC-AUC, same dataset | ROC-AUC, other dataset | PR-AUC (chance), same dataset | PR-AUC (chance), other dataset | Benign flows flagged on the other dataset (1 % threshold) |
|---|---|---|---|---|---|
| unsw-nb15 → cicids2017 | 0.952 | 0.639 | 0.918 (0.33) | 0.323 (0.16) | 42.2 % |
| cicids2017 → unsw-nb15 | 1.000 | 0.614 | 0.999 (0.16) | 0.404 (0.33) | 60.5 % |
Gradient boosting, means over seeds 0, 1, 2. ROC-AUC: 0.5 is chance. PR-AUC: chance is the attack share, in brackets.
A flow model trained on one lab's traffic learns that lab. The mapping, its losses and the per-class results are in the model card.
uv run python scripts/download_datasets.py fetch cicids2017      # about 330 MB
uv run python -m prohori.ml.train --dataset cicids2017 --seeds 0 1 2
uv run python -m prohori.ml.transfer --seeds 0 1 2               # the cross-dataset test
prohori score flows.csv --model cicids2017/hgb-seed0              # score your own flows
prohori score reads a CSV of flows in the layout the model was trained on (CICFlowMeter output
for a CIC-IDS-2017 model) and lists the flagged flows; see docs/CLI.md.
Streaming pipeline
The batch commands read a file and stop. prohori pipeline keeps going. Lite mode runs the same
parsers, rules and incident builder as a chain of consumers in one process, without Docker, and
stores everything in a DuckDB file:
pip install "prohori[pipeline]"
prohori simulate web-scanning --seed 1 --out logs   # write a simulated log to replay
prohori pipeline replay logs/web-scanning.log --times 2   # replay twice: each row stored once
prohori pipeline tail /var/log/auth.log --year 2026       # follow a live log until Ctrl+C
# query the results with the DuckDB command-line tool (a separate download):
duckdb .prohori/pipeline/prohori.duckdb "SELECT severity, score, title FROM incidents"
flowchart LR
    T[tail / replay] -->|raw-logs| N[normalise]
    N -->|events| D[detect]
    D -->|alerts| I[incidents]
    N & D & I --> S[(DuckDB)]
    N -.->|dead-letter| S
- Same answers as batch. For every simulator scenario, the incidents the stream writes are
exactly those of
prohori incidentson the same file. That holds even when the file is replayed twice, which CI tests on Linux and Windows. - Nothing lost, nothing doubled. Delivery is at least once (publish, fsync, then commit). Every id is a hash of its content, so a replay, a redelivery or a crash mid-run adds no rows. Duplicate events are dropped before the rules, so they cannot push a threshold over its limit.
- Bad input is set aside. Lines no parser accepts and malformed messages go to a dead-letter table with the reason, and are counted.
- Live logs. The tailer survives rotation by rename or truncation (on Windows too, without blocking the writer's rotation) and continues where it stopped after a restart. Ctrl+C finishes cleanly.
- Honest limits. Lite mode handles about 2,800 lines a second on a laptop, a single host's
logs, against about 14,000 for the batch command. Its topics are not trimmed, and
--modelsstays a batch feature.
The Docker stack runs the same stages as separate containers over Redpanda (a Kafka-compatible broker), with a PostgreSQL warehouse, from a clone of the repository:
uv run prohori pipeline up                    # build, start and wait until every service is healthy
uv run prohori simulate web-scanning --seed 1 --out logs   # write a simulated log to replay
uv run prohori pipeline replay logs/web-scanning.log --bootstrap 127.0.0.1:19092
uv run prohori pipeline status                # services, health and rows in the warehouse
uv run prohori pipeline down                  # --volumes also deletes the data
| Service | What it is | Memory limit |
|---|---|---|
redpanda |
Kafka-compatible broker, one node | 1.5 GB |
postgres |
Warehouse (raw schema) |
512 MB |
normalise, detect, incidents, sink |
One Prohori container per stage | 256-384 MB each |
Replaying a 50,700-line log, the whole stack peaked at about 700 MB. A smoke test in CI starts it from empty volumes, replays a simulated attack twice and checks that the warehouse holds each event once and exactly the incidents of the batch command. Images are pinned by digest, the containers run unprivileged, and the ports are bound to 127.0.0.1 only.
Details: docs/PIPELINE.md.
Warehouse models. A dbt project (pipeline/dbt/) turns the stored rows into tested tables
on either database:
- daily attack counts, alerts per rule, top source addresses and incident durations;
- rule precision and detection latency, and time to detect each simulated attack (from the simulator's labels);
- flow-model performance over time.
uv sync --group dbt
uv run python scripts/build_lite_warehouse.py --db .prohori/pipeline/prohori.duckdb
uv run dbt build --project-dir pipeline/dbt --profiles-dir pipeline/dbt    # --target postgres for the stack
dbt build runs 68 data-quality checks: keys, nulls, accepted values, ranges, duplicates,
cross-table consistency and future timestamps. A separate freshness check covers the inputs. On
the simulator's eight scenarios, the models' rule precision equals the simulator's own
evaluation alert for alert, which CI checks. Every attack was detected, the fastest in 0 s and
the slowest (an admin acting at night) in 252 s. Details: docs/WAREHOUSE.md.
Dashboards. prohori pipeline up also starts Grafana on http://127.0.0.1:13000, with three
dashboards provisioned from pipeline/grafana/. They open without a login or any setup:
- Overview: events, alerts and incidents over time, rule hits and top sources. It reads the raw tables, so it fills as soon as a replay is stored.
- Detection quality: rule precision, time to detect, detection latency and flow-model performance, from the dbt marts.
- Pipeline health: time since the last stored event, rows per minute and dead letters.
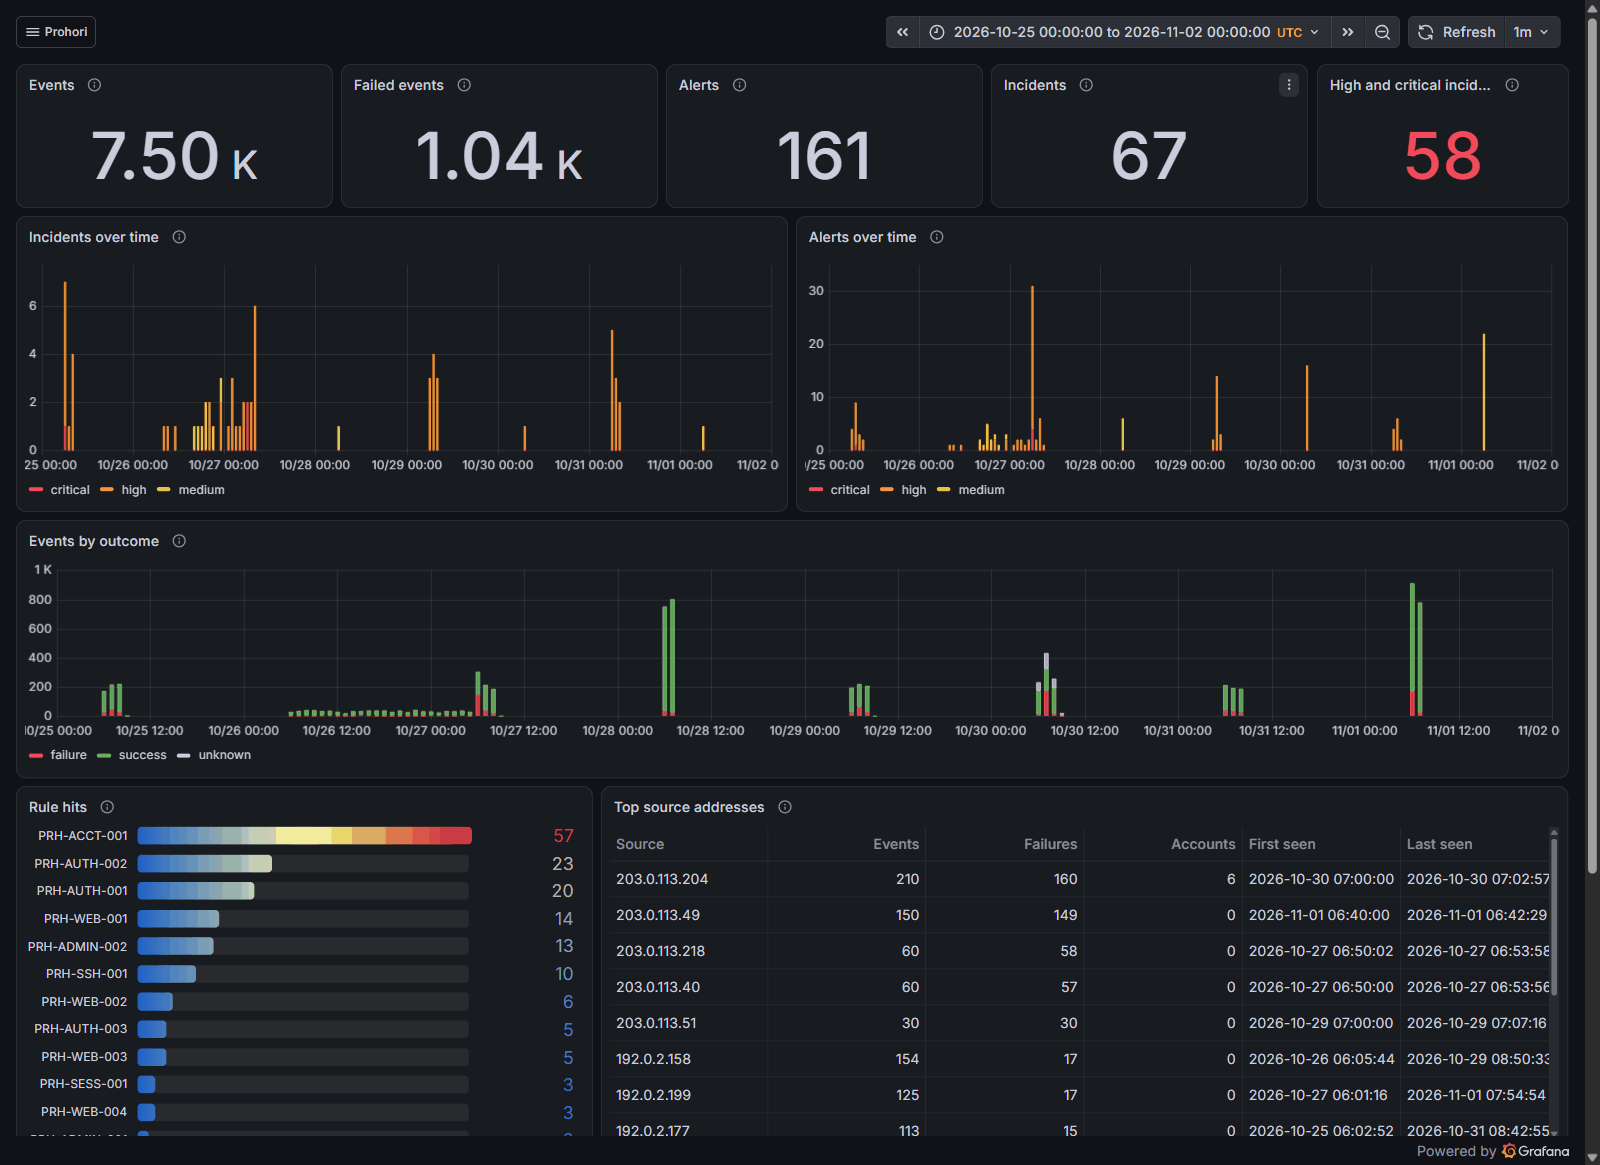
Grafana reads through its own database role, which can only SELECT. The smoke test runs every
panel's query through Grafana after a replay. Details: docs/DASHBOARD.md.
Scheduled jobs. prohori pipeline up --orchestration adds Airflow (http://127.0.0.1:18080)
with five DAGs:
| Job | When | What it does |
|---|---|---|
| Backfill | By hand | Replays all eight simulated scenarios with their labels, then builds the marts |
| Data quality | Hourly | dbt build with its 68 checks, and a freshness check on the events |
| Nightly evaluation | 02:00 UTC | Retrains the flow models; the run fails if recall drops below 0.75 |
| Incident digest | 06:00 UTC | The last day's incidents, rules and dead letters, as Markdown and JSON |
| Enrichment refresh | 03:30 UTC | Keeps the incident stage's enrichment cache current (offline without API keys) |
Each task runs a prohori command (pipeline digest, check-recall, refresh-enrichment) or
dbt, so every job also works without Airflow. CI imports the DAGs with Airflow on Linux and runs
each one in the stack. Details: docs/ORCHESTRATION.md.
Privacy and safety
- Offline by default. Nothing leaves the machine unless you configure API keys and, for
incidents, pass
--online. Tests block real network access. - Private, reserved and documentation IP addresses are never sent to outside services, even when keys are configured. VirusTotal keeps the addresses it is asked about, so querying is a deliberate choice.
- Logs are untrusted input. Parsers cap line lengths and strip control characters; reports escape every value for their format (HTML, Markdown, CSV formulas) and are tested with hostile input.
- Shareable reports.
--redact/--redact-ipsuse keyed pseudonyms and fail closed. - No secrets in the repository. API keys live in the environment or a git-ignored
.env; gitleaks runs on every commit and in CI. - Samples are synthetic and use documentation address ranges only. Public datasets are downloaded only on an explicit command, never committed and never fetched at import time.
Third-party data terms (MITRE ATT&CK, GeoLite2, AbuseIPDB, VirusTotal) are summarised in docs/LICENSES.md.
Documentation
| Document | Contents |
|---|---|
| CLI reference | Every command, the shared options, formats and exit codes |
| Architecture | Components, data flow and run modes |
| Event schema | Event, Alert and Incident fields |
| Parsers | Supported formats, options and field mappings |
| Rules | Rule format, evaluation semantics, testing and the built-in rules |
| Enrichment | Providers, privacy, cache, limits and configuration |
| Incidents | Grouping, the scoring table, confidence and limitations |
| Reports | Formats, sections, redaction and output safety |
| Simulator | Attack scenarios, labels, and rule precision and recall |
| Datasets | UNSW-NB15 and CIC-IDS-2017: getting them, licences, leakage controls |
| Model card | Flow detectors: intended use, evaluation, results, failure cases |
| Anomaly detection | --models: features, detectors, comparison with the rules, false alerts |
| Streaming pipeline | Lite mode and the Docker stack: topics, delivery guarantees, dead letters, tailing, the tables |
| Warehouse models | dbt models, data-quality checks, labels and model results, results on the simulator |
| Dashboards | The Grafana dashboards: panels, set-up, access, time range, changing a dashboard |
| Scheduled jobs | The Airflow DAGs: backfill, data quality, nightly evaluation, digest, enrichment refresh |
| Decisions | Architecture decision records |
| Releasing | How releases are built, tested and published |
| Third-party terms | Data and service licences |
| Wiki | Installation, quick start and guides |
Limitations
Prohori is honest about what it does not do:
- The streaming stack runs on one machine. It is a single-node broker with no authentication, built from a clone; dashboards and scheduled jobs come later in v0.3.0. Prohori never blocks, disables or changes anything.
- Rules see only what the logs say. Request bodies, headers and encrypted traffic are not inspected; the web rules use the request line only.
- Thresholds can be evaded. The held-out evaluation shows that slow or widely distributed attacks stay under the brute-force and spraying thresholds; see How well the rules work.
- Some rules are noisy by design. PRH-ACCT-001 flags every sensitive change shortly after a sign-in, including the owner's own; incidents list such benign causes as limitations.
- The evaluation is synthetic and written by the rules' author. Test the rules on your own logs before relying on them.
- Enrichment free tiers are small and non-commercial, and reputation data is evidence, not proof.
- Supported formats are
auth.log, nginx/Apache access logs and JSON Lines (built-in app layout or a field mapping). Windows event logs and cloud audit logs are not supported yet.
Roadmap
| Release | Contents | State |
|---|---|---|
| v0.1.0 | Batch core: parsers, rules, enrichment, incidents, reports, log simulator with rule evaluation, triage and demo commands |
Released |
| v0.2.0 | Machine learning: leakage-controlled intrusion detection on public flow datasets, log-derived anomaly detection, model cards | Released |
| v0.3.0 | Pipeline: streaming core and lite mode, Redpanda and PostgreSQL in Docker, dbt models and data-quality checks, Grafana dashboards, Airflow jobs; Docker image on GitHub Packages | Released |
| v1.0.0 | Optional LLM analyst (opt-in, redacted input, validated output), final polish | Planned |
Development
uv sync                        # create .venv with the package and dev tools
uv run pre-commit install      # optional: run checks on every commit

uv run ruff check .            # lint
uv run ruff format --check .   # formatting
uv run mypy                    # strict type check
uv run pytest --cov            # tests with coverage (kept at 85 % or more)
uv run prohori rules test      # run every rule against its fixtures
uv run pytest tests/unit/ml -q # dataset and leakage tests (synthetic fixtures, no downloads)
uv run pytest tests/integration # end to end, including lite mode against the batch command
uv sync --group dbt && uv run pytest tests/integration/test_dbt.py  # the dbt models
CI runs on Linux and Windows with Python 3.11 to 3.14, plus CodeQL, secret scanning, parser fuzzing and the OpenSSF Scorecard. All GitHub Actions are pinned to commit SHAs. See CONTRIBUTING.md for conventions.
Security
To report a vulnerability, see SECURITY.md.
License
MIT. Third-party data has its own terms; see docs/LICENSES.md.
1 maintainer

Metadata
1 maintainer
Release files for prohori 0.3.0
For a detailed explanation of source distributions (sdists) and built distributions (wheels), please see the package formats documentation.
Source distribution (sdist)
| File | Size | Uploaded | Provenance | Actions |
|---|---|---|---|---|
| prohori-0.3.0.tar.gz | 420.1 kB | With provenance | Details for prohori-0.3.0.tar.gz |
Built distribution (wheel)
| File | Interpreter | ABI | Platform | Actions Reset |
|---|---|---|---|---|
| prohori-0.3.0-py3-none-any.whl | Python 3 | none | any | Details for prohori-0.3.0-py3-none-any.whl |
Total release size: 719.5 kB
Release files / prohori-0.3.0.tar.gz
| Download URL | prohori-0.3.0.tar.gz |
|---|---|
| Size | 420.1 kB |
| Tags | Source |
|
SHA-256 checksum How to use checksums |
3a931507154c687a13864a4f041884bf49c05610f90984355e02895251c41238
|
|
BLAKE2b-256 checksum How to use checksums |
ec8c6ddeea73b49dfa5d87ec01d361a8777ba076e0a63959d785f8226ab8a704
|
| Upload date | |
|
Uploaded using Trusted Publishing? What is trusted publishing? |
Yes |
| Uploaded via |
twine/7.0.0 CPython/3.13.16
|
Provenance
Provenance describes where a file came from. On PyPI, provenance is shared via attestations, which provide a verifiable record of the build or publishing details. View details, limitations and caveats.


PyPI Publish Attestation
PyPI verified that this artifact, at this checksum, originated from the publisher listed below.
Signed by GitHub Actions, verified by PyPI on Nov 2, 2026.
Transparency logRelease files / prohori-0.3.0-py3-none-any.whl
| Download URL | prohori-0.3.0-py3-none-any.whl |
|---|---|
| Size | 299.4 kB |
| Tags | Python 3 |
|
SHA-256 checksum How to use checksums |
be5a8ae5faf1646ed372f6c8a339454e1608d35ce02fa3eeae861a5fe568cefb
|
|
BLAKE2b-256 checksum How to use checksums |
3a7872452451d818980f80c8a914eef3ceb3a2e1e245beea76b8c8ed08ef51ca
|
| Upload date | |
|
Uploaded using Trusted Publishing? What is trusted publishing? |
Yes |
| Uploaded via |
twine/7.0.0 CPython/3.13.16
|
Provenance
Provenance describes where a file came from. On PyPI, provenance is shared via attestations, which provide a verifiable record of the build or publishing details. View details, limitations and caveats.
PyPI Publish Attestation
PyPI verified that this artifact, at this checksum, originated from the publisher listed below.
Signed by GitHub Actions, verified by PyPI on Nov 2, 2026.
Transparency logSecurity for prohori 0.3.0
Provenance
Provenance describes where a file came from. On PyPI, provenance is shared via attestations, which provide a verifiable record of the build or publishing details. View details, limitations and caveats.
Full provenance
All 2 files in this release have been uploaded with provenance metadata.
Attestation for prohori-0.3.0.tar.gz
PyPI Publish Attestation
PyPI verified that this artifact, at this checksum, originated from the publisher listed below.
Signed by GitHub Actions, verified by PyPI on Nov 2, 2026.
Transparency logA note on package security
PyPI is a repository for distributing packages, not a service for auditing them. While third-party security researchers and our staff do their best to detect and remove malicious packages, PyPI cannot guarantee the quality, security or suitability of any given package.
To learn more about protecting yourself from malicious actors, visit our package security documentation.














