
Promabbix
Connecting Prometheus to Zabbix.

TL;DR
This tooling allows you to keep you favourite monitoring tool Zabbix and have a production-ready integration with Prometheus in a way similar to AlertManager. It consists of 2 parts:
- Script to generate Zabbix Template from AlertManager-like definitions of Prometheus metrics
- GitOps tooling allowing you to manage the vast majority of your Zabbix installation in a Infrastructure-as-a-Code (IaaC) pattern (To-be-done)
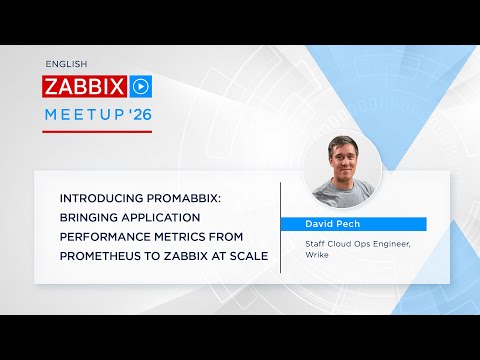
Zabbix Meetup Introduction
Usage
CLI Commands
Promabbix provides a command-line interface with multiple subcommands:
# Show available commands
promabbix --help

# Generate Zabbix template from alert configuration
promabbix generateTemplate <config-file> [OPTIONS]

# Available options for generateTemplate:
#   -o, --output PATH          Output file path (use "-" for STDOUT, default: -)
#   -t, --templates PATH       Custom template directory path
#   -tn, --template-name NAME  Template file name (default: prometheus_alert_rules_to_zbx_template.j2)
#   --validate-only           Only validate configuration without generating template
Local Development Usage
# Install dependencies
pip install -r requirements.txt -r requirements-dev.txt

# Validate configuration only
python -m promabbix.promabbix generateTemplate examples/minikube-alert-config.yaml --validate-only

# Generate template to file
python -m promabbix.promabbix generateTemplate examples/minikube-alert-config.yaml -o output.json

# Generate template to STDOUT
python -m promabbix.promabbix generateTemplate examples/minikube-alert-config.yaml

# Read from STDIN and output to STDOUT
cat examples/minikube-alert-config.yaml | python -m promabbix.promabbix generateTemplate -
Docker Usage
# Build the image
docker buildx build -t promabbix:local .
# or use image from DockerHub:
# docker pull promabbix/promabbix

# Get help
docker run promabbix:local --help
docker run promabbix:local generateTemplate --help

# Read data from STDIN and output to STDOUT
cat examples/minikube-alert-config.yaml | docker run -i promabbix:local generateTemplate - -o -

# Run with mounted directory and retrieve result file
docker run --mount type=bind,src=$(pwd)/examples/,dst=/mnt promabbix:local generateTemplate /mnt/minikube-alert-config.yaml -o /mnt/output.json

# Validate configuration only
docker run --mount type=bind,src=$(pwd)/examples/,dst=/mnt promabbix:local generateTemplate /mnt/minikube-alert-config.yaml --validate-only
Prometheus (VictoriaMetrics) to Zabbix Integration (simplified version of docs to understand the gist)
Our monitoring stack combines the Prometheus metrics with Zabbix in the following way:
- zabbix-agents run on VMs and provide OS-level monitoring (mostly)
- Prometheus scrapes Kubernetes clusters and other dynamic environments
- (End-result is that all metrics are sent to a single large VictoriaMetrics instance)
- we want all alerting and evaluation to be done in a single point that is Zabbix
- alerts are pushed to Slack and PagerDuty
Given these technologies have incompatible data model, we've come up with a following process on how to combine them:
- You define
PromQLqueries for your alerts (could be mostly taken fromalertmanagertemplates without change)- The main difference is that we just take the alert calculation and leave out the threshold comparison - this way, we have a history for the value in Zabbix (and not just when the alert is triggered)
- Queries results are filtered with LLD to create (static number of) pseudo-hosts
- Typically we use one pseudo-host for all Prod envs, QA envs
- Each pseudo-host will have items and triggers generated based on the definition
- So that each time-series resulting from Query can be tracked separately
ansiblebased tooling transfersYAMLdefinitions to live Zabbix instance (so you can track all the definitions in Git with IaaC principles)- Zabbix Templates are used behind-the-scenes, so the definitions can be maintained for a long time and kept in sync
Configuration Formats
Promabbix supports two configuration formats:
Unified Configuration Format (Recommended)
The modern approach uses a single YAML file containing all configuration sections:
# Single unified configuration file (e.g., service-alerts.yaml)
groups:
  - name: recording_rules
    rules:
      - record: elasticsearch_cluster_health_red
        expr: sum(elasticsearch_cluster_health_status{color="red"}) by (cluster)
  - name: alerting_rules
    rules:
      - alert: elasticsearch_cluster_health_red_simple
        expr: elasticsearch_cluster_health_red > 0
        annotations:
          description: "Elasticsearch cluster {{$labels.cluster}} is in RED state"
        labels:
          __zbx_priority: "AVERAGE"

prometheus:
  api:
    url: "http://victoria-metrics:8428/api/v1/query"
  labels_to_zabbix_macros:
    - pattern: '\{\{(?:\s*)\$value(?:\s*)\}\}'
      value: "{ITEM.VALUE1}"
    - pattern: '\{\{(?:\s*)\$labels\.(?P<label>[a-zA-Z0-9\_\-]*)(?:\s*)\}\}'
      value: "{#\\g<label>}"

zabbix:
  template: service_elasticsearch_cluster
  name: "Template Module Prometheus Elasticsearch Cluster"
  hosts:
    - host_name: elasticsearch-cluster-prod
      visible_name: "Service Elasticsearch Cluster PROD"
      host_groups: ["Prometheus pseudo hosts", "Production hosts"]
      link_templates: ["templ_module_promt_service_elasticsearch_cluster"]
      macros:
        - macro: "{$ES.CLUSTER.LLD.MATCHES}"
          value: "^prod-(us|eu)$"
  macros:
    - macro: "{$ES.THRESHOLD}"
      value: "1"
      description: "Elasticsearch cluster health threshold"

# Optional: Documentation for alerts
wiki:
  knowledgebase:
    alerts:
      alertings:
        "elasticsearch_cluster_health_red_simple":
          title: "Elasticsearch cluster in RED state"
          content: "See runbook for troubleshooting steps"
Legacy Multi-File Format (Backward Compatible)
The legacy approach splits configuration across multiple files:
Configuration definitions
Typically each directory is related to a single service and contains 3 types of files.
MYSERVICE_alerts.yaml- contains 2 parts:- recording_rules - these are being send to Prometheus/VictoriaMetrics backend for evaluation
- alerting_rules - how are values from the previous point evaluated inside Zabbix
groups:
  - name: recording_rules
    rules:
      - record: elasticsearch_cluster_health_red
        # this expression is evaluated inside Prometheus/VictoriaMetrics
        expr: sum(elasticsearch_cluster_health_status{color="red"}) by (cluster)
  - name: alerting_rules
    rules:
      - alert: elasticsearch_cluster_health_red_simple
        # this experssion is a trigger rule inside of zabbix
        expr: elasticsearch_cluster_health_red > 0

      # multiple alerts can be used for the same metric
      - alert: elasticsearch_cluster_health_red_advanced
        # Zabbix macros can be also used
        expr: elasticsearch_cluster_health_red > {$ES.THRESHOLD}
        annotations:
          description: At least one member of Elasticsearch {{$labels.cluster}} is reporting RED state.  summary: Elasticsearch {{$labels.cluster}} (at least one node) is reporting RED state.
        # Zabbix evaluation threshold
        for: 5m
        labels: # each alert can override general attributes
          __zbx_priority: "AVERAGE"
          grafana_dashboard: "p-abs/elasticsearch-clusters"
zabbix_vars.yamlThe LLD variables and pseudo-hosts definition - there are generated in Zabbix as Hosts
zabbix:
  template: service_elasticsearch_cluster
  name: "Template Module Prometheus service Elasticsearch Cluster"
  lld_filters:
    filter:
      conditions:
        - formulaid: "A"
          macro: "{#CLUSTER}" # ! "elasticsearch" cluster name
          value: "{$ES.CLUSTER.LLD.MATCHES}"
      evaltype: "AND"
  macros:
    - macro: "{$ES.CLUSTER.LLD.MATCHES}"
      description: "This macro is used in metrics discovery. Can be overridden on the host or linked template level."
      value: ".*"
    - macro: "{$SLACK.ALARM.CHANNEL.NAME}"
      description: "Macro for define additional endpoint for alert"
      value: "myteam_alerts"
  tags:
    - tag: service_kind
      value: elasticsearch
  hosts:
    - host_name: elasticsearch-cluster-prod
      visible_name: Service Elasticsearch Cluster PROD
      host_groups:
        - Prometheus pseudo hosts
        - Production hosts
        - Elasticsearch
      link_templates:
        - templ_module_promt_service_elasticsearch_cluster
      status: enabled
      state: present
      proxy: zbx-pr02
      macros:
        - macro: "{$ELASTICSEARCH.CLUSTER.LLD.MATCHES}"
          value: "^prod-(us|eu)$"
    - host_name: elasticsearch-cluster-qa
      visible_name: Service Elasticsearch Cluster QA
      host_groups:
        - Prometheus pseudo hosts
        - QA hosts
        - Elasticsearch
      link_templates:
        - templ_module_promt_service_elasticsearch_cluster
      status: enabled
      state: present
      proxy: zbx-pr02
      macros:
        - macro: "{$ELASTICSEARCH.CLUSTER.LLD.MATCHES}"
          value: "^(qa-.*)$"

  # you can customize alert messages
  labels:
    slack_alarm_channel_name: '{$SLACK.ALARM.CHANNEL.NAME:"{{$labels.job}}"}'
    grafana_dashboard: 'L-abc/elasticsearch-clusters'
wiki_vars.yamlAnd you can define docs the the alert is trigger. This is passed to Slack/PagerDuty, so the duty person has the links to all diagnostics tools and typically some hint (redbook) on how to manage the particular alert
wiki:
  templates:
    wrike_alert_config:
      templates:
        - name: 'elasticsearch cluster'
          title: 'Alerts regarding Elasticsearch clusters'
  knowledgebase:
    alerts:
      alertings:
        "elasticsearch_cluster_health_red_simple":
          title: "Elasticsearch cluster in RED state"
          content: |
            {{toc/}}
            # Overview
            This documentation generated from YAML file.
            # How to investigate the case
            * Go to Grafana dashboard, [link](https://grafana.company.net/d/L-abc/elasticsearch-clusters).
            ...
Validation rules
--validate-only checks the configuration against the schema and runs these additional checks:
- Trigger name length.
annotations.summarybecomes the Zabbix trigger and item prototype name, which is limited to 255 characters. The length is counted after{{$labels.X}}is replaced with{#X}and{{$value}}with{ITEM.VALUE1}. Put diagnostic detail inannotations.descriptionor the wiki section instead. - Escaping of
__zbx_*tags. The template JSON-escapesexprand the annotations itself, so quotes there are written as-is. The values of__zbx_trigger_expression,__zbx_trigger_description,__zbx_item_url,__zbx_item_delay,__zbx_item_timeout,__zbx_item_lifetime,__zbx_history,__zbx_trends,__zbx_item_unitsand__zbx_priorityare inserted into the generated JSON unescaped, so after YAML parsing they must already be valid JSON string content: every"must be written as\". In a YAML double-quoted string that is\\\", because\"is parsed by YAML into a bare". In a YAML single-quoted string write\".
labels:
  # wrong: YAML turns \" into a bare " and the generated template is broken
  __zbx_trigger_expression: "min({{item_full_key}},{$X.TIME})>{$X.RATE:\"{{$labels.k8s_cluster}}\"}"
  # right
  __zbx_trigger_expression: "min({{item_full_key}},{$X.TIME})>{$X.RATE:\\\"{{$labels.k8s_cluster}}\\\"}"
The loader discards YAML comments, so validation cannot see text that was dropped by accident. A closing quote
followed by more text (summary: "short" rest of the sentence, or # ... after a plain scalar) silently truncates
the value. Keep long text inside the quotes and let the length check report it.
Examples
- Generated pseudo-hosts in Zabbix


- LLD rules for the discovery on a template

- Zabbix Items collected on a host
- There is one time for executing a query to Prometheus/VictoriaMetrics
- For each time-series result, there is a separate Item tracking that particular combination of labels (and alert is connected to this Item)


- Item history can be visible in Zabbix

- When you receive an Alert in Slack, there are links to better align with a response

- If you receive an Alert via PagerDuty (mostly SysOps) - there is a clear connection to Zabbix Trigger (and Item triggering it)


- It is also possible to setup Zabbix Maintenance based on the Tags - so you won't receive the alerts (both in Slack and PagerDuty)

Limitations
- You need to use aggregate functions (
max,sumetc.), otherwise the metrics are typically flaky or might lead to explosion of items in Zabbix (comes out of a lot of experience here) - There are edge cases when the evaluation or logic is just different between Zabbix and Prometheus (typically
for:clause)
Compatibility Zabbix 6.0+
Development
Project Structure
The project follows a modular architecture:
src/promabbix/
├── cli/                    # CLI command implementations
│   ├── generate_template.py   # generateTemplate command
│   └── __init__.py
├── core/                   # Core business logic modules
│   ├── fs_utils.py            # File system operations (DataLoader, DataSaver)
│   ├── template.py            # Jinja2 template rendering
│   ├── validation.py          # Configuration validation
│   ├── migration.py           # Legacy format migration
│   └── data_utils.py          # Data validation utilities
├── schemas/               # JSON/YAML schemas
│   └── unified.yaml          # Unified configuration schema
├── templates/             # Jinja2 templates
│   └── prometheus_alert_rules_to_zbx_template.j2
└── promabbix.py          # Main CLI entry point
Local Development Setup
# Create and activate virtual environment
python3 -m venv .venv
source .venv/bin/activate

# Install dependencies
pip install -r requirements.txt -r requirements-dev.txt

# Install additional type checking dependencies
pip install mypy types-PyYAML

# Run the CLI locally
PYTHONPATH=src python -m promabbix.promabbix generateTemplate --help
Running Tests
The project includes comprehensive unit tests covering all functionality with 92% code coverage.
# Run all tests
python -m pytest tests/ -v

# Run tests with coverage
python -m pytest tests/ -v --cov=src/promabbix --cov-report=term-missing

# Run tests with coverage requirement (80% minimum)
python -m pytest tests/ -v --cov-fail-under=80 --cov=src/promabbix --cov-report=term-missing --cov-report=xml

# Run using the test runner script (recommended)
python run_tests.py
Code Quality Checks
The project maintains high code quality standards:
# Run linting
flake8 src/ --count --max-complexity=10 --max-line-length=127 --statistics

# Run type checking
mypy src/ --ignore-missing-imports

# All quality checks together (CI pipeline)
python run_tests.py && flake8 src/ --count --max-complexity=10 --max-line-length=127 --statistics && mypy src/ --ignore-missing-imports
Architecture Overview
- CLI Layer: Click-based commands with proper argument parsing and help
- Business Logic: Core modules for validation, template rendering, and file operations
- Dependency Injection: Testable architecture with mockable dependencies
- Error Handling: Rich console output with user-friendly error messages
- Type Safety: Full type annotations and mypy compliance
See tests/README.md for detailed information about the test suite.
1 maintainer

Metadata
1 maintainer
Release files for promabbix 0.2.0
For a detailed explanation of source distributions (sdists) and built distributions (wheels), please see the package formats documentation.
Source distribution (sdist)
| File | Size | Uploaded | |
|---|---|---|---|
| promabbix-0.2.0.tar.gz | 4.4 MB | Details |
Built distribution (wheel)
| File | Interpreter | ABI | Platform | Reset |
|---|---|---|---|---|
| promabbix-0.2.0-py3-none-any.whl | Python 3 | none | any | Details |
Total release size: 4.5 MB
Release files / promabbix-0.2.0.tar.gz
| Download URL | promabbix-0.2.0.tar.gz |
|---|---|
| Size | 4.4 MB |
| Tags | Source |
|
SHA-256 checksum How to use checksums |
8128244764159870781bd71ab1ea2ffdb6de83a4e4a182a74e9a1c6af88ab5bf
|
|
BLAKE2b-256 checksum How to use checksums |
92067479abd04a65fd28fa8949b5b03ce056a33fca695d47ffbc12a10790dfb4
|
| Upload date | |
|
Uploaded using Trusted Publishing? What is trusted publishing? |
Yes |
| Uploaded via |
twine/7.0.0 CPython/3.13.14
|
Provenance
Provenance describes where a file came from. On PyPI, provenance is shared via attestations, which provide a verifiable record of the build or publishing details. View details, limitations and caveats.


PyPI Publish Attestation
PyPI verified that this artifact, at this checksum, originated from the publisher listed below.
Signed by GitHub Actions, verified by PyPI on Oct 14, 2026.
Transparency logRelease files / promabbix-0.2.0-py3-none-any.whl
| Download URL | promabbix-0.2.0-py3-none-any.whl |
|---|---|
| Size | 29.1 kB |
| Tags | Python 3 |
|
SHA-256 checksum How to use checksums |
cdfcd0afee80078fc8435770df71b61cee229c825beec404a2608d0ce8d07285
|
|
BLAKE2b-256 checksum How to use checksums |
508af653c15d7f3ae689a43808ed08a1f17f014d3db561884ba97a0fa74826ea
|
| Upload date | |
|
Uploaded using Trusted Publishing? What is trusted publishing? |
Yes |
| Uploaded via |
twine/7.0.0 CPython/3.13.14
|
Provenance
Provenance describes where a file came from. On PyPI, provenance is shared via attestations, which provide a verifiable record of the build or publishing details. View details, limitations and caveats.
PyPI Publish Attestation
PyPI verified that this artifact, at this checksum, originated from the publisher listed below.
Signed by GitHub Actions, verified by PyPI on Oct 14, 2026.
Transparency log













