
This tool utilises sophisticated PCA with a cosine kernel to generate informative visualisations of multi-dimensional data in three-dimensional space. Following the PCA process, the data is normalised by shifting each point to a centroid and making it the unit norm. To enhance the visualisation, vectors are additionally scaled with precision to move the farthest points closer to the surface of the sphere. The outcome is an engaging and instinctive representation of the data in spherical format. The tool initiates interactive visualisations in a new tab of your default web browser, facilitating data exploration and analysis.
Basic Usage
Init visualizer
import pandas as pd
from sklearn import datasets
from sklearn.datasets import make_blobs
from prosphera.projector import Projector

# Instantiate the class
visualizer = Projector()
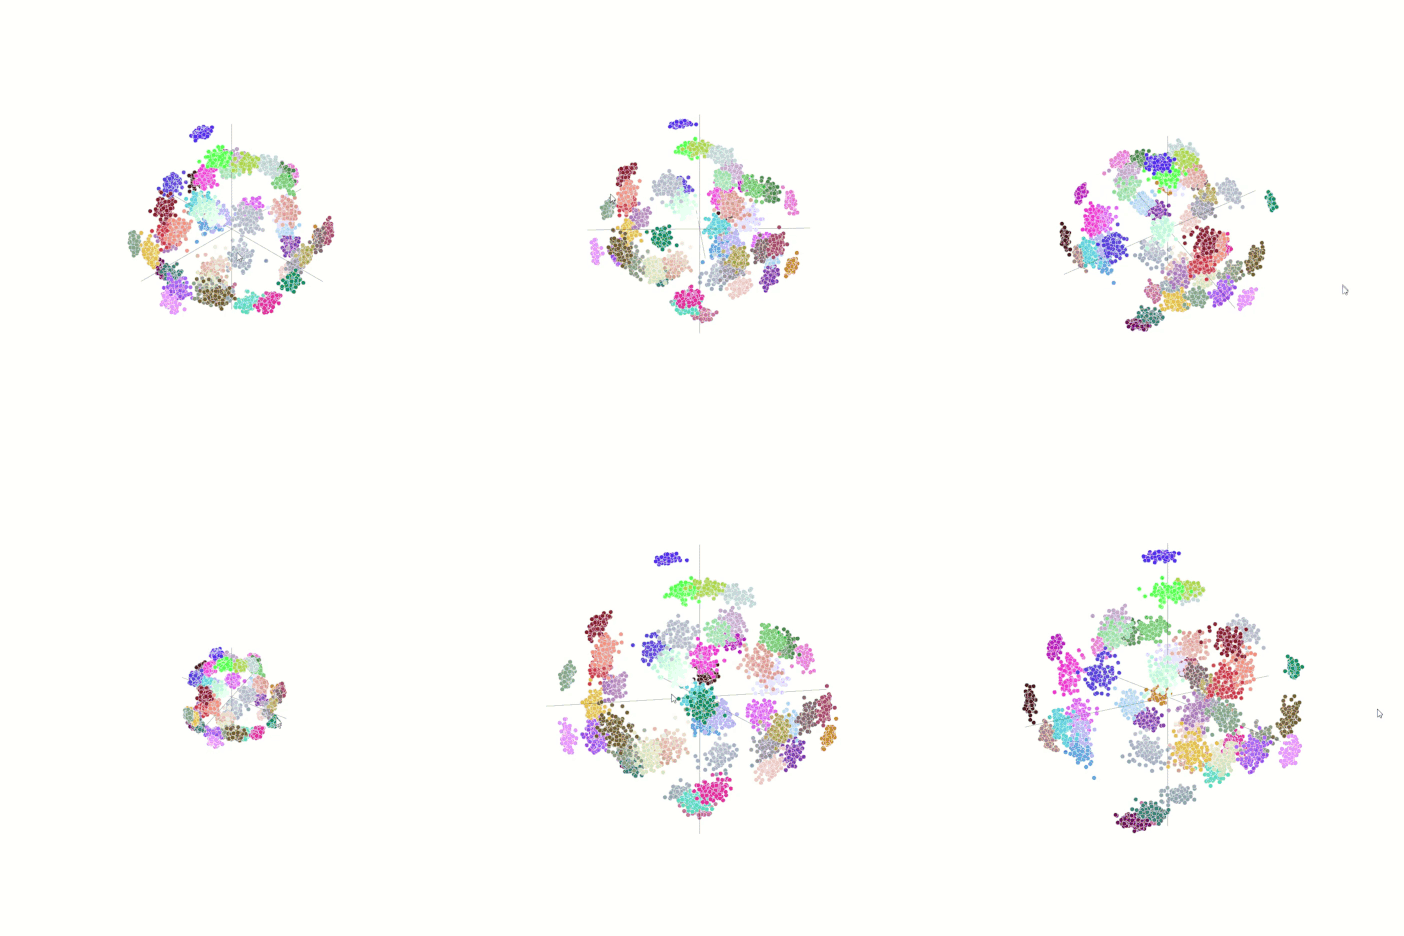
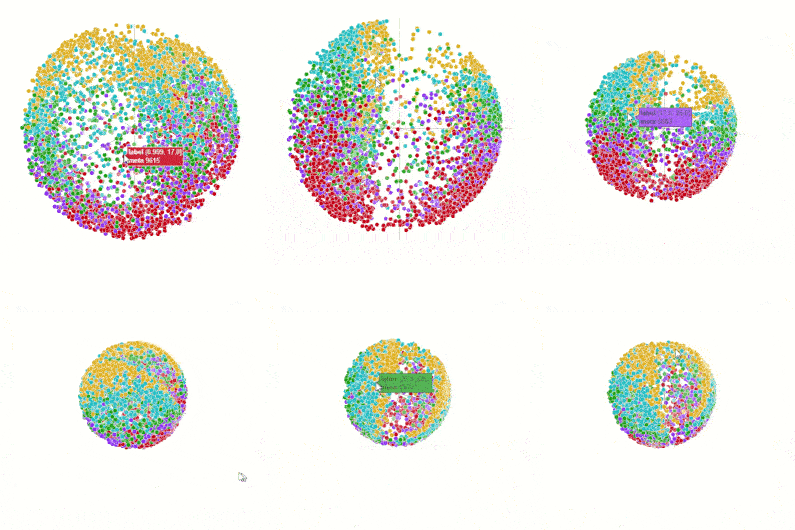
Generated dataset
# Generate data
data, labels = make_blobs(
    n_samples=5000,
    centers=50,
    n_features=25,
    random_state=1234)

# Call the visualize method to generate and display the visualization
visualizer.project(
    data=data,
    labels=labels)
Browser tab:
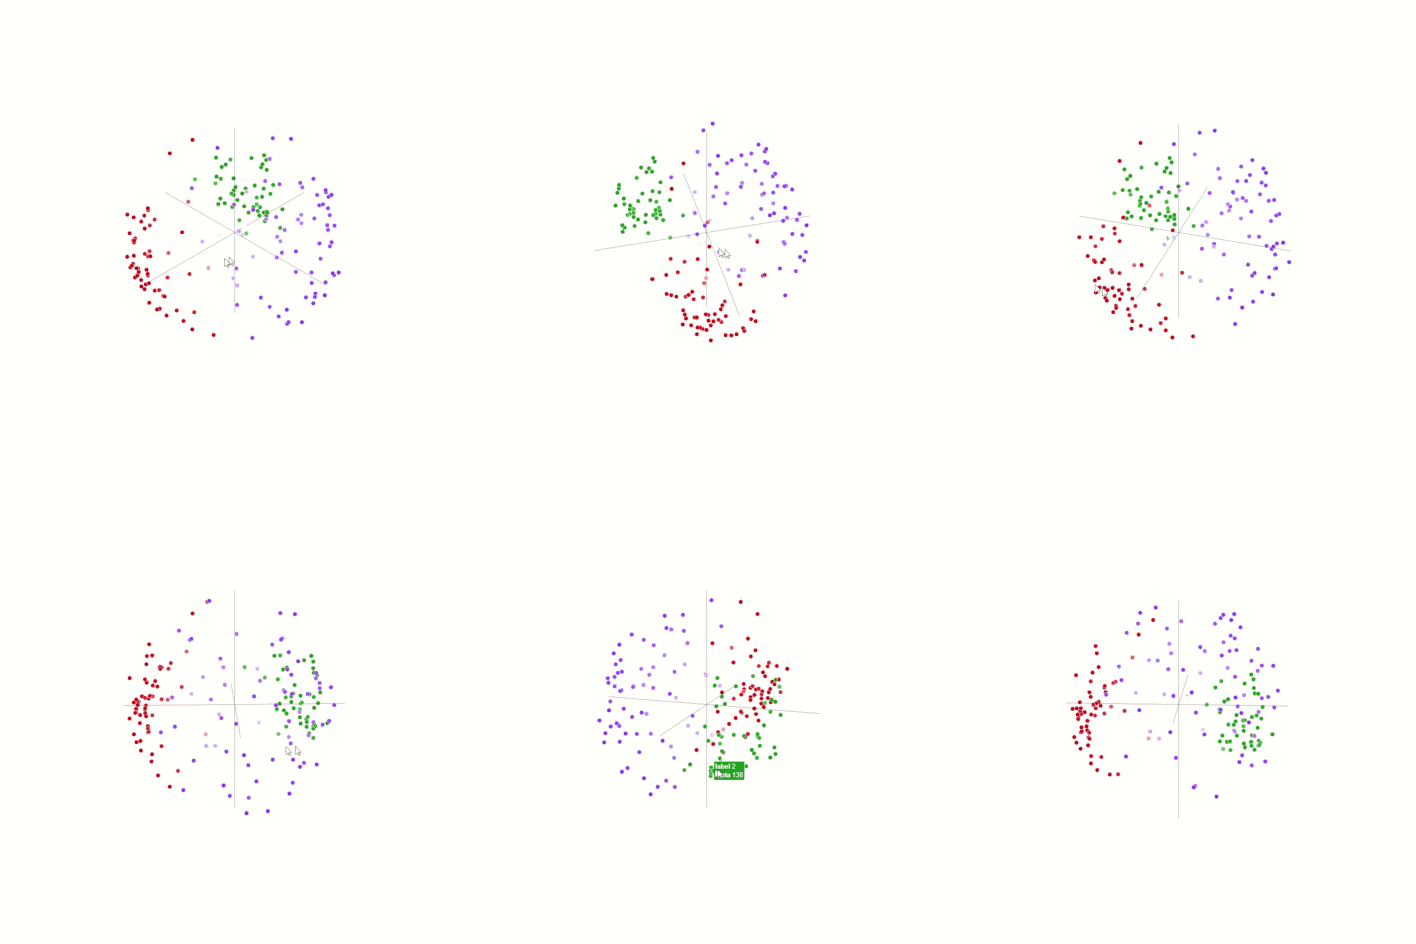
Wine dataset
wine = datasets.load_wine()

visualizer.project(
    data=wine['data'],
    labels=wine['target'])
Browser tab:
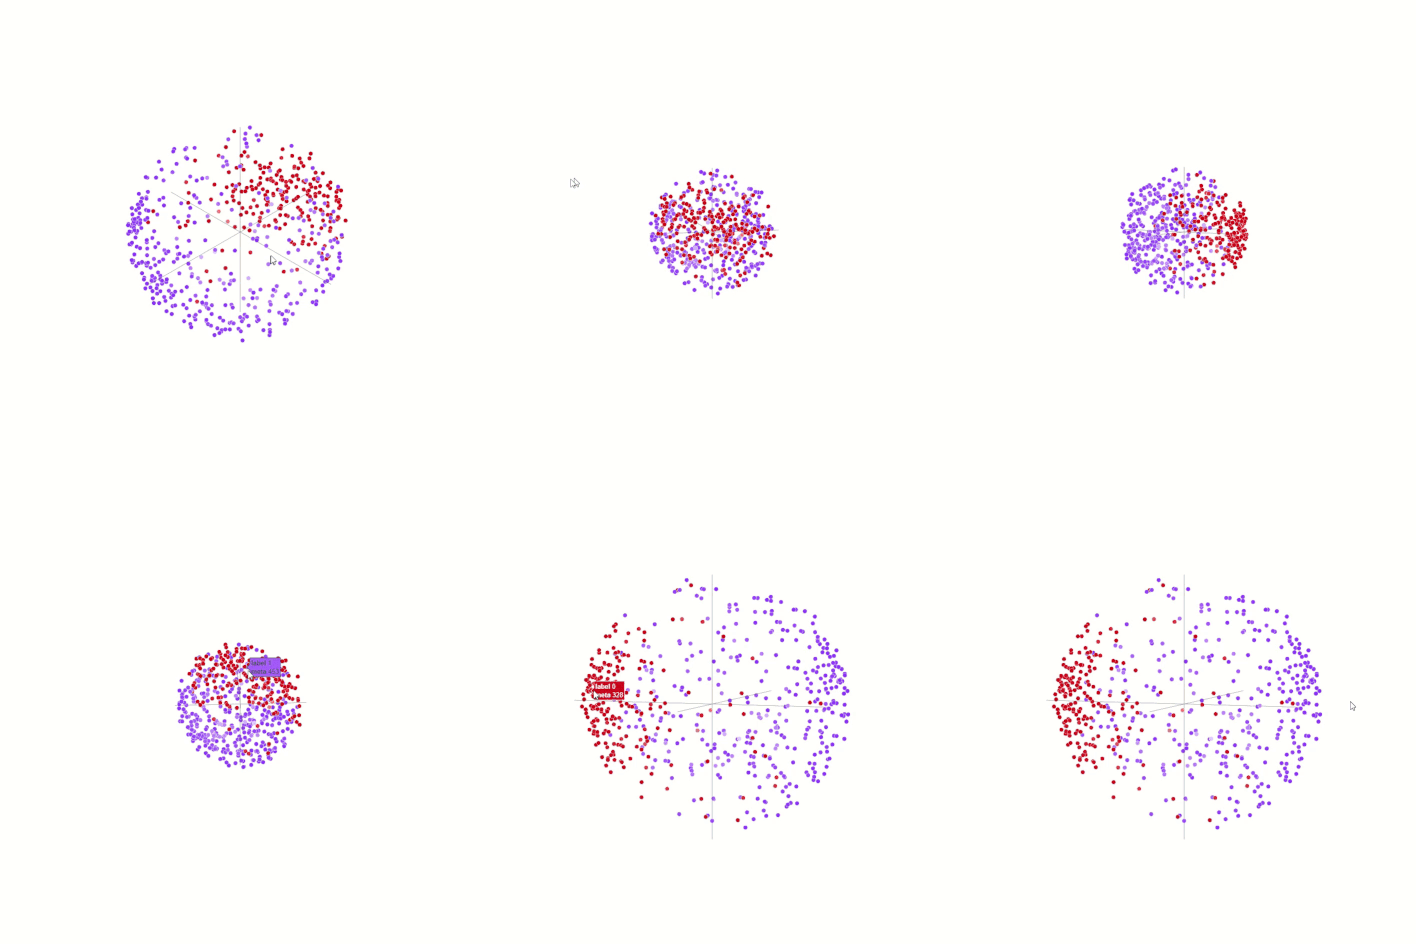
Cancer dataset
cancer = datasets.load_breast_cancer()

visualizer.project(
    data=cancer['data'],
    labels=cancer['target'])
Browser tab:
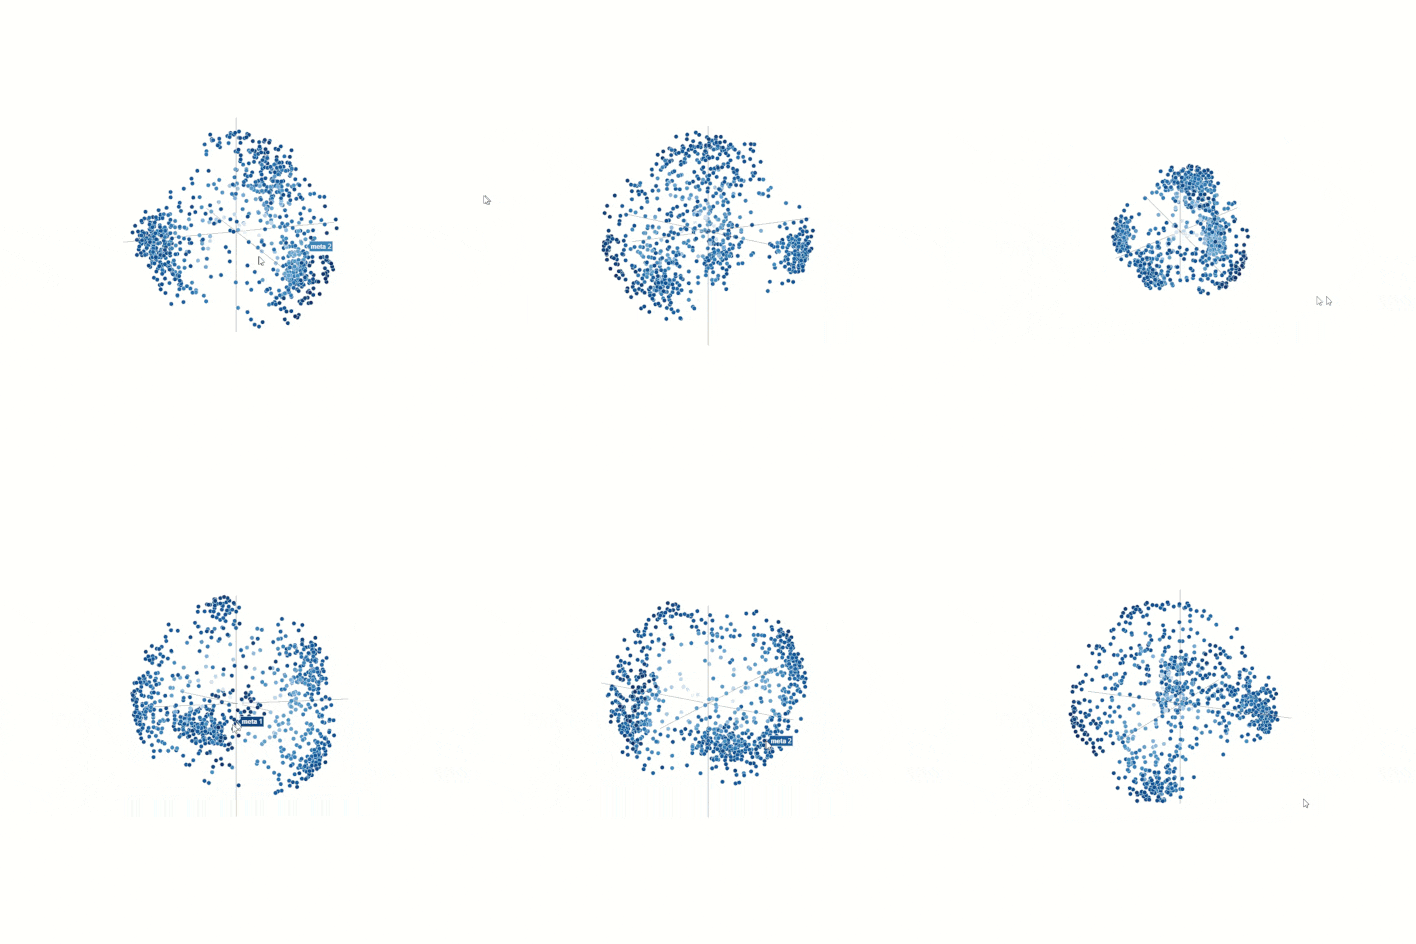
Digits dataset (no labels)
digits = datasets.load_digits(n_class=5)

visualizer.project(
    data=digits['data'],
    meta=digits['target'])
Browser tab:
Digits dataset (apply labels)
visualizer.project(
    data=digits['data'],
    labels=digits['target'])
Browser tab:
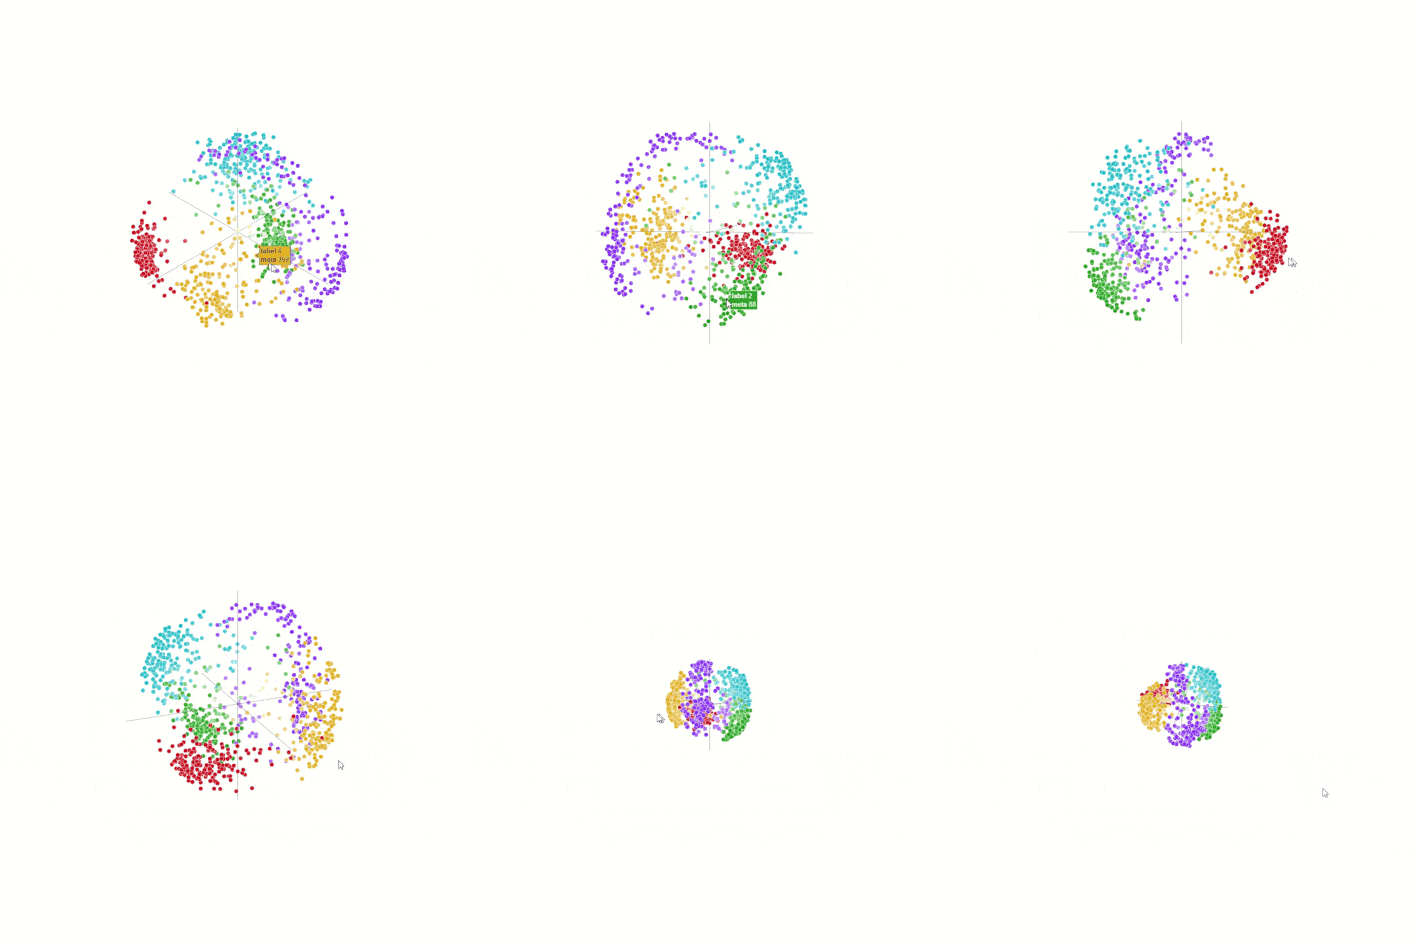
Housing dataset (labels from 'age')
housing = datasets.fetch_california_housing()

visualizer.project(
    data=housing['data'],
    labels=pd.qcut(housing['data'][:, 1], 5).astype(str))
Browser tab:
Change renderer
You can set renderer as visualizer = Projector(renderer='iframe') to save the plot locally as HTML.
Available renderers:
- 'jupyterlab'
- 'vscode'
- 'notebook'
- 'kaggle'
- 'colab' and others
1 maintainer

Metadata
1 maintainer
Release files for prosphera 1.0.5
For a detailed explanation of source distributions (sdists) and built distributions (wheels), please see the package formats documentation.
Source distribution (sdist)
| File | Size | Uploaded | |
|---|---|---|---|
| prosphera-1.0.5.tar.gz | 42.7 kB | Details |
Built distribution (wheel)
| File | Interpreter | ABI | Platform | Reset |
|---|---|---|---|---|
| prosphera-1.0.5-py3-none-any.whl | Python 3 | none | any | Details |
Total release size: 72.2 kB
Release files / prosphera-1.0.5.tar.gz
| Download URL | prosphera-1.0.5.tar.gz |
|---|---|
| Size | 42.7 kB |
| Tags | Source |
|
SHA-256 checksum How to use checksums |
51056c19f2bf883bf6047b397ee9afe63160282d4441793524e5e25ff7b15e85
|
|
BLAKE2b-256 checksum How to use checksums |
b7648ff737af81a3cb041f3b03c4f7e54a59cde6888fd970d4fc1a511546ce8d
|
| Upload date | |
|
Uploaded using Trusted Publishing? What is trusted publishing? |
No |
| Uploaded via |
twine/4.0.2 CPython/3.11.6
|
Release files / prosphera-1.0.5-py3-none-any.whl
| Download URL | prosphera-1.0.5-py3-none-any.whl |
|---|---|
| Size | 29.5 kB |
| Tags | Python 3 |
|
SHA-256 checksum How to use checksums |
6841eb349e6eeab0e31f95d28a1881f1d6f279c49be14fc5d89e60f78ff15f3d
|
|
BLAKE2b-256 checksum How to use checksums |
2d1b21679b62158cee8203bb26dc740bd24b02afd218fa1023832f6434e33d5f
|
| Upload date | |
|
Uploaded using Trusted Publishing? What is trusted publishing? |
No |
| Uploaded via |
twine/4.0.2 CPython/3.11.6
|














