
Interactive terminal UI for exploring PyTorch CUDA memory snapshots

Project description
PyTorch Memory Profiler CLI
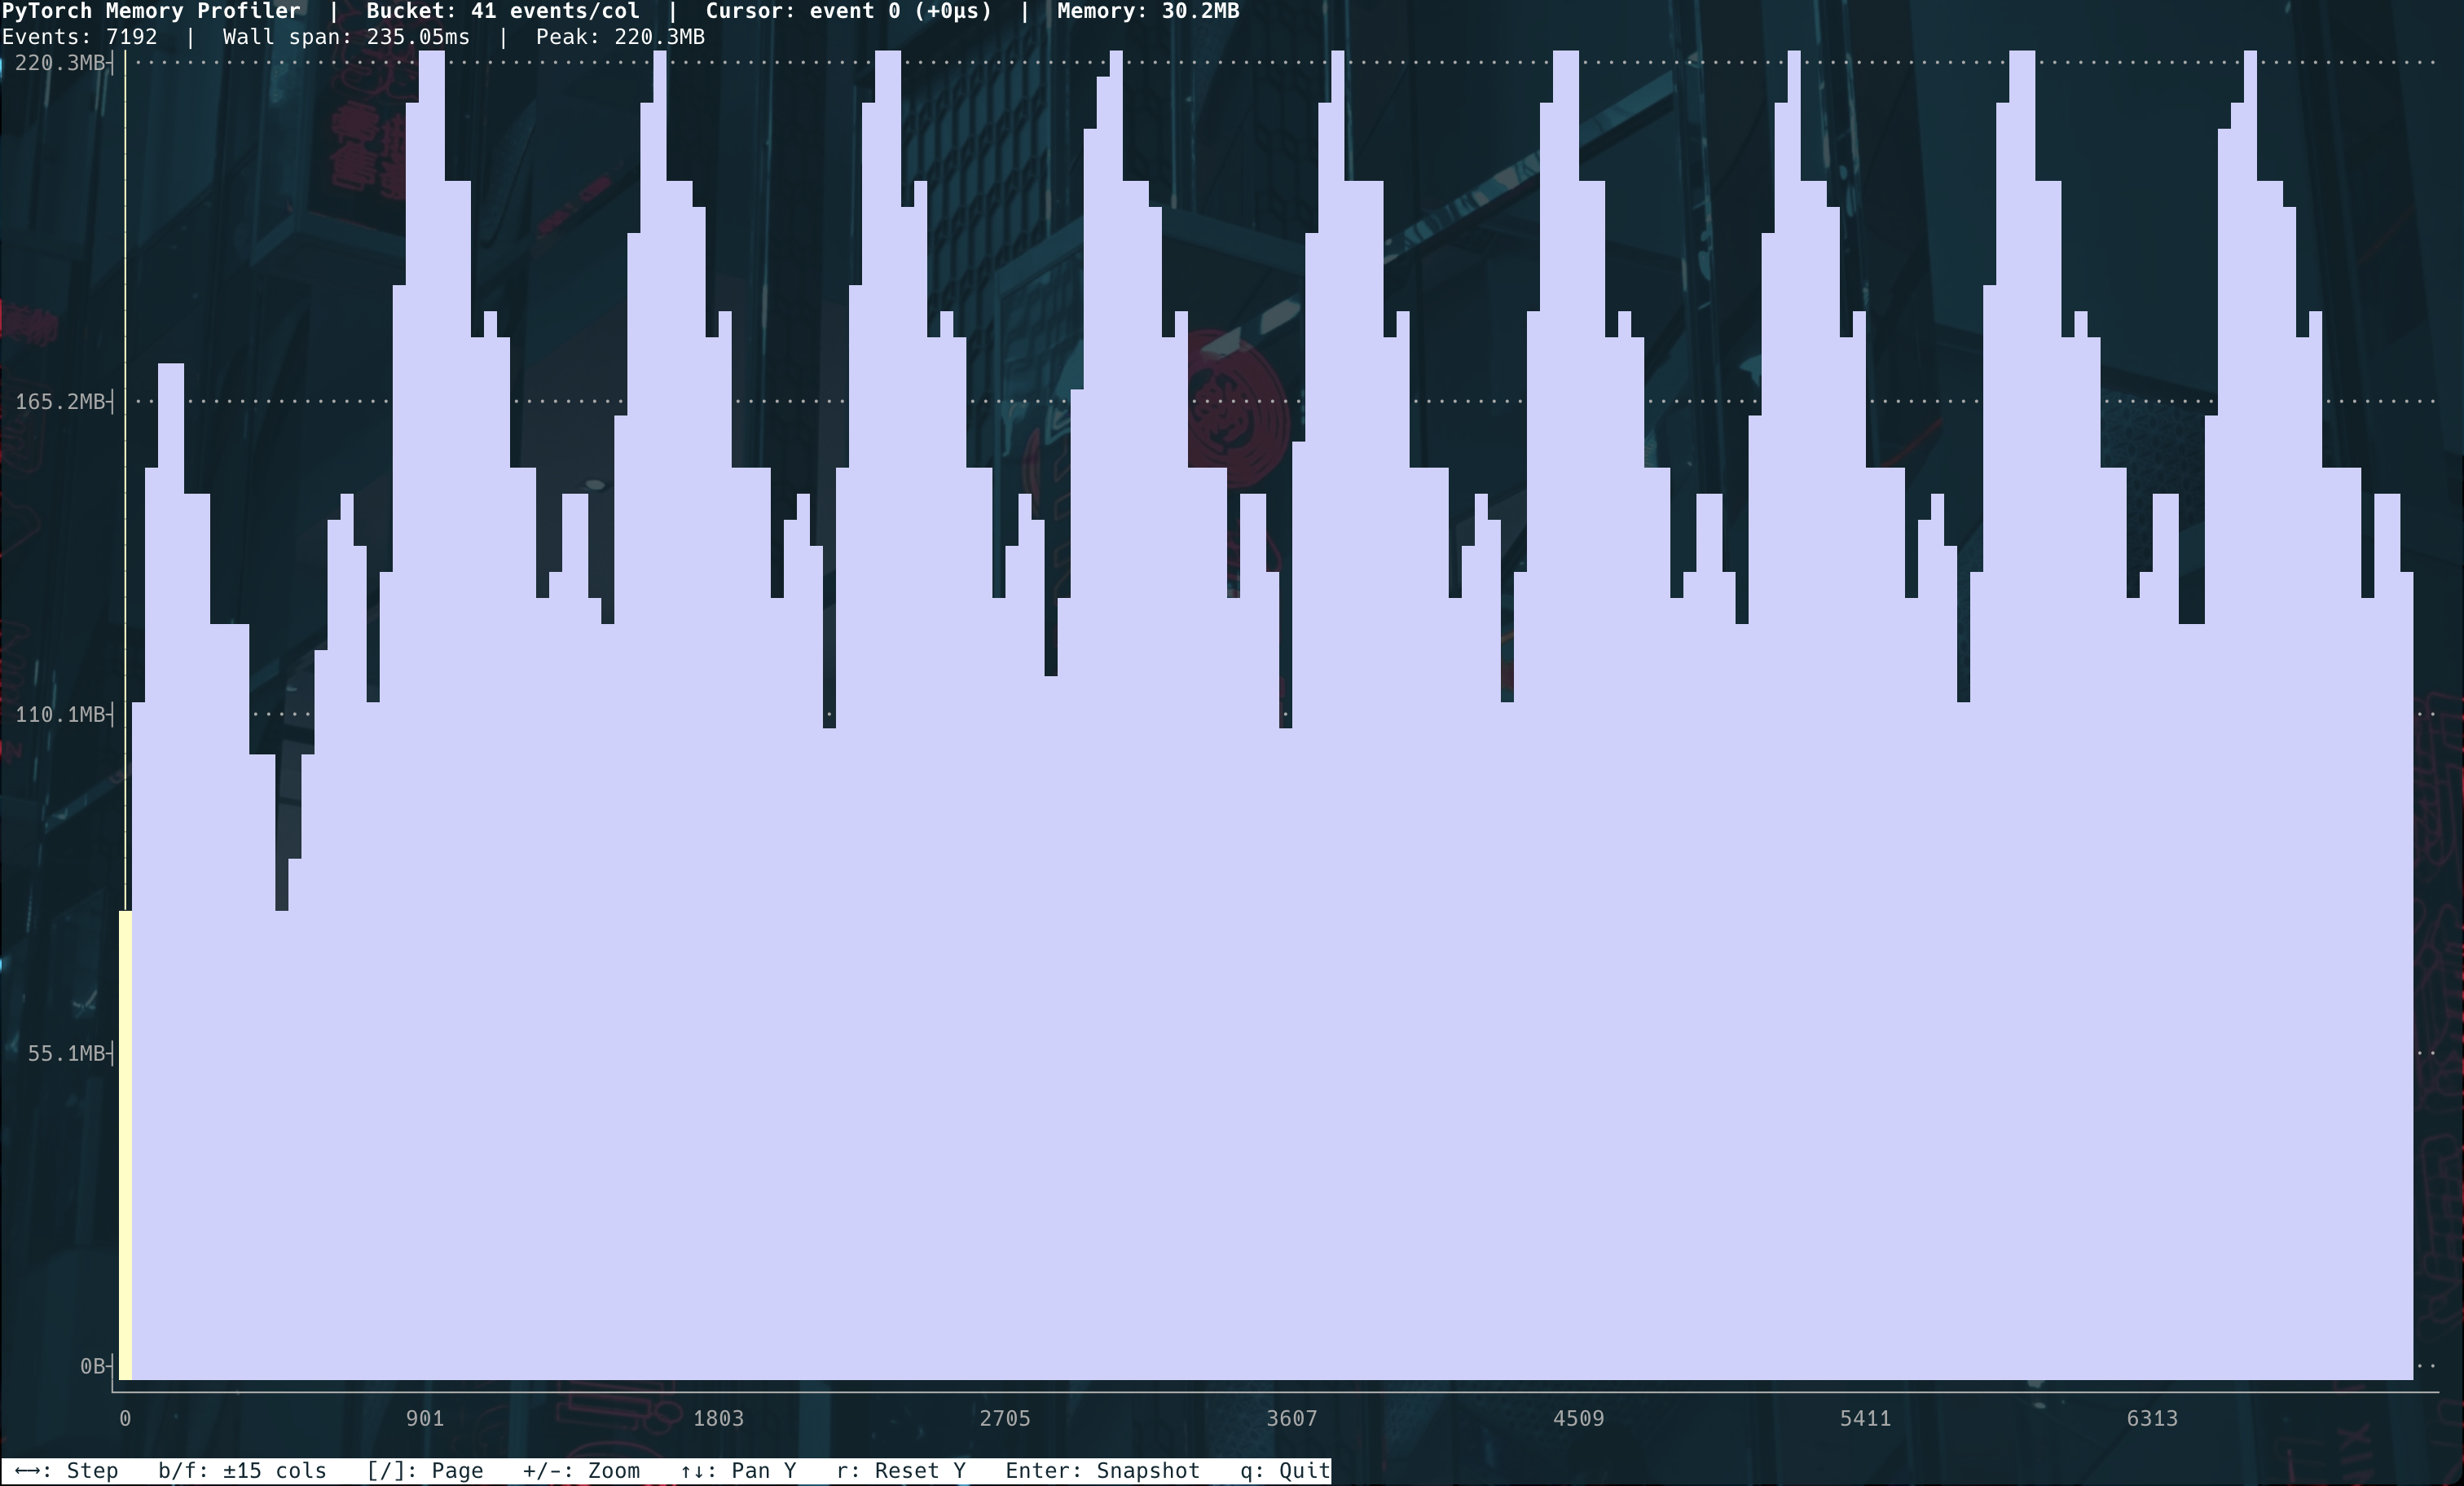
An interactive terminal UI for exploring PyTorch CUDA memory snapshots. Navigate memory usage over time, drill into allocation call stacks, and pinpoint exactly what is consuming your GPU memory at any moment.
Features
- Timeline view — zoomable bar chart of memory usage across all recorded allocation events
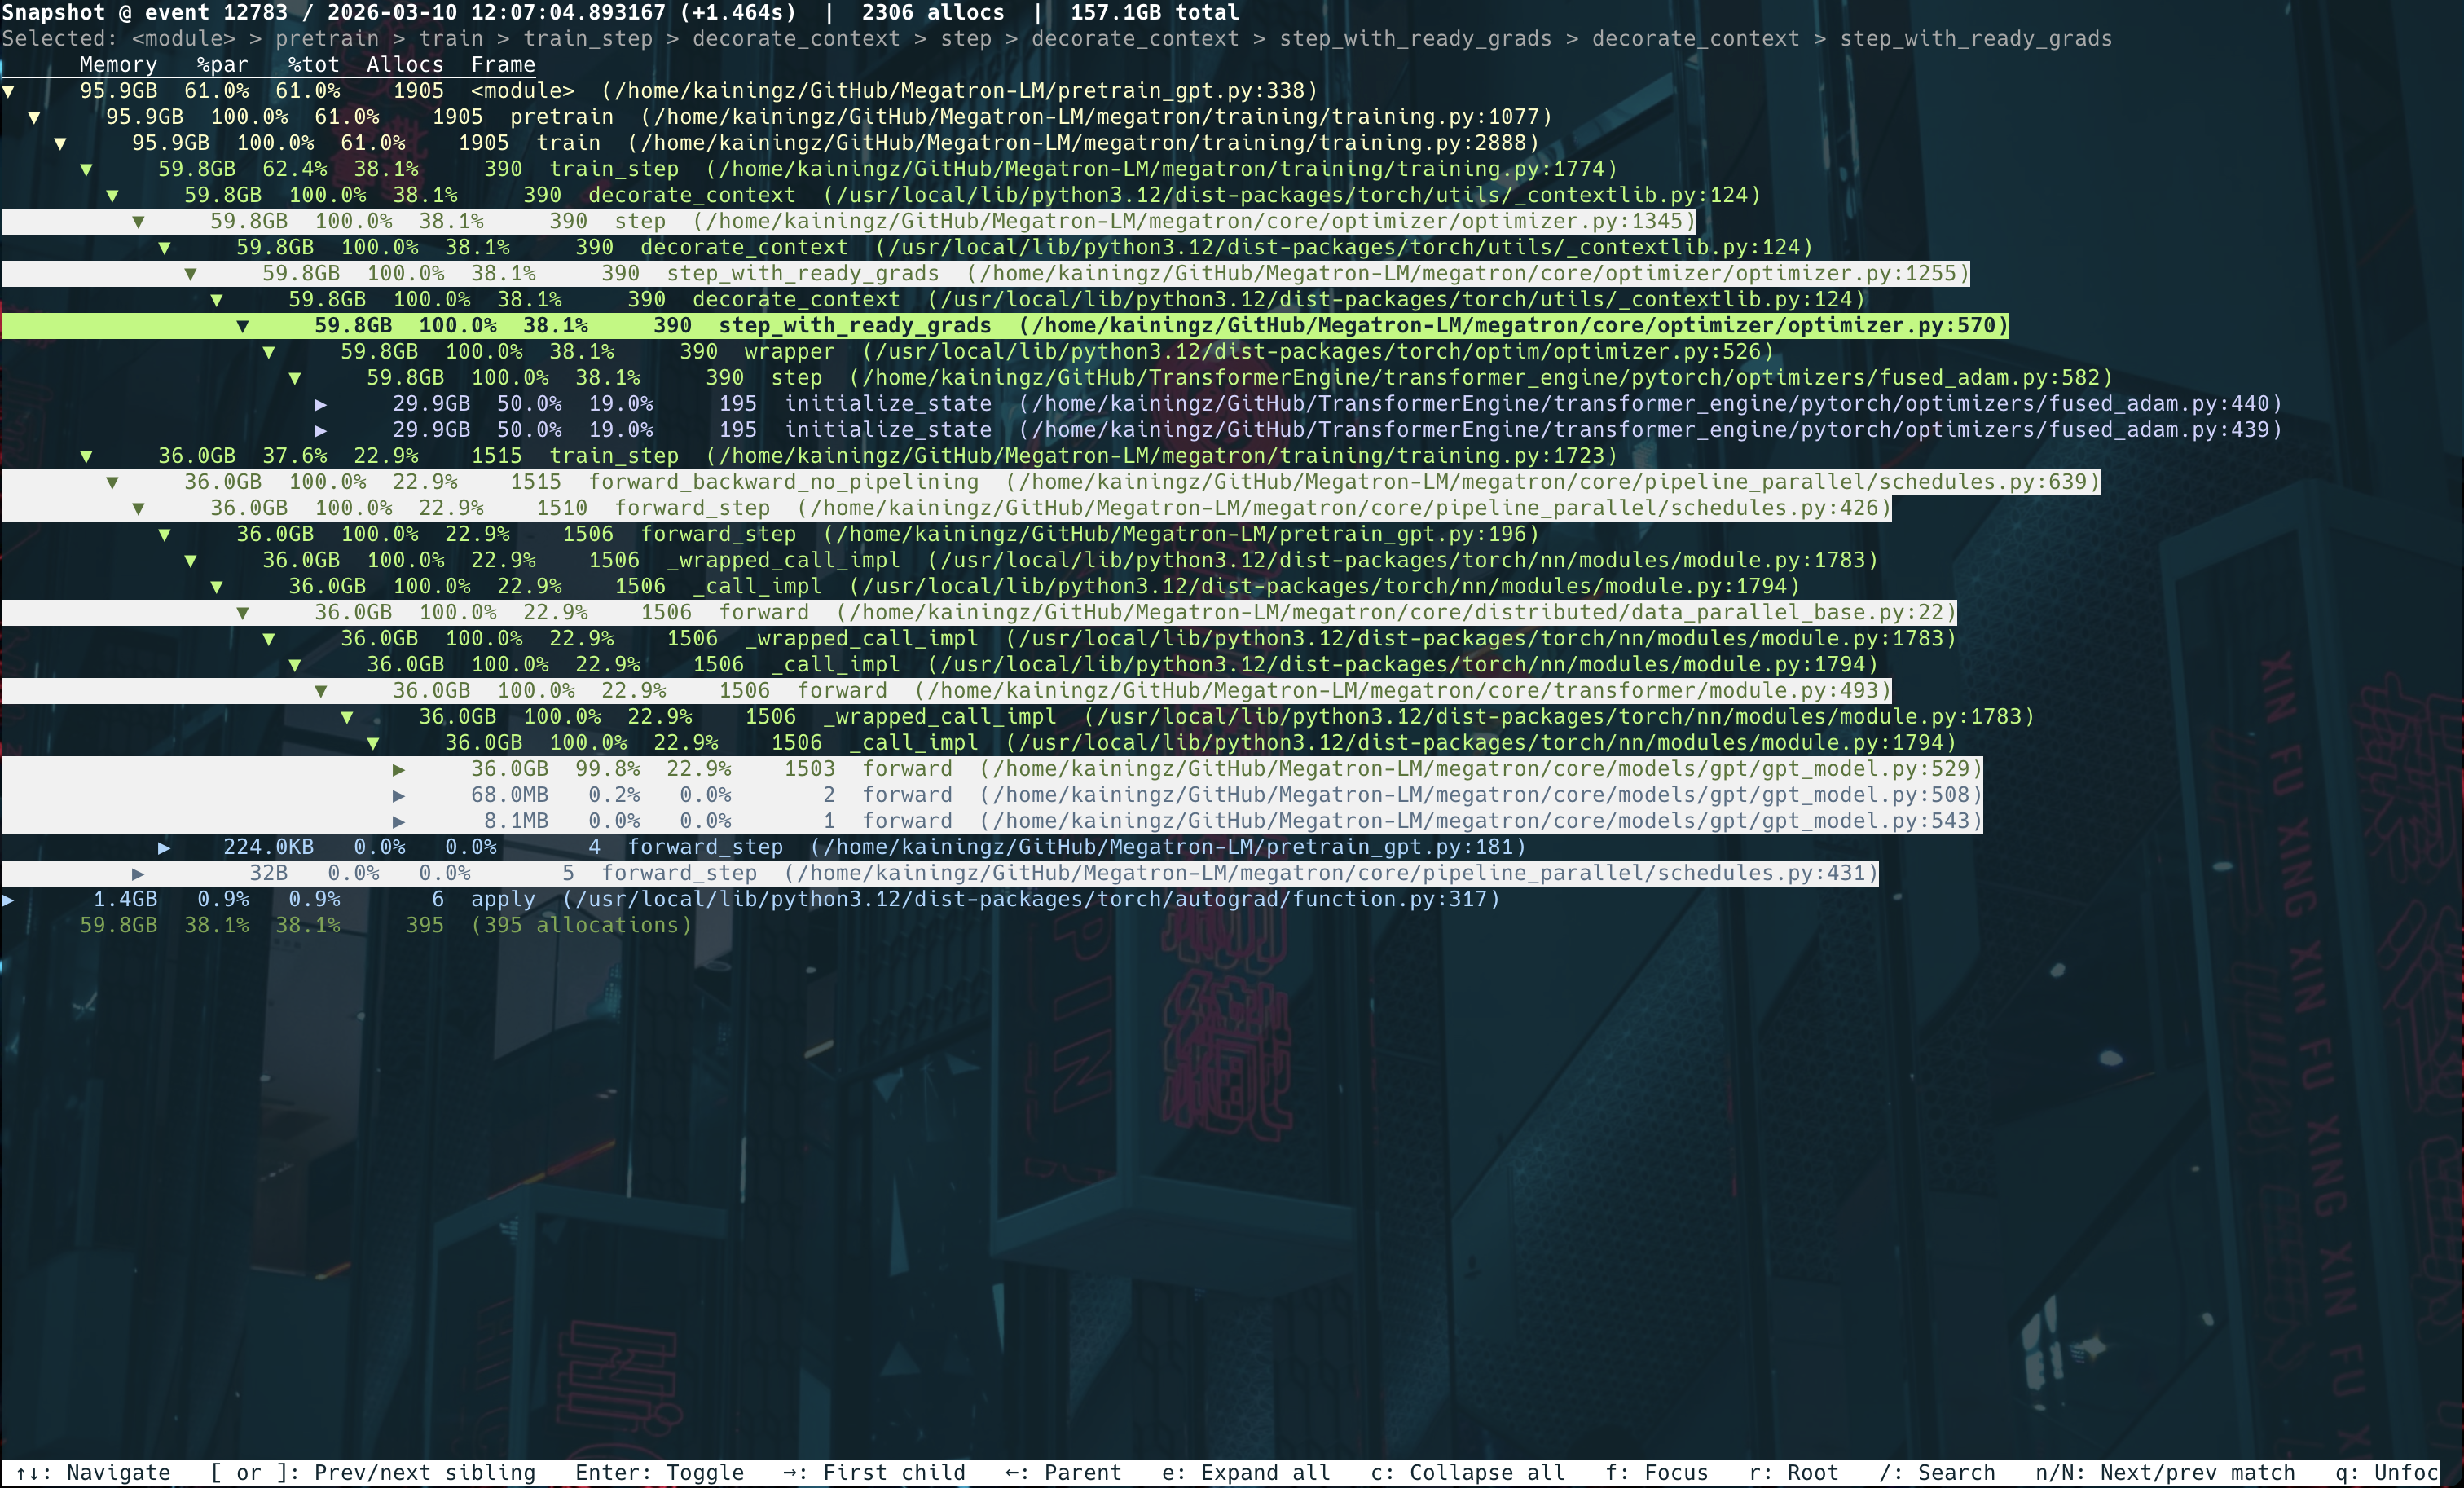
- Detail view — expandable call-stack tree with per-frame byte totals; navigate with arrow keys, expand/collapse, focus a subtree, or collapse everything at once
- Incremental search — press
/to filter frames by name; jump between matches withn/N - Heat-map coloring — frames colored blue → red by share of total memory so the biggest consumers stand out immediately
- Accurate baseline — memory allocated before recording started is reconstructed from the final
segmentsstate, so the timeline never falsely starts at zero - Fast cache — parsed data is cached on first load; subsequent opens are instant
https://github.com/user-attachments/assets/c59e30f0-e235-4245-becc-ce5eb2bf2e54
Why use this over PyTorch's memory profiler visualizer?
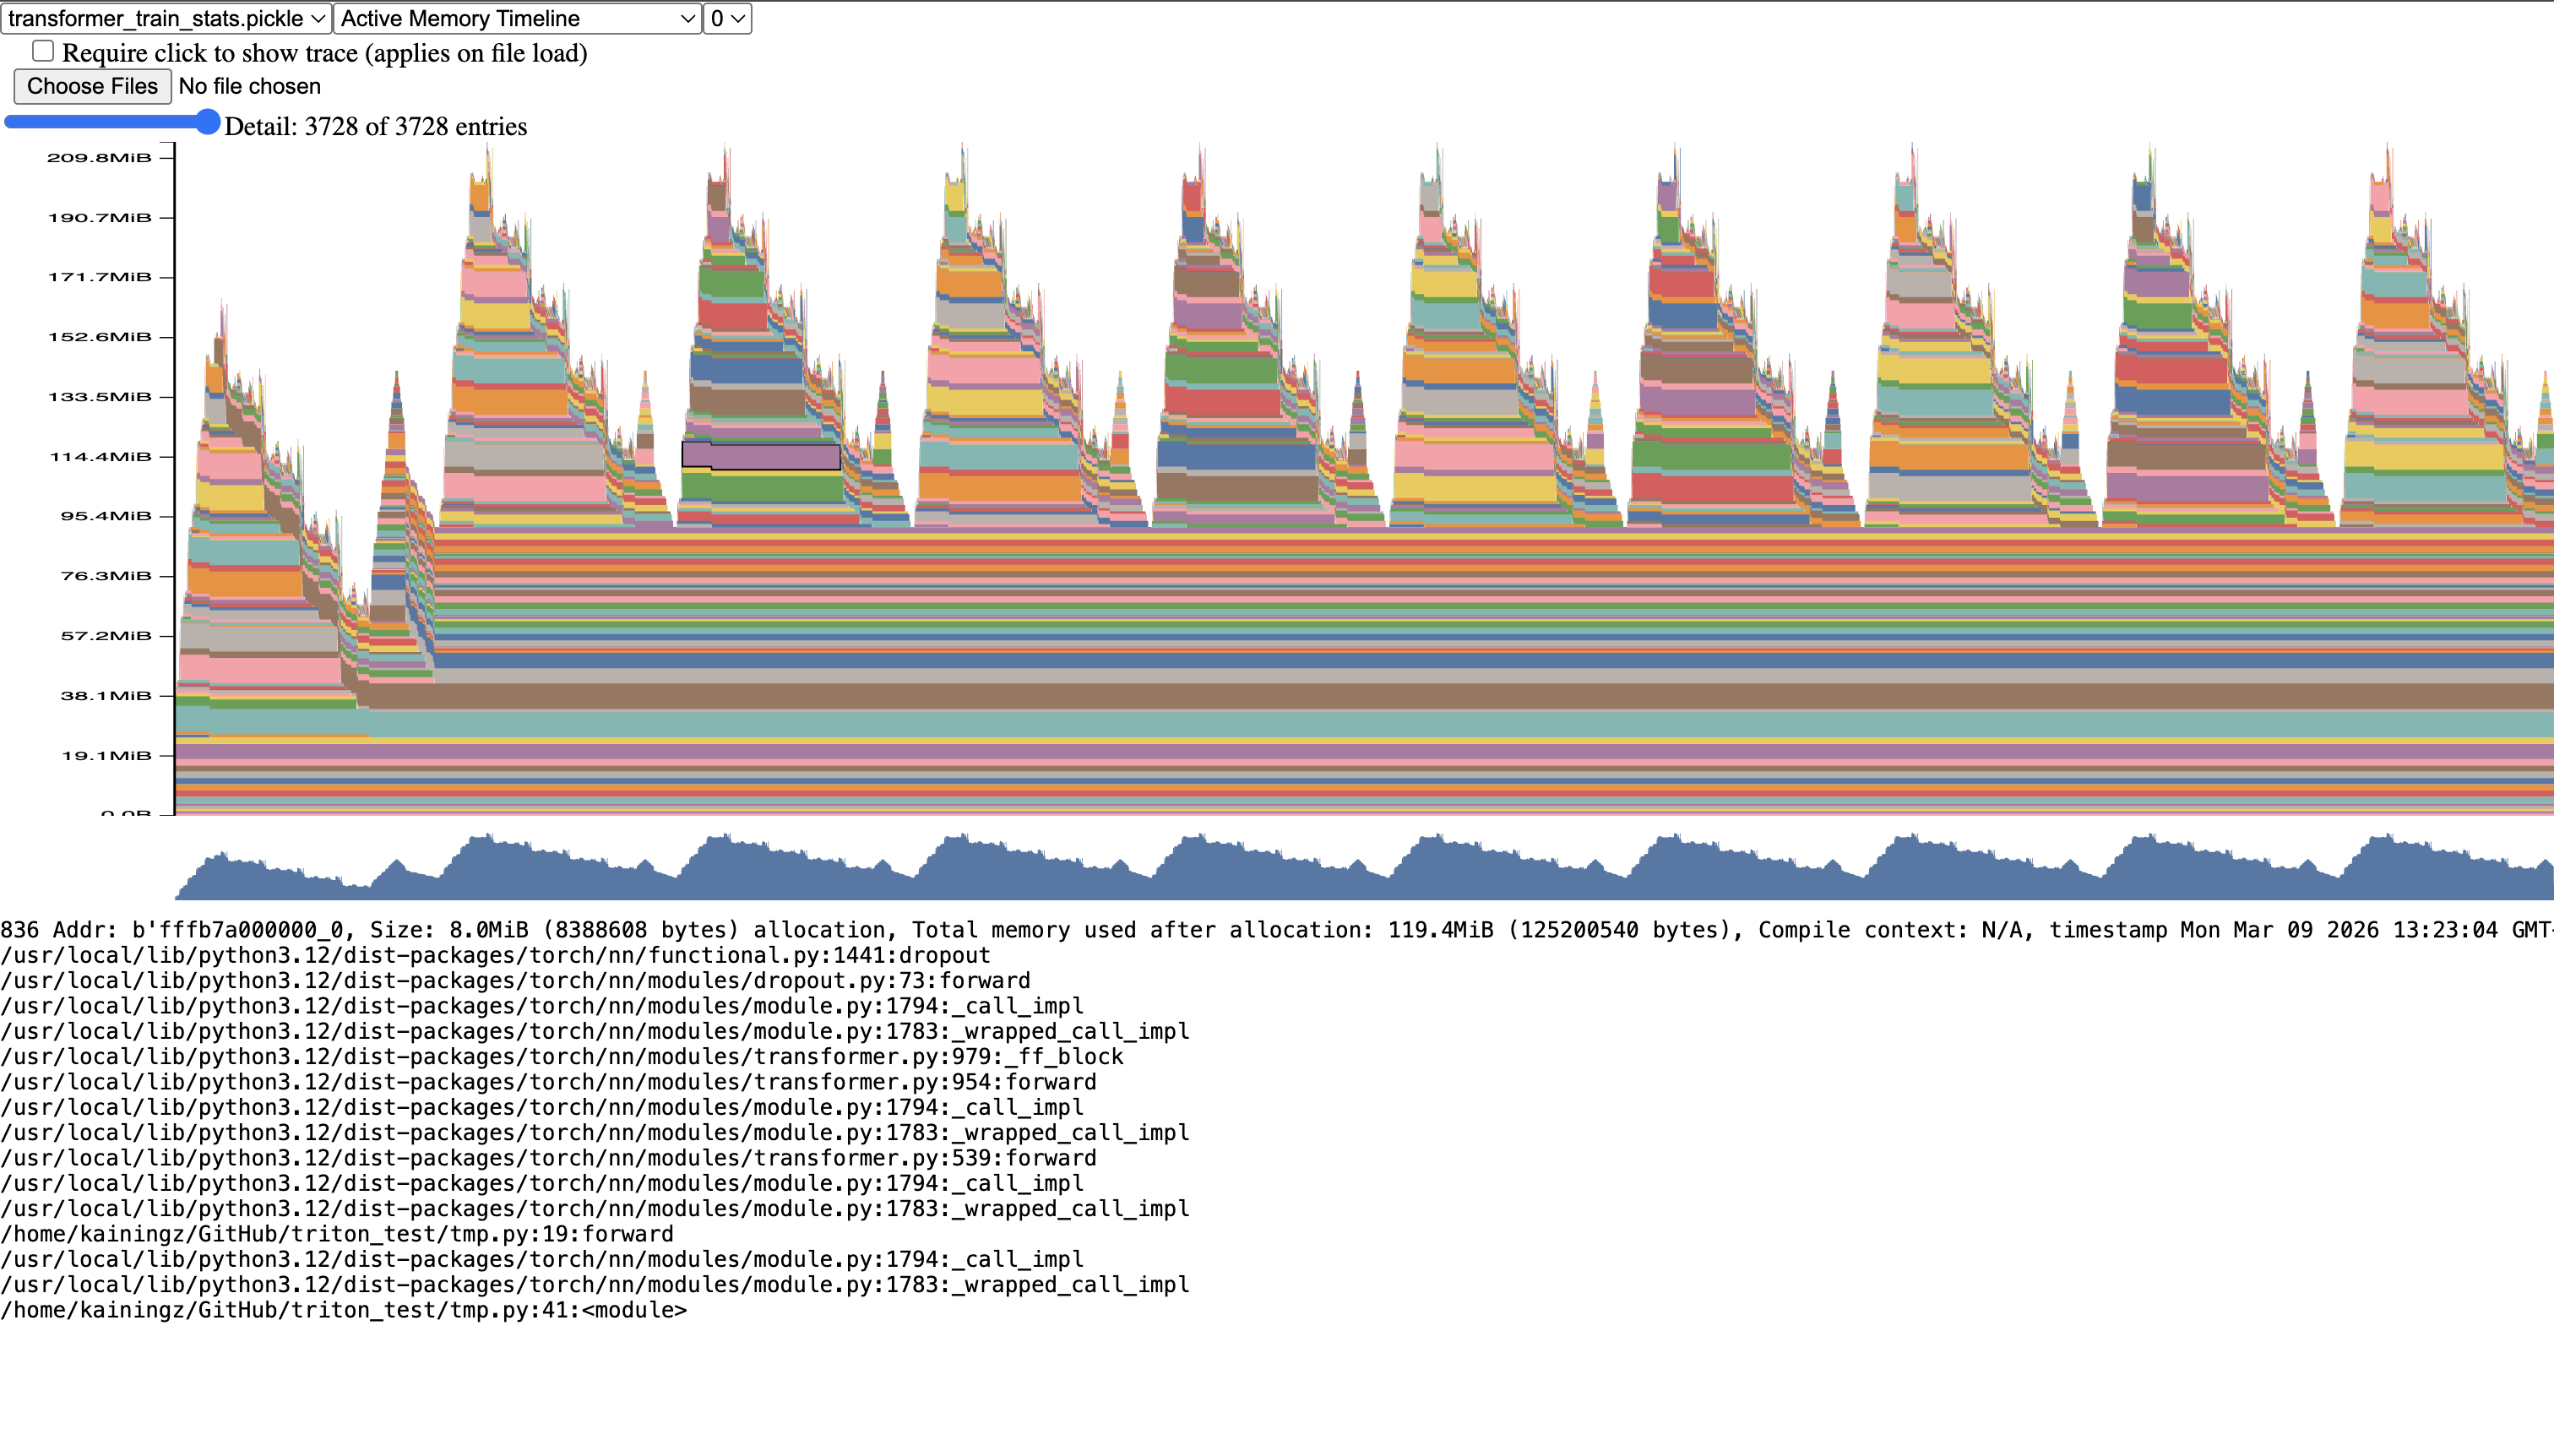
PyTorch ships with an official memory visualizer (torch.cuda._memory_viz) that renders an interactive HTML page. That tool is excellent for a broad overview, but it has real limitations when you are actively debugging a memory problem. This CLI tool is designed to close those gaps.
| ptmem | PyTorch Viz |
|---|---|
 |
 |
Use it on a remote training node over SSH
Most real training runs happen on remote GPU nodes — a cloud VM, a university cluster, or a company compute node. PyTorch's HTML visualizer requires downloading the snapshot file to your local machine and opening it in a browser, which is inconvenient when the file is several hundred megabytes and your connection is slow. This tool runs entirely inside the terminal. You can SSH into the node, point it at the snapshot file in place, and start exploring immediately — no file transfer, no browser, no port-forwarding needed.
Examine memory at any specific moment
The HTML visualizer shows you a continuous memory curve, but clicking a point in it does not tell you what is allocated there — only how much total memory is in use. This tool takes a different approach: the timeline and detail views are directly linked. You navigate the timeline with arrow keys, and at any point you can press Enter to open the detail view for that exact allocation state. The detail view shows every live tensor at that moment, grouped by the call stack that created it, with byte counts at every level of the tree. This makes it straightforward to answer questions like "right after the forward pass completes, what is still holding memory and why?" rather than having to guess from aggregate numbers.
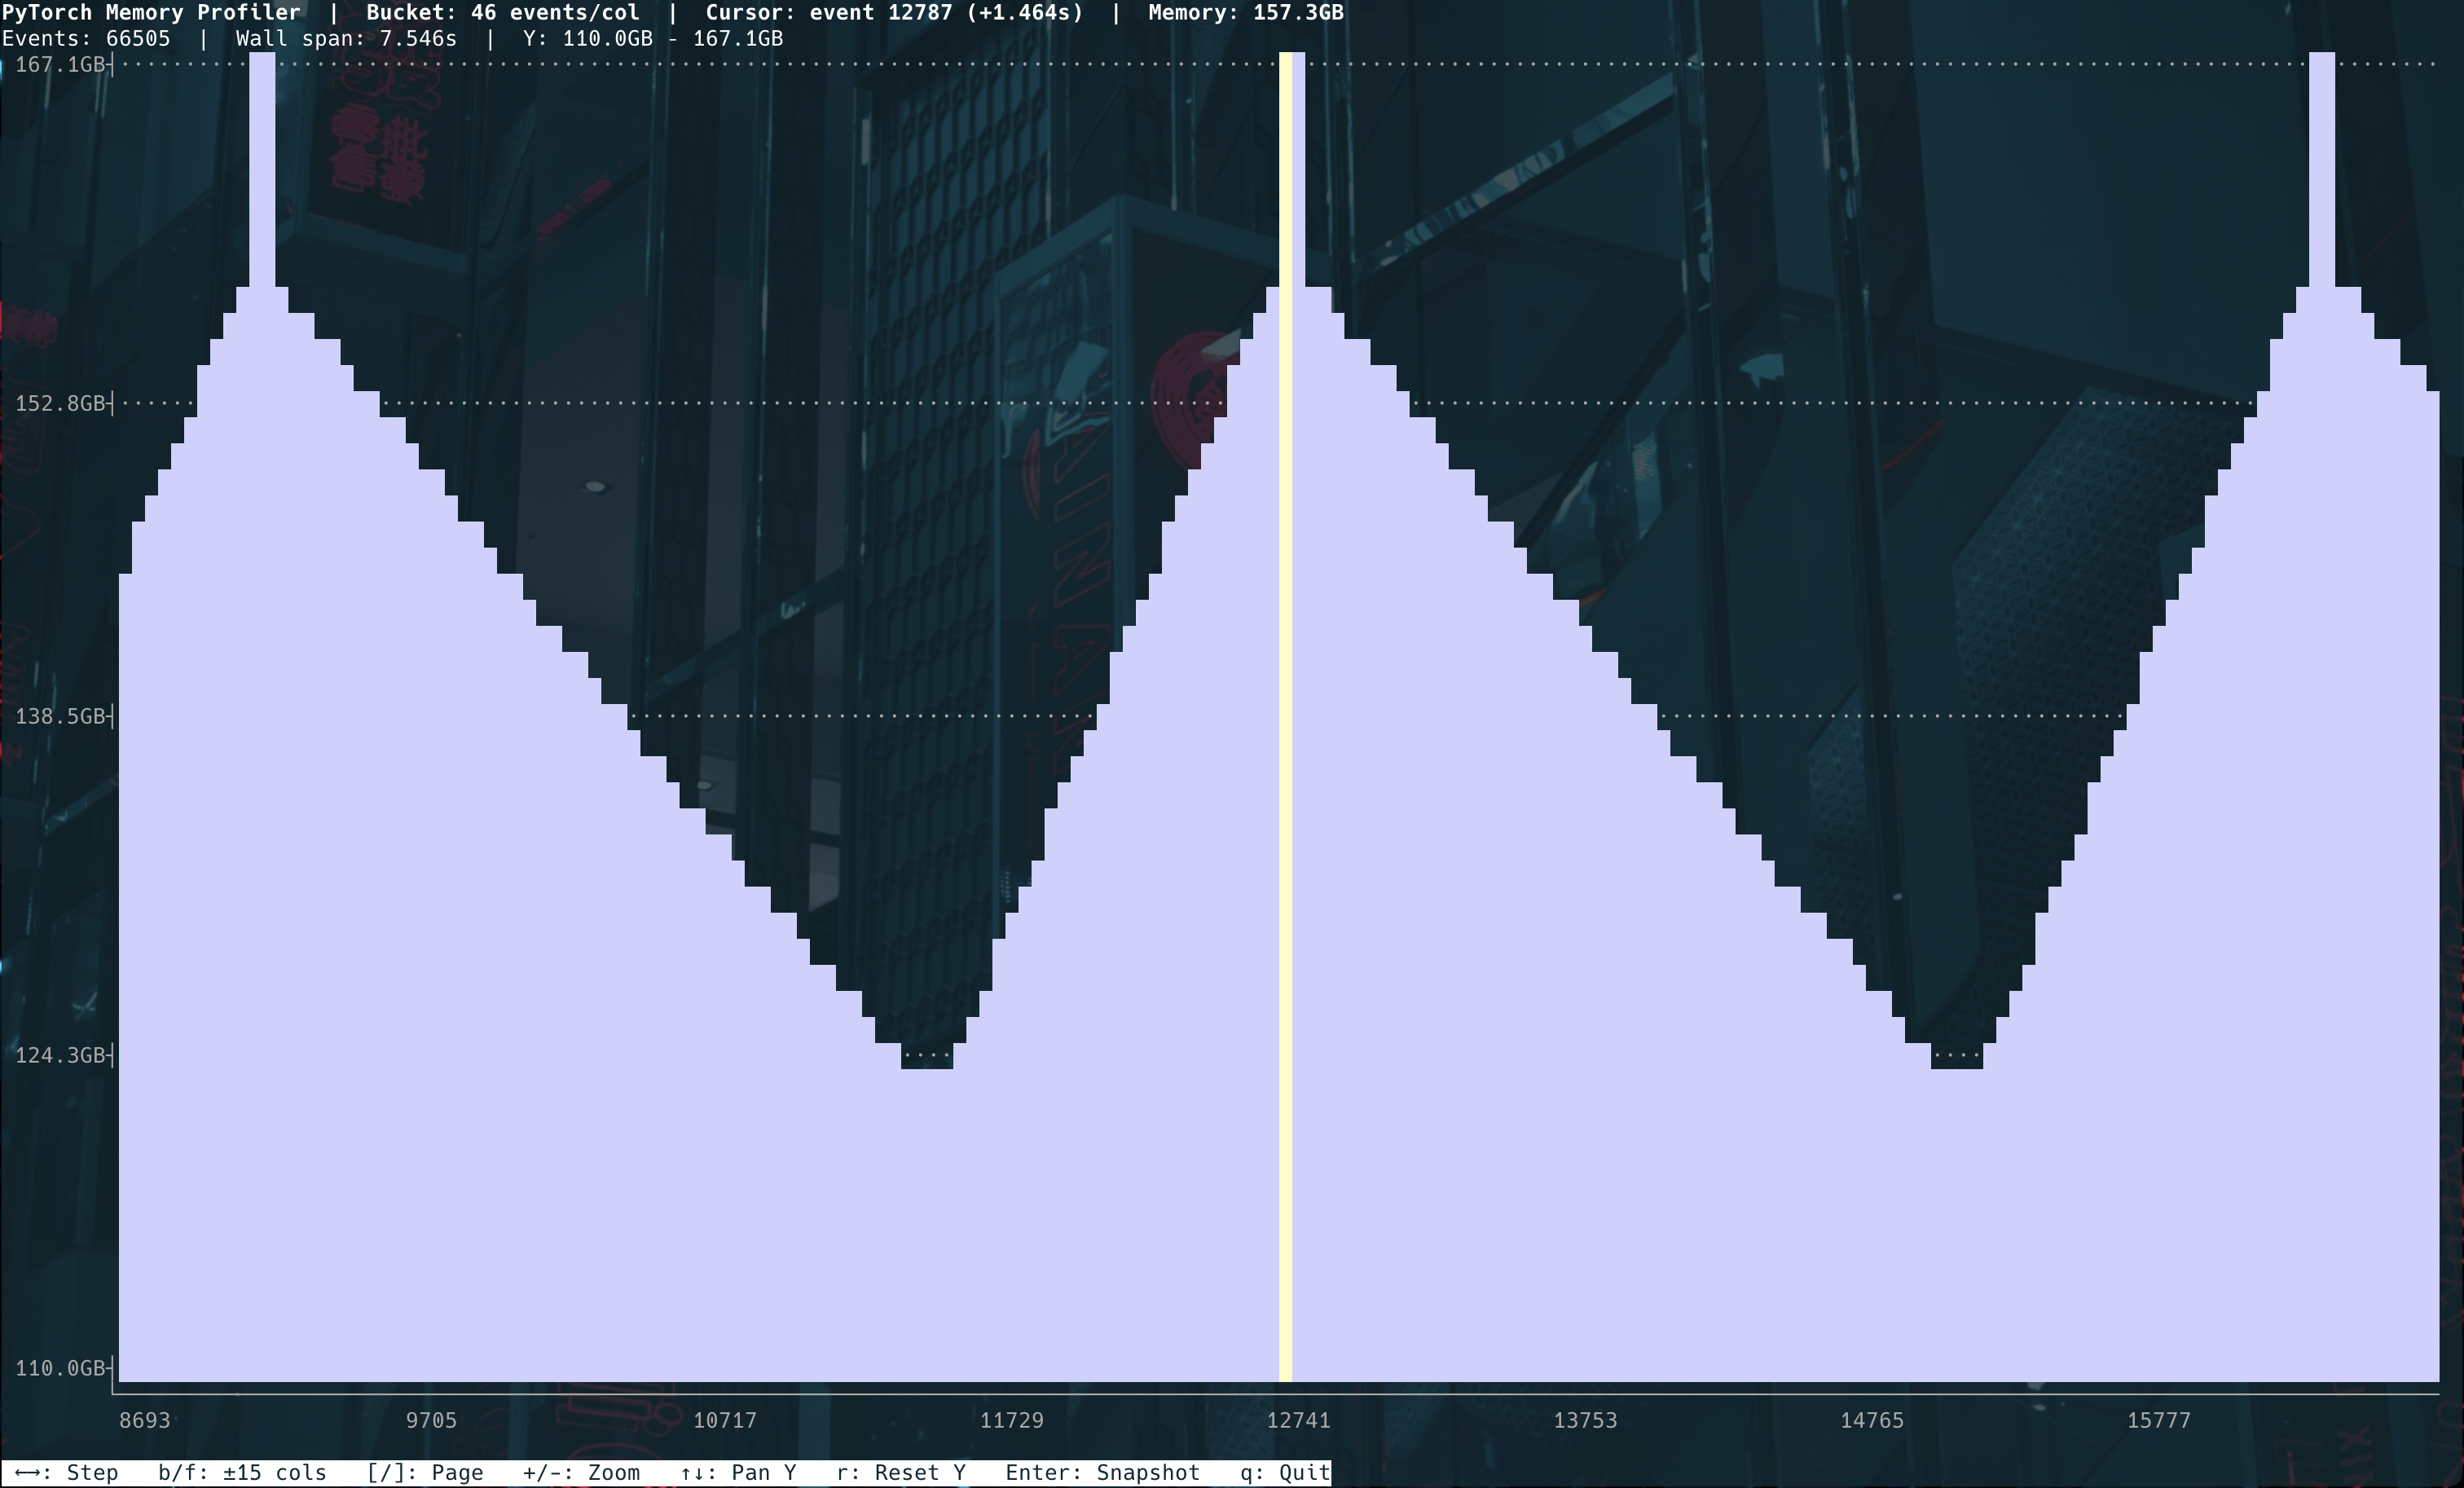
Attribute memory to specific functions
A common frustration with memory profiling is knowing that 18 GB is in use, but not knowing which part of your code is responsible. The detail view solves this by grouping all live allocations by their call stack and rolling the totals up the tree. At a glance you can see, for example, that the optimizer accounts for 6 GB, the activation cache accounts for 8 GB, and the model parameters account for the remaining 4 GB. Expanding any node drills deeper into the call stack, letting you trace a large allocation all the way back to the exact line of code that created it. Each frame is color-coded by its share of total memory — blue for small contributors, through cyan, green, and yellow, up to red for the biggest — so the expensive parts stand out before you even start reading.
Search by function or module name
Real models have deep call stacks. A single forward pass through a large transformer might involve dozens of nested function calls before reaching the actual tensor operation. Manually expanding the tree to find a specific layer or function can take a long time. Pressing / opens an incremental search bar: type any substring of a function name or filename and every matching frame is highlighted in the tree immediately. Press n / N to jump between matches. This lets you jump directly to, say, attention or cross_entropy or a specific file in your codebase without touching anything else.
Compare two snapshots side by side
Fixing a memory regression often means comparing a before and after: "did this optimization actually reduce peak memory?" With a browser-based tool you have to switch tabs and try to mentally align two separate charts. With a terminal tool you can open two snapshots in two terminal panes or tabs and scroll both to the same event index simultaneously, making differences immediately visible. Because the interface is purely text, it also works well inside a terminal multiplexer like tmux or screen, where you can arrange panes however you like.
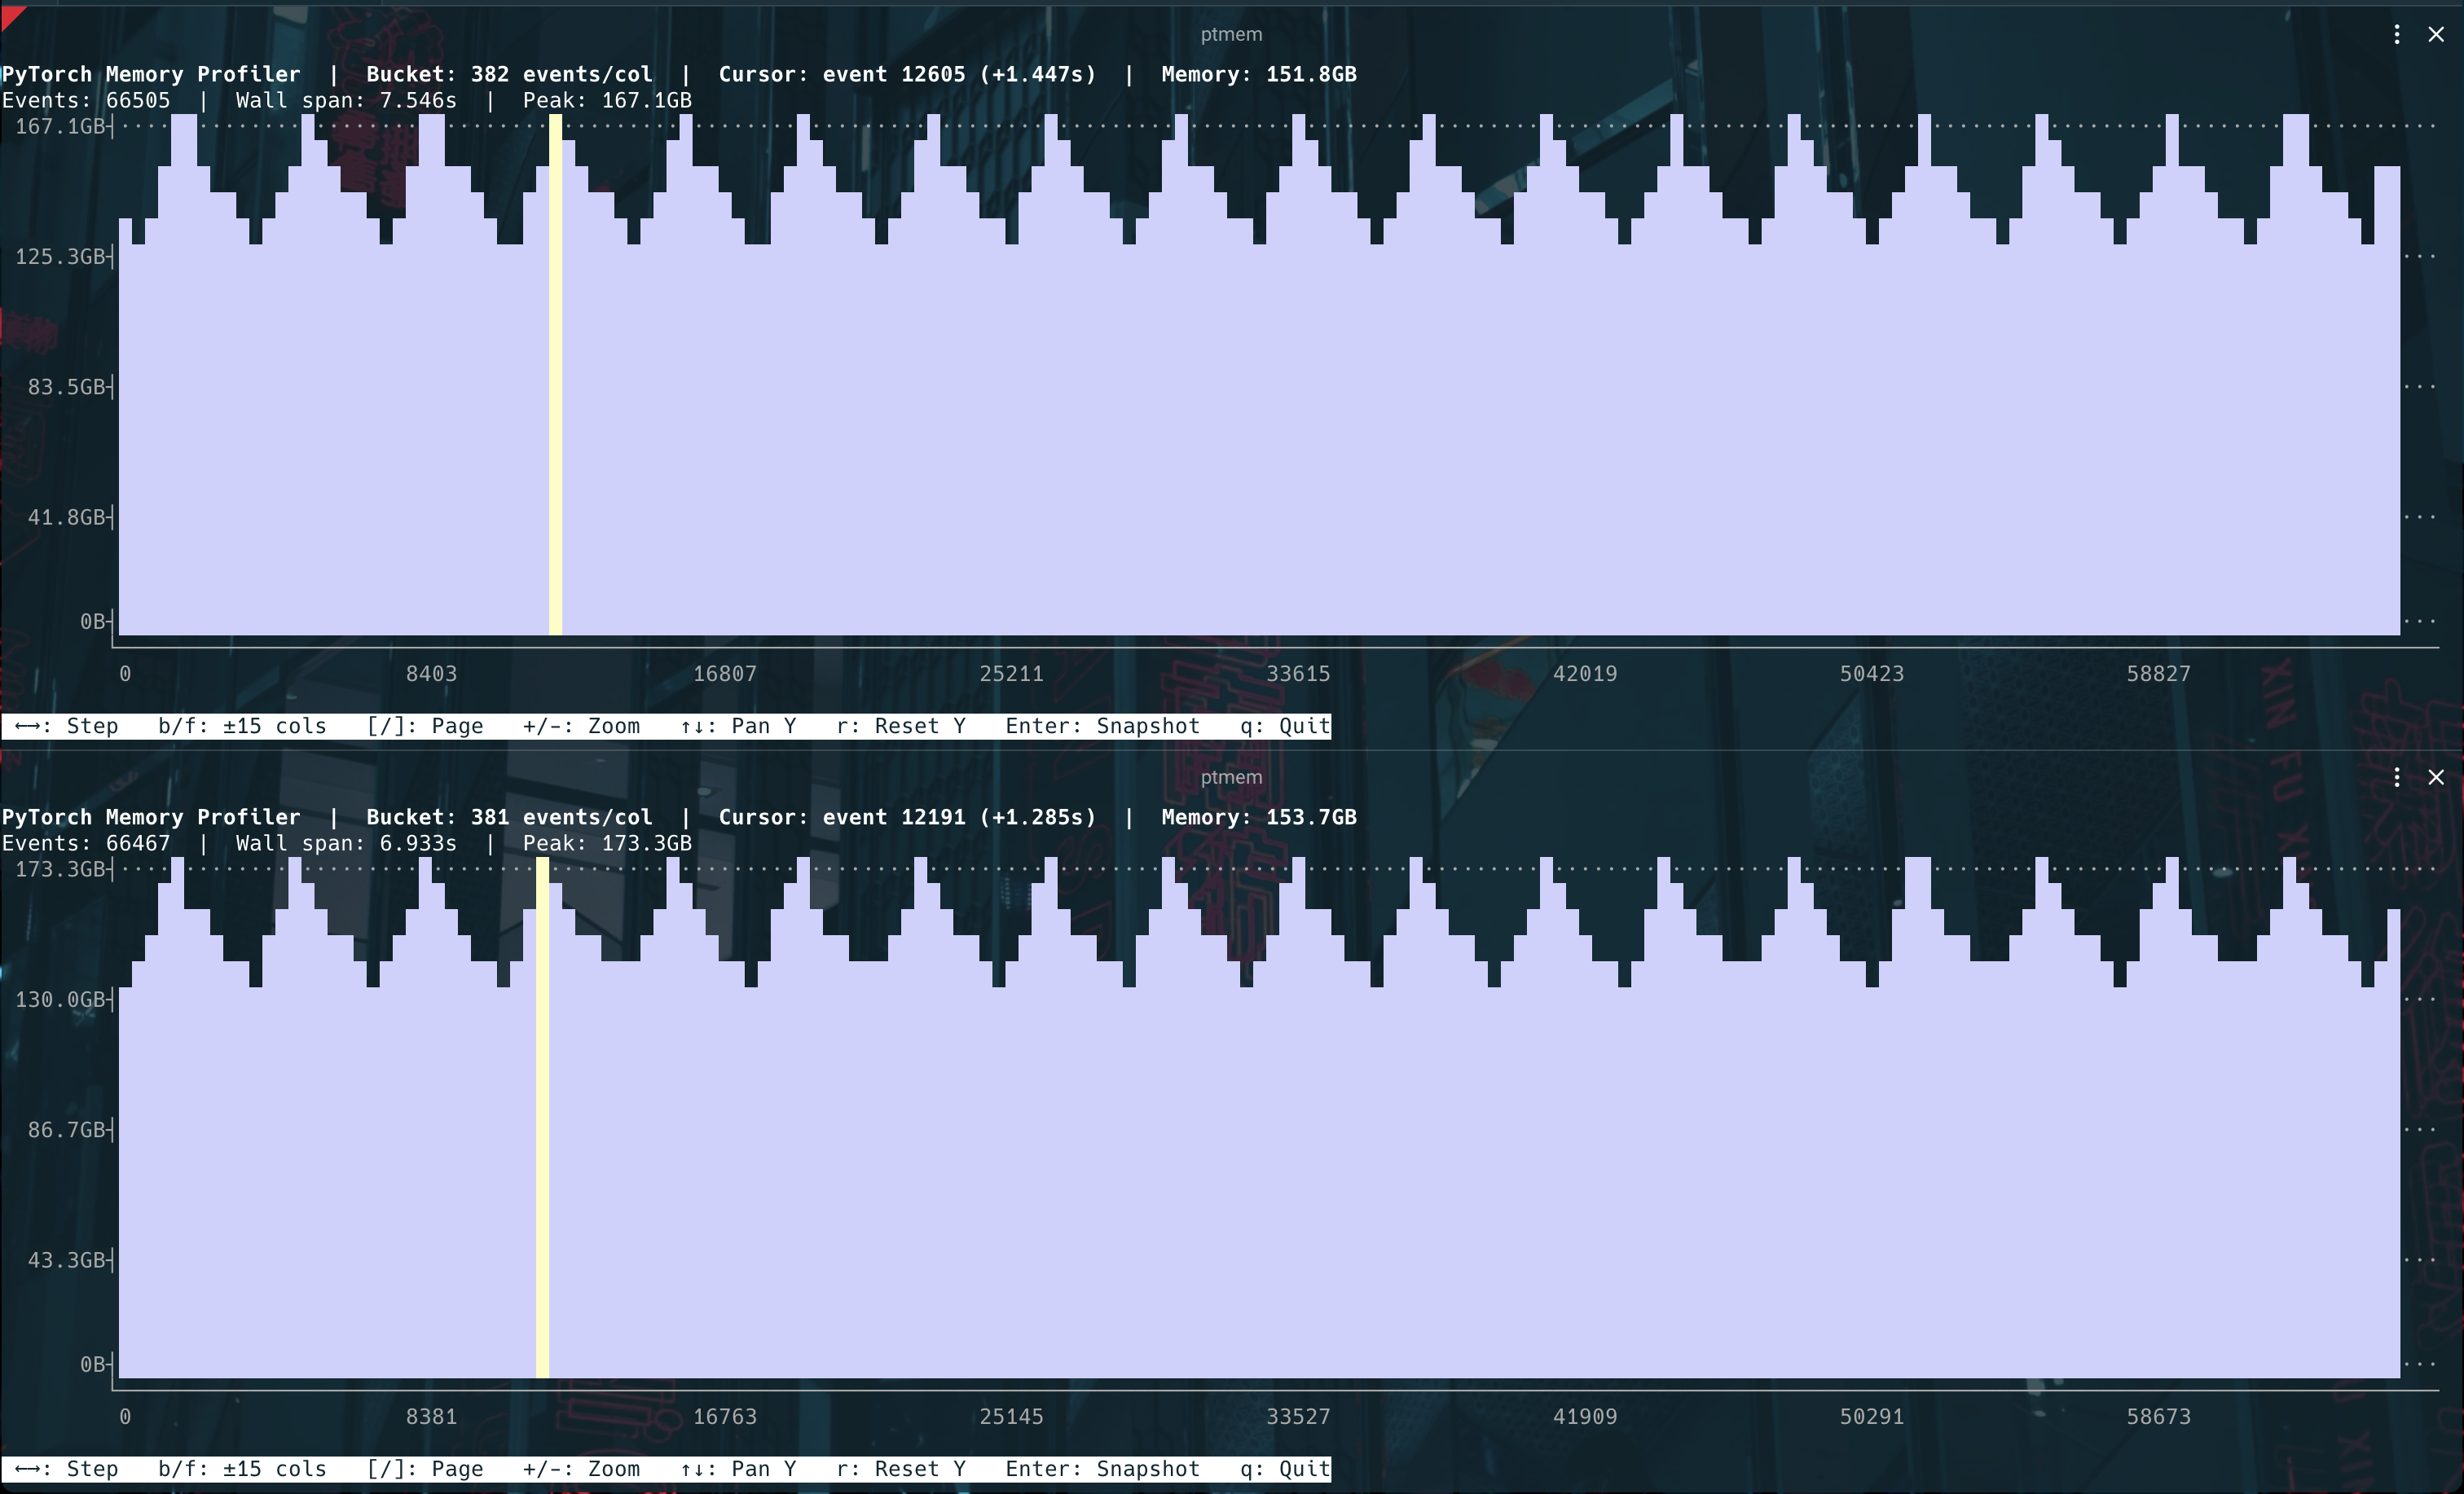
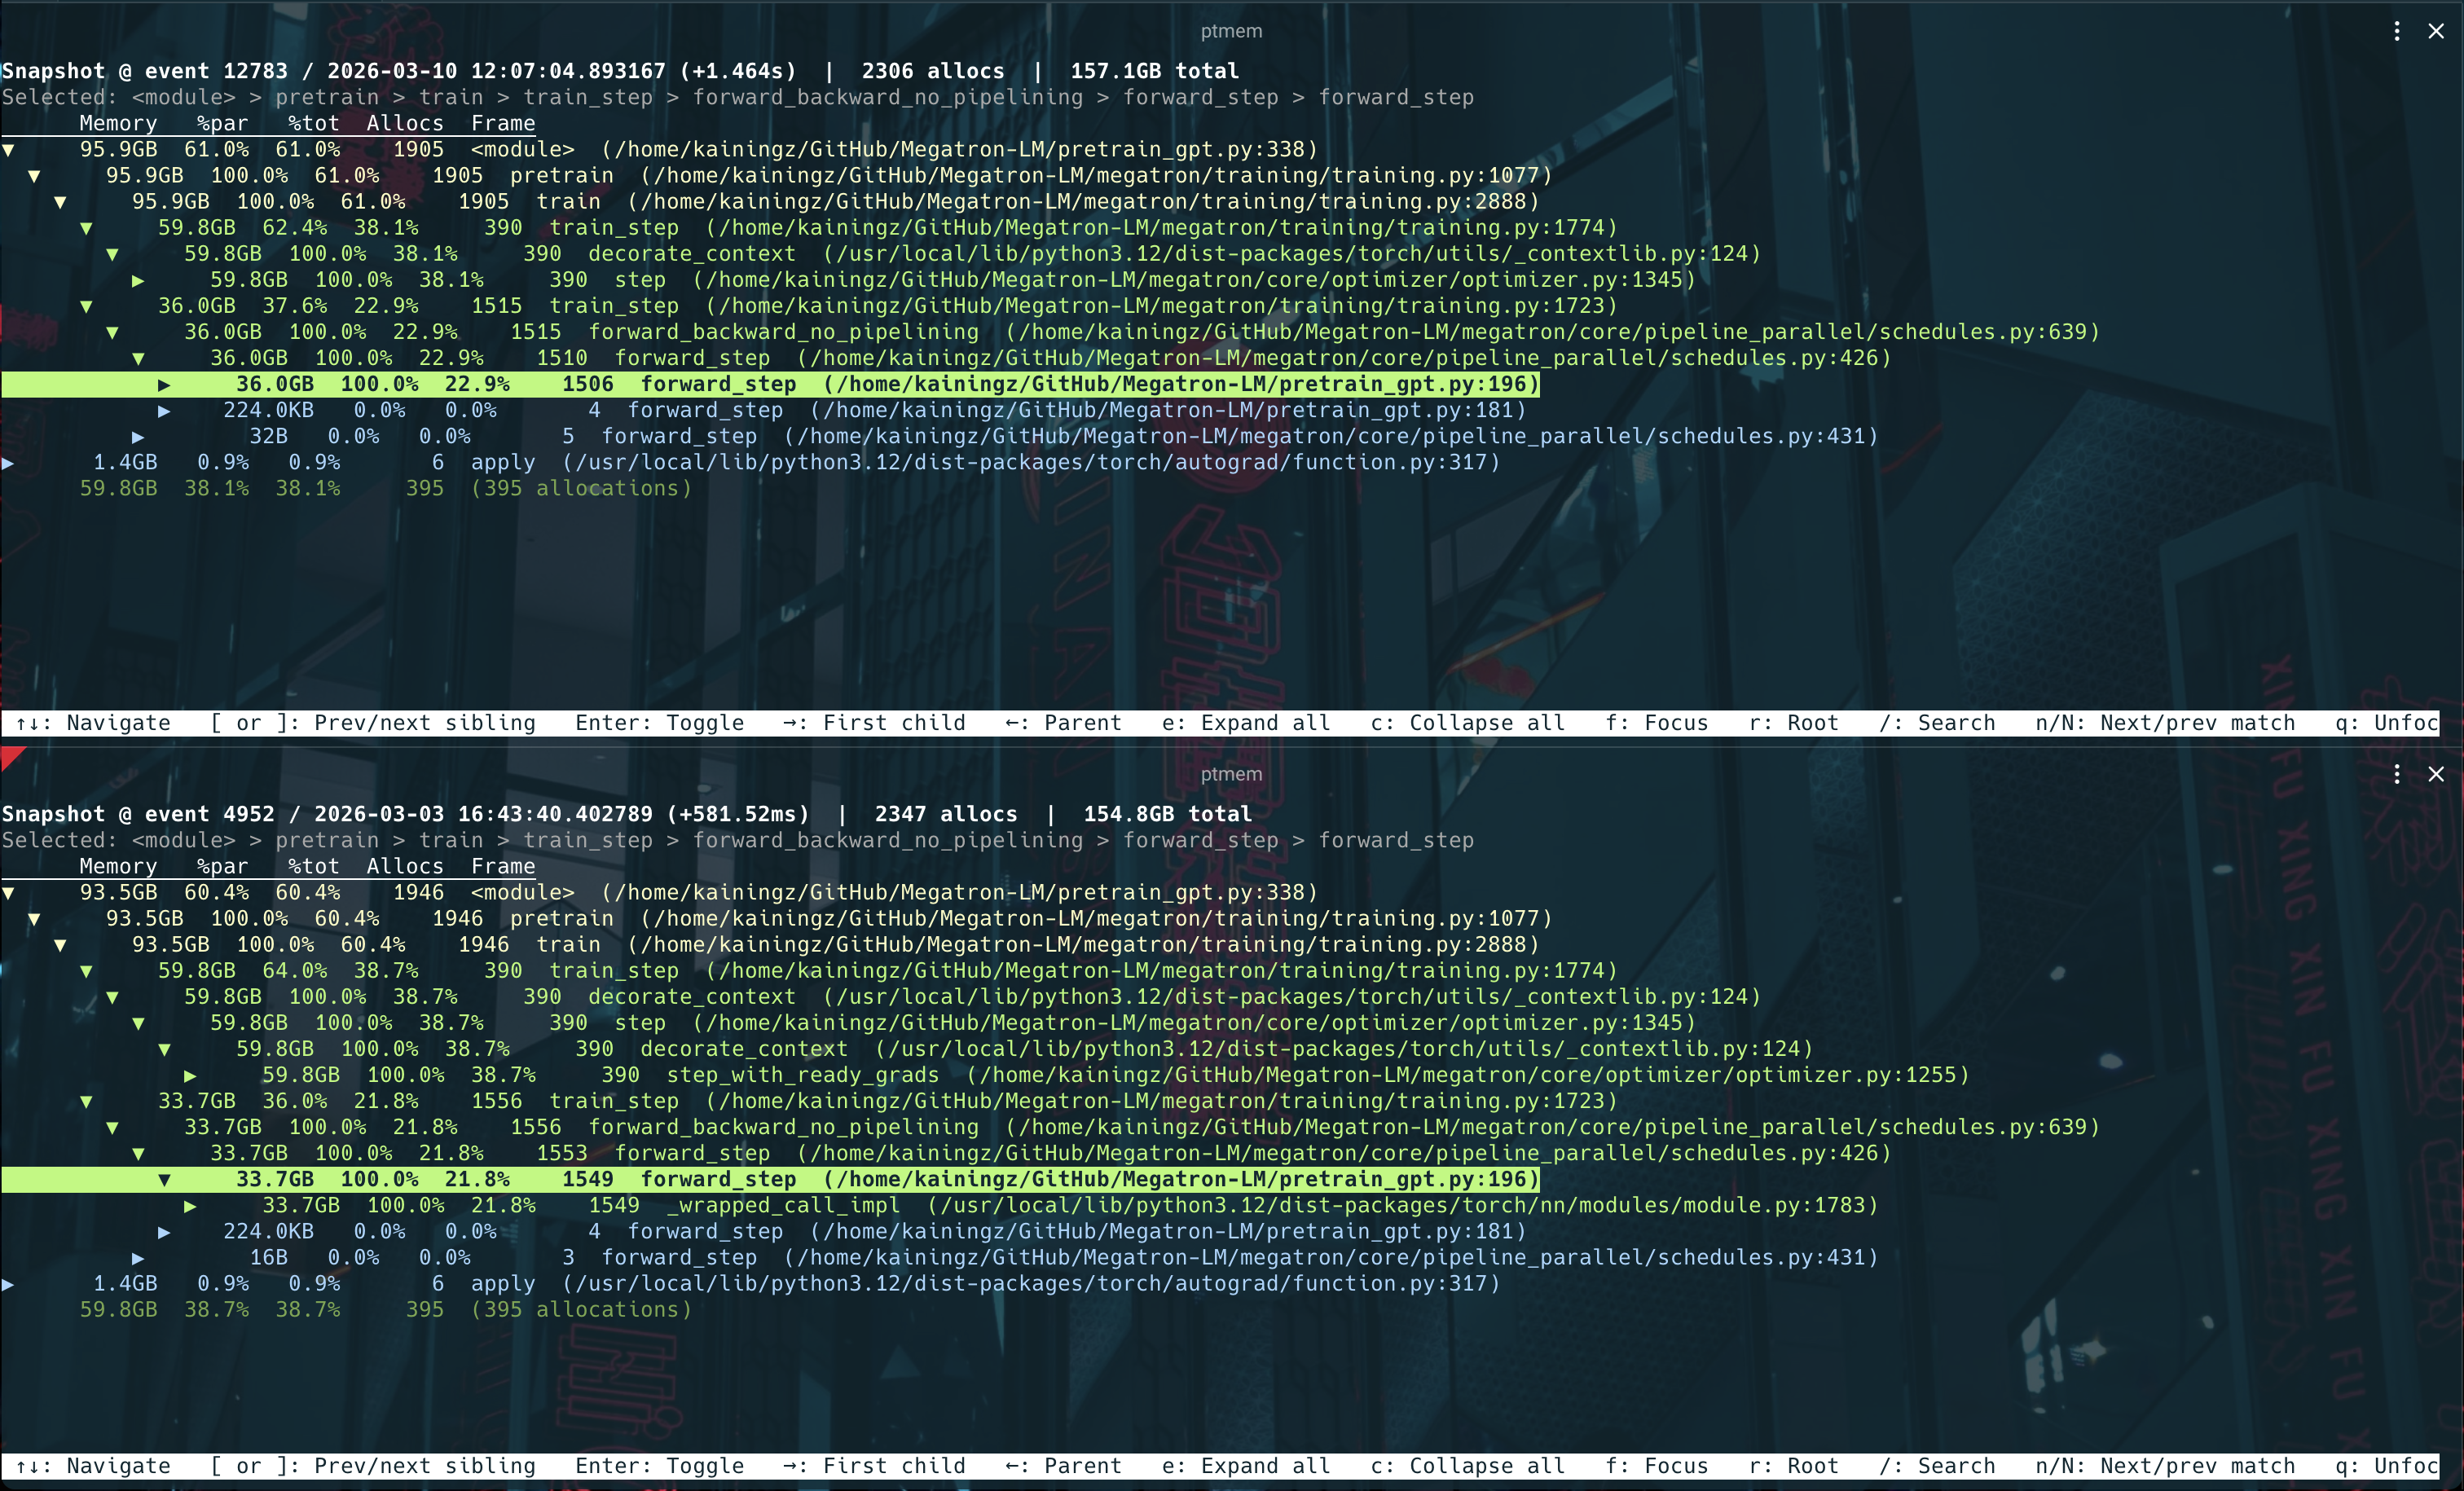
TODO: currently you need to open two terminal tabs (such as using tmux) to compare, but I should be able to integrate into this tool and become a build-in feature.
Recording a snapshot
See https://pytorch.org/blog/understanding-gpu-memory-1/ for more detail.
import torch

torch.cuda.memory._record_memory_history(max_entries=100_000)

# ... run your model / training step ...

torch.cuda.memory._dump_snapshot("snapshot.pkl")
torch.cuda.memory._record_memory_history(None)  # stop recording
Installation
pip install ptmem
Development install
Clone the repo and install in editable mode:
git clone https://github.com/kainzhong/ptmem.git
cd ptmem
pip install -e .
The ptmem command will then reflect any local changes you make to src/ptmem/cli.py immediately, without reinstalling.
Usage
ptmem <snapshot.pkl>
Print a text summary without launching the interactive UI:
ptmem -s <snapshot.pkl>
Print all keyboard controls:
ptmem -k
To compare two snapshots side by side:
ptmem -c <snapshot1.pkl> <snapshot2.pkl>
The tool parses the snapshot (or loads the cache), then launches the interactive UI (or prints a summary if -s is given).
Controls
Timeline view
| Key | Action |
|---|---|
← / → |
Step one column left / right |
b / f |
Jump ±15 columns |
[ / ] |
Jump ±¼ page left / right |
+ / - |
Zoom in / out (cursor stays centered) |
↑ / ↓ |
Pan y-axis up / down (raise or lower the visible memory floor) |
r |
Reset y-axis to full range (bottom = 0) |
Enter |
Open snapshot detail at current cursor position |
q |
Quit |
Snapshot / detail view
| Key | Action |
|---|---|
↑ / ↓ |
Navigate rows |
[ / ] |
Jump to previous / next sibling frame |
Enter |
Expand or collapse selected frame |
→ |
Move cursor to selected frame's first child (expands if needed) |
← |
Move cursor to selected frame's parent |
e |
Recursively expand selected frame and all descendants |
c |
Collapse selected frame and all descendants |
r |
Jump cursor to the root of the current tree |
f |
Focus: make selected frame the new root (resets indentation) |
h |
Toggle hiding PyTorch internal and no-source frames |
q |
Unfocus (pop focus stack) or return to timeline view |
Q |
Quit the program immediately |
/ |
Open search bar (type to filter frames by name) |
n / N |
Jump to next / previous search match |
Esc |
Clear search highlights |
When internal frames are hidden (h), any frame whose filename contains /site-packages/torch/, /dist-packages/torch/, or /lib/python3, or that has no filename or line number, is removed from every allocation's call stack before grouping. This surfaces your own code at the top of the tree instead of burying it under layers of PyTorch internals.
Compare mode (-c / --compare)
| Key | Action |
|---|---|
{ or } |
Switch focus between pane 1 and pane 2 |
s |
Toggle between vertical split (left/right) and horizontal split (top/bottom) |
All other keys operate on the currently focused pane, identical to single-file mode. The inactive pane is dimmed. The active pane is indicated by a ◀/▶ marker on the vertical separator or a ▲/▼ marker on the horizontal separator. Switching split direction automatically re-fits both timelines to the new pane width.
How it works
PyTorch's _dump_snapshot() produces a pickle file containing:
device_traces— a sequence ofalloc/free_requested/free_completedevents with timestamps and call framessegments— the final live state of every CUDA memory segment at dump time, including blocks and their frames
The tool replays alloc / free_completed events (ignoring free_requested, which is a cache-layer detail) to reconstruct the full memory timeline. It also derives memory allocated before _record_memory_history() was called from the segments data, so the timeline baseline is accurate rather than starting from zero.
License
This project is licensed under the MIT License. Copyright (c) 2026 Kaining Zhong. You are free to use, modify, and distribute this software as long as you include the original copyright notice. See the LICENSE file for the full text.
Release history Release notifications | RSS feed


Download files
Download the file for your platform. If you're not sure which to choose, learn more about installing packages.
Source Distribution
Built Distribution
Filter files by name, interpreter, ABI, and platform.
If you're not sure about the file name format, learn more about wheel file names.
Copy a direct link to the current filters
File details
Details for the file ptmem-0.1.2.tar.gz.
File metadata
- Download URL: ptmem-0.1.2.tar.gz
- Upload date:
- Size: 34.4 kB
- Tags: Source
- Uploaded using Trusted Publishing? No
- Uploaded via: twine/6.2.0 CPython/3.13.11
File hashes
| Algorithm | Hash digest | |
|---|---|---|
| SHA256 |
cde357c5a906b9dcecf0e1cc35851523f5c1416ddecee01ff5604a458befd60c
|
|
| MD5 |
9d73590b6a045d6a039f46a79e53d9d1
|
|
| BLAKE2b-256 |
8b2a6d2ca1e3cdc8a7b507f11dd523596526f12f3e18743c2ed1ab5aaa2a2f4e
|
File details
Details for the file ptmem-0.1.2-py3-none-any.whl.
File metadata
- Download URL: ptmem-0.1.2-py3-none-any.whl
- Upload date:
- Size: 22.8 kB
- Tags: Python 3
- Uploaded using Trusted Publishing? No
- Uploaded via: twine/6.2.0 CPython/3.13.11
File hashes
| Algorithm | Hash digest | |
|---|---|---|
| SHA256 |
b88d63a866a767be7857d556860fc321354742689ec59cf56ee10a72cc46c885
|
|
| MD5 |
9dd60ba3d4dabbacc80233a447cec03e
|
|
| BLAKE2b-256 |
ef27bd280c243c8034a370a18700e25dfe882a054e63054921e6e2b5ef909894
|






