
PV-Copilot
End-to-end PV degradation-rate analysis, on your own computer.
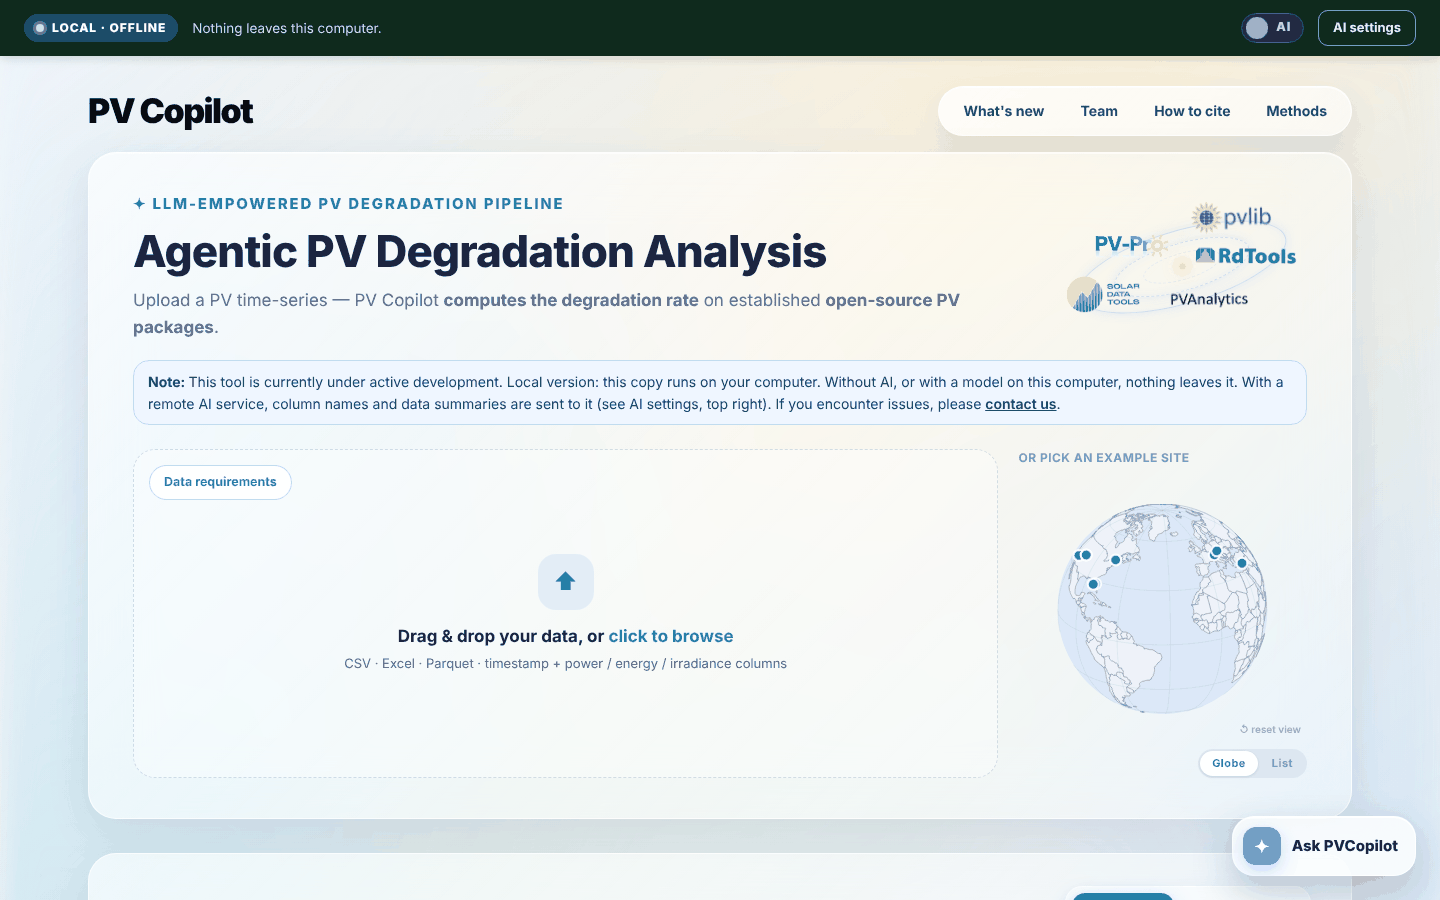
PV-Copilot takes a PV time series (power, irradiance, temperature, …), finds the right columns, cleans and filters the data, and computes the performance loss rate (%/yr) with established methods from pvlib, RdTools and PVAnalytics. It is the same tool as pvtools.lbl.gov/pv-copilot, packaged to run locally.
There are two ways to use it:
| Local web app | pvcopilot ui opens the full PV-Copilot interface in your browser: Simple and Advanced modes, PVPRO, AI diagnosis, chat, code export. |
| Python | pvcopilot.analyze(...) returns the degradation rate(s), figures and a stand-alone script that reproduces the result. |
AI features are optional and use your own LLM account (OpenAI, CBorg, Azure, or a model running on your computer). Without AI, everything still works.
Contents
- Install
- Open the web app
- Set up AI (optional)
- What leaves your computer
- Python API
- Command line
- Example data
- Troubleshooting
- For developers
- Citation, data sources and license
1. Install
PV-Copilot needs Python 3.10 or 3.11. Its versions of pandas, pvlib and RdTools are pinned to the ones the website uses, so the numbers match exactly, and that pandas version has no builds for Python 3.12 or newer. Use a separate environment:
conda create -n pvcopilot python=3.11 -y
conda activate pvcopilot
pip install pvcopilot-0.1.0-py3-none-any.whl     # the wheel file you were given
# from a source folder instead:  pip install .      (or  pip install -e .  to edit the code)
# once it is on PyPI:            pip install pvcopilot
Already have an environment with the PV-Copilot website's dependencies (e.g. the
pvtools environment)? Install only PV-Copilot itself, so nothing else changes:
pip install -e . --no-deps
Size. About 230 MB to download and 700 MB installed on macOS, all dependencies included. On Linux, RdTools' xgboost dependency adds about 0.7 GB more.
2. Open the web app
conda activate pvcopilot
pvcopilot ui
Your browser opens http://127.0.0.1:8050. The terminal window is the app's
local server: keep it open while you work, and close it (or press Ctrl+C) to stop.
Prefer a double-click? Run this once:
pvcopilot shortcut # puts a launcher on your Desktop (or: --dir some/folder)
Double-click PV-Copilot.command (macOS), PV-Copilot.bat (Windows) or the
.desktop entry (Linux) to start it. No need to activate the environment first.
Double-clicking again while it runs just reopens the page.
The top bar shows:

| LOCAL · OFFLINE (green) | Nothing leaves your computer. |
| LOCAL · AI ONLINE (amber) | A remote AI service is in use. Hover the text to see what is sent. |
| AI switch | Turns every AI feature on or off. It is off each time the app starts. While off, no AI request of any kind is made. |
| AI settings | Tell PV-Copilot where your API key is (see below). |
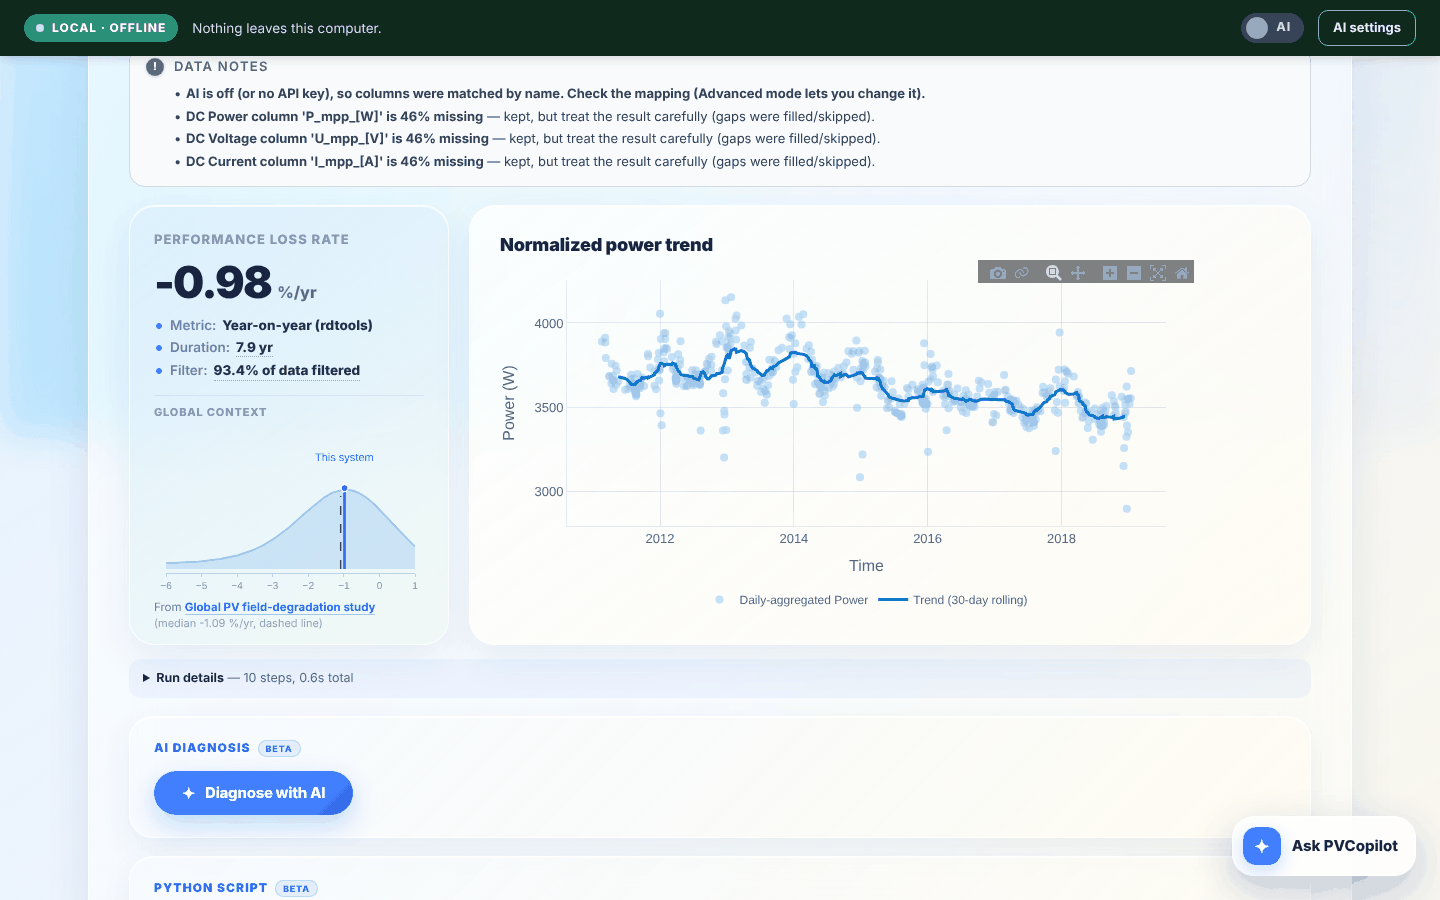
To try it right away, click List under Or pick an example site, choose an example, then Run analysis:
3. Set up AI (optional)
AI is used for automatic column identification, the AI diagnosis, the chat assistant and the AI clean-up of the exported script.
PV-Copilot never looks for an API key on its own. It does not read
OPENAI_API_KEY from your environment or any .env file by itself, and you
never type the key into the app. Instead you point it to a file:
Step 1: put your key in a file (once). Use any file, for example
~/keys/pvcopilot.env, with one line:
OPENAI_API_KEY=sk-...
Any variable name works (CBORG_API_KEY=..., …). An existing .env file that
already holds your key works too. Quotes around the value are fine.
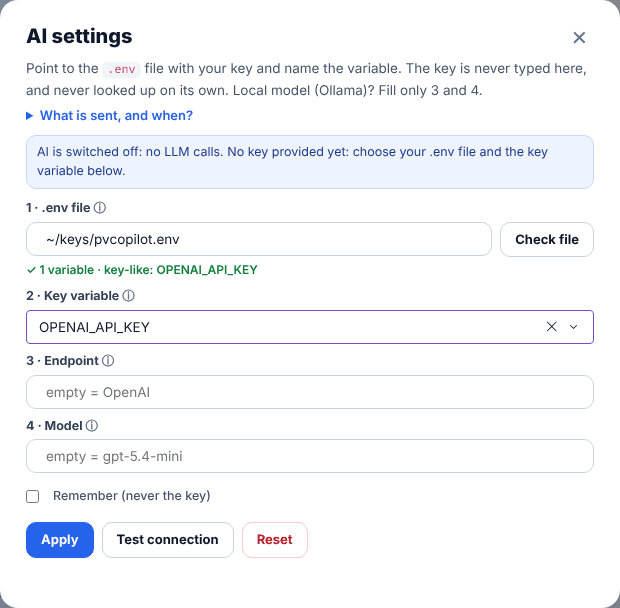
Step 2: tell PV-Copilot about it, in the web app:
- Turn the AI switch on. The settings panel opens if no key is set yet. Otherwise, click AI settings.
- 1 · .env file: type the path, e.g.
~/keys/pvcopilot.envor/Users/you/project/.env, then click Check file. - 2 · Key variable: pick the variable that holds the key. Only names are listed; values are never shown.
- 3 · Endpoint and 4 · Model: leave both empty for OpenAI. See the table below for other services.
- Click Apply, then Test connection.
Or do it all at start-up:
pvcopilot ui --ai --env-file ~/keys/pvcopilot.env --key-var OPENAI_API_KEY
| Service | Endpoint | Model (example) | Key needed |
|---|---|---|---|
| OpenAI | (empty) | (empty) = gpt-5.4-mini |
yes |
| LBNL CBorg | https://api.cborg.lbl.gov |
openai/gpt-5.4-mini |
yes |
| Ollama on your computer | http://localhost:11434/v1 |
qwen3:14b |
no: fill only Endpoint and Model |
| Other OpenAI-compatible service | its base URL | its model name | usually |
About the key. It is read from your file into memory only. It is shown masked
(sk-…abcd), never sent to the browser and never written anywhere by
PV-Copilot. Remember in the settings panel saves only the file path,
variable name, endpoint and model, never the key. Next time those choices are
filled in for you but take effect only when you click Apply.
pvcopilot config --forget deletes them.
If an AI request fails (key rejected, no network, unknown model), the analysis still runs: columns are matched by name, and the reason is shown in the page's Data notes and in the terminal.
4. What leaves your computer
| Situation | What is sent |
|---|---|
| AI switch off, or no key set | Nothing. |
AI on, model on your computer (Ollama, LM Studio, vLLM at localhost) |
Nothing. |
| AI on, remote service (OpenAI, CBorg, …) | Your data file is not uploaded, but the texts below are sent to that service. |
With a remote service:
| Feature | When | What is sent |
|---|---|---|
| Column identification | automatically, when you click Run analysis | the column names |
| AI diagnosis | when you click it | file name, time range, row counts, filter results, degradation rates, data gaps, and monthly averages of power, irradiance, temperature, voltage and current |
| Ask PVCopilot (chat) | when you send a question | your question and a summary of the current analysis |
| Generate code with AI | when you click it | the analysis script (settings and column names, no measurements) |
If not even summaries of your data may leave the computer, keep the AI switch off or use a local model.
5. Python API
The notebook examples/quickstart.ipynb walks
through everything below on the bundled data.
import pvcopilot

# one call, one rate (Simple mode, year-on-year)
res = pvcopilot.analyze("pvdaq4", pvcopilot.EXAMPLE_MAPPINGS["pvdaq4"])
print(res)            # rate, readings kept, column mapping, data notes
res.rates             # {'YOY': -0.44}   (%/yr)
Your own data, with the columns named explicitly (no AI needed):
res = pvcopilot.analyze(
    "my_system.csv",                       # .csv, .xlsx, .parquet, or a DataFrame
    mapping={"Time": "timestamp", "DC Power": "dc_power",
             "Irradiance": "poa_irradiance", "Module temperature": "t_mod"},
)
Advanced mode: choose filters and compare methods.
res = pvcopilot.analyze(
    "my_system.csv", mapping,
    mode="advanced",
    methods=["YOY", "LR", "CSD", "HW", "ARIMA"],
    filters=["timezone", "clearsky", "low-irra-power", "outlier"],
    filter_params={"irr_thresh": 400, "iqr": 1.5},
    clearsky={"latitude": 39.74, "longitude": -105.17},   # modelled (pvlib) clear-sky reference
)
res.show()
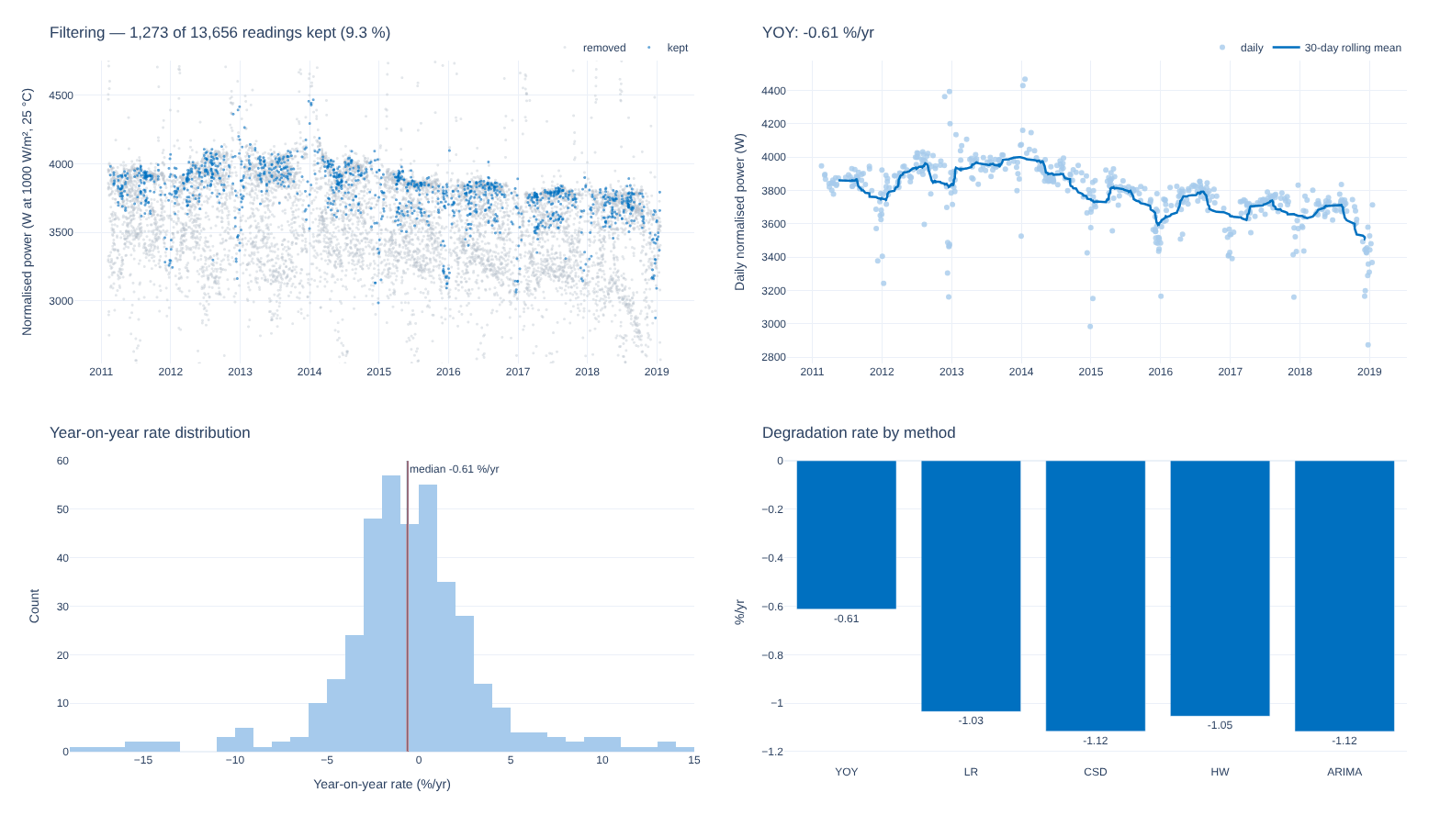
res.figures() for the EURAC example with five methods: filtering, daily
performance with the YoY trend, the year-on-year distribution, and the
comparison of methods.
PVPRO (single-diode model fit; needs DC voltage, current and module temperature):
res = pvcopilot.analyze("sys1403", pvcopilot.EXAMPLE_MAPPINGS["sys1403"],
                        methods=["PVPRO"],
                        pvpro={"cells_in_series": 60,      # per module  } set these
                               "modules_per_string": 1,    #             } to your
                               "parallel_strings": 1,      #             } system
                               "technology": "mono-c-Si"})
Let PV-Copilot find the columns. Leave out mapping. Without AI, columns are
matched by name; check res.mapping and res.notes. With AI:
pvcopilot.configure(env_file="~/keys/pvcopilot.env", key_var="OPENAI_API_KEY")
res = pvcopilot.analyze("my_system.csv")
In Python, AI is on as soon as a key is configured. pvcopilot.set_ai(False)
turns every AI request off.
Column roles
| Role | Needed for | Notes |
|---|---|---|
DC Power |
all methods | AC power also works (includes inverter effects) |
Irradiance |
all methods | plane-of-array, W/m² |
Module temperature |
temperature correction | optional; °F is converted automatically |
DC Voltage, DC Current |
PVPRO | |
Time |
column name; leave out when the timestamps are the index |
A column you name in mapping is used exactly as given.
The result
res.rates, res.rate |
rate per method (%/yr); rate is the first available |
res.mapping, res.notes |
columns used; data-quality notes |
res.df_all, res.df_good, res.daily |
all readings (with normalised performance norm), readings kept by the filters, daily performance index |
res.figures(), res.show() |
Plotly figures |
res.save_figures("figs") |
figures as HTML files (PNG: pip install kaleido, then fmt="png") |
res.to_script("analysis.py") |
a stand-alone script that reproduces this run with pandas / pvlib / RdTools only |
res.to_dict() |
the result as plain data, e.g. for JSON |
analyze() runs the same code as the web app: it builds the app's own exported
analysis script for your settings and executes it. The test suite checks that
analyze() gives the web app's rate on all nine example datasets.
6. Command line
pvcopilot ui        [--ai] [--env-file F --key-var V] [--base-url U] [--model M]
                    [--port 8050] [--no-browser]
pvcopilot analyze   DATA [-m YOY -m LR ...] [--mode simple|advanced]
                    [--map "DC Power=pdc" --map "Irradiance=poa" ...]
                    [--script analysis.py] [--figures figs] [--json]
                    [--env-file F --key-var V] [--base-url U] [--model M]
pvcopilot examples  [--export FOLDER]      # list the example datasets / write them as CSV
pvcopilot config    [--forget]             # show the AI settings / delete remembered ones
pvcopilot shortcut  [--dir FOLDER]         # create the double-click launcher
Examples:
pvcopilot analyze my_system.csv                         # Simple mode, YoY
pvcopilot analyze my_system.csv -m YOY -m LR -m CSD     # several methods (Advanced)
pvcopilot analyze pvdaq4 --script pvdaq4.py --figures pvdaq4_figs
7. Example data
Nine field datasets are installed with the package: PVDAQ systems and the IEA PVPS Task 13 PLR benchmark systems, as hourly averages, with their original column names.
| Name | System | Location |
|---|---|---|
sys1278 |
PVDAQ 1278, 8.9 yr c-Si (with V, I) | Las Vegas, NV, USA |
sys1403 |
PVDAQ 1403, 3.1 yr c-Si (with V, I) | Cocoa Beach, FL, USA |
sys1422 |
PVDAQ 1422, 1.7 yr c-Si | Burlington, VT, USA |
pvdaq4 |
PVDAQ system 4, 6.8 yr c-Si | Golden, CO, USA |
nrel_stf |
NREL STF building, 8.3 yr multi-Si | Golden, CO, USA |
pvdaq1300 |
PVDAQ 1300, 5.5 yr c-Si (3-yr outage; with V, I) | St Petersburg, FL, USA |
eurac6 |
EURAC system 6, 8.0 yr multi-Si (with V, I) | Bolzano, Italy |
pfaffstaetten |
Pfaffstätten A, 6.3 yr c-Si | Pfaffstätten, Austria |
ucy_nicosia |
UCY Nicosia, 10.0 yr mono-Si | Nicosia, Cyprus |
pvcopilot.list_examples()                          # this table, with file names
pvcopilot.examples.example_file("pvdaq4")          # where the file is installed
df = pvcopilot.load_example("pvdaq4")              # the raw data
pvcopilot.EXAMPLE_MAPPINGS["pvdaq4"]               # column mapping checked against the data
pvcopilot.export_example("pvdaq4", "pvdaq4.csv")   # a CSV copy, e.g. to try the upload box
The files live in <your Python environment>/site-packages/pvcopilot/data/examples/.
NREL STF has three irradiance channels. poa_local drifts upward over the years,
so its mapping uses poa_measured_40.
8. Troubleshooting
| Problem | What to do |
|---|---|
command not found: pvcopilot |
Activate the environment you installed it in (conda activate pvcopilot), or install it (section 1). |
requires a different Python / pandas fails to build |
Use Python 3.10 or 3.11 (section 1). |
| Run analysis does nothing / "Couldn't identify the required columns" | Look at Data notes and the terminal for the reason. Check the key with AI settings → Test connection. Or name the columns yourself in Advanced mode. |
Address already in use / the page opens on port 8051 |
Port 8050 is taken; PV-Copilot moved to the next free port. That is fine. |
Warning pvanalytics is not installed |
Optional. pip install pvanalytics==0.2.2 ruptures restores the exact website behaviour of the outlier filter. |
| macOS: the launcher "cannot be opened" | Right-click PV-Copilot.command → Open once; after that a double-click works. |
| "File not found" in AI settings | Check the path with ls -la ~/path/to/file.env. Dragging the file onto a terminal window shows its full path. |
9. For developers
- The package is generated from the website code (
pages/pvcopilot.py,page_supporting_files/). After changing the website, runpython tools/sync_from_website.py /path/to/pvtools, thenpytest tests -q. Every edit the sync makes checks that it matched, so a website change that breaks one fails loudly. - The web app uses Flask's built-in server, meant for one person on
127.0.0.1. To share it on a network, rungunicorn --workers 1 --threads 8 pvcopilot.app.wsgi:server. Note that it has no login. - Files the app writes (session cache, PVPRO jobs, the column-name cache) go to
~/Library/Caches/pvcopilot(macOS),~/.cache/pvcopilot(Linux) or%LOCALAPPDATA%\pvcopilot(Windows). Change the location withPVCOPILOT_CACHE_DIR.
10. Citation, data sources and license
B. Li, A. Jain, "PV Copilot: A Large Language Model–Enabled Tool for End-to-End PV Degradation Analysis," IEEE PVSC 2026.
Bundled data. The example datasets are hourly averages of public data:
PVDAQ (NREL, data.openei.org), and the
IEA PVPS Task 13 PLR benchmark systems (Lindig et al., Prog. Photovolt. 2021,
doi:10.1002/pip.3397; data:
osf.io/vtr2s). City search uses GeoNames cities15000
(geonames.org, CC BY 4.0).
Lawrence Berkeley National Laboratory · DuraMAT. See LICENSE.
1 maintainer

Metadata
1 maintainer
Release files for pvcopilot 0.1.0
For a detailed explanation of source distributions (sdists) and built distributions (wheels), please see the package formats documentation.
Source distribution (sdist)
| File | Size | Uploaded | |
|---|---|---|---|
| pvcopilot-0.1.0.tar.gz | 16.8 MB | Details |
Built distribution (wheel)
| File | Interpreter | ABI | Platform | Reset |
|---|---|---|---|---|
| pvcopilot-0.1.0-py3-none-any.whl | Python 3 | none | any | Details |
Total release size: 33.6 MB
Release files / pvcopilot-0.1.0.tar.gz
| Download URL | pvcopilot-0.1.0.tar.gz |
|---|---|
| Size | 16.8 MB |
| Tags | Source |
|
SHA-256 checksum How to use checksums |
5f0a6847886d56ee29c7528e8f038dd5c6f050eef87e4dacd597d42711acd452
|
|
BLAKE2b-256 checksum How to use checksums |
40ebcca584e5a36ef1829441500d0572608c2f1afb7e7bfb18400818971c230c
|
| Upload date | |
|
Uploaded using Trusted Publishing? What is trusted publishing? |
Yes |
| Uploaded via |
twine/7.0.0 CPython/3.13.14
|
Provenance
Provenance describes where a file came from. On PyPI, provenance is shared via attestations, which provide a verifiable record of the build or publishing details. View details, limitations and caveats.


PyPI Publish Attestation
PyPI verified that this artifact, at this checksum, originated from the publisher listed below.
Signed by GitHub Actions, verified by PyPI on Oct 8, 2026.
Transparency logRelease files / pvcopilot-0.1.0-py3-none-any.whl
| Download URL | pvcopilot-0.1.0-py3-none-any.whl |
|---|---|
| Size | 16.8 MB |
| Tags | Python 3 |
|
SHA-256 checksum How to use checksums |
8769957989d79fd143b5af520bca575a8782f8f783c2041a25549a894a143b40
|
|
BLAKE2b-256 checksum How to use checksums |
96eb5b8106119778212b0a948a248ed100d5cf96f59426f680d6748a1ca9f664
|
| Upload date | |
|
Uploaded using Trusted Publishing? What is trusted publishing? |
Yes |
| Uploaded via |
twine/7.0.0 CPython/3.13.14
|
Provenance
Provenance describes where a file came from. On PyPI, provenance is shared via attestations, which provide a verifiable record of the build or publishing details. View details, limitations and caveats.
PyPI Publish Attestation
PyPI verified that this artifact, at this checksum, originated from the publisher listed below.
Signed by GitHub Actions, verified by PyPI on Oct 8, 2026.
Transparency log












