
py-beacon


py-beacon is a Python library for building indices, ETFs and Delta-1 derivatives. You define an index methodology, calculate the index's history on a real exchange calendar, backtest a portfolio that tracks it, and analyse the result.
Documentation: pybeacon.dev/library · Changelog: pybeacon.dev/changelog · Source: github.com/karanbh01/py-beacon
Install
py-beacon needs Python 3.11 or later.
pip install py-beacon-kit
In code, import it as beacon. A plain install does everything but serve the
API and download market data: indices, backtests, funds and derivatives,
charts and interactive charts, PDF and Excel reports, the optimiser and
Postgres stores. Two extras add the rest: server (the local API server) and
data (Yahoo Finance downloads), as in pip install "py-beacon-kit[server]".
The documentation lists what each
one adds.
Quickstart
Define an index, calculate it, and backtest a portfolio that tracks it. The example builds its own small dataset, so it runs as it is. Each block is a cell, as in a notebook.
import logging

import numpy as np
import pandas as pd

from beacon.backtest import Backtest
from beacon.data import DataFetcher, MarketData, ReferenceData
from beacon.index import EqualWeighted, IndexDefinition
from beacon.index.schedule import sessions

logging.getLogger("beacon").setLevel(logging.ERROR)  # keep the output short
Data. Four stocks priced on every New York Stock Exchange session in 2024, from a seeded random walk, and the reference data that lists them.
days = sessions(pd.Timestamp("2024-01-02"), pd.Timestamp("2024-12-31"), "XNYS")
names = ["AAA", "BBB", "CCC", "DDD"]

rng = np.random.default_rng(28)
returns = rng.normal(0.0004, 0.015, size=(len(days), len(names)))
closes = pd.DataFrame(100 * np.exp(returns.cumsum(axis=0)),
                      index=days,
                      columns=names)

prices = [{"IDENTIFIER": name,
           "DATE": day,
           "CLOSE": closes.at[day, name],
           "SHARES_OUTSTANDING": 1_000_000}
          for day in days
          for name in names]
listings = [{"IDENTIFIER": name,
             "NAME": name,
             "CURRENCY": "USD",
             "EXCHANGE": "XNYS",
             "DATE_FROM": "2020-01-01"}
            for name in names]

data = DataFetcher(MarketData.from_dataframe(pd.DataFrame(prices)),
                   ReferenceData.from_dataframe(pd.DataFrame(listings)))
The index. Equal weight across the four, rebalanced monthly on the NYSE calendar.
definition = IndexDefinition(index_id="DEMO",
                             index_name="Demo Equal-Weight Index",
                             base_date="2024-01-02",
                             base_value=1000.0,
                             currency="USD",
                             eligibility_rules=[],
                             weighting_scheme=EqualWeighted(),
                             rebalancing_frequency="MONTHLY",
                             calendar="XNYS",
                             universe_identifiers=names)
The backtest. Calculate the index, then simulate a portfolio trading to its weights, paying 5 basis points on every trade.
backtest = Backtest(initial_capital=100_000.0,
                    transaction_cost_bps=5.0,
                    data_provider=data)
result = backtest.run(definition,
                      end="2024-12-31")
Results. The index level and the portfolio's NAV each day, and the portfolio's summary metrics against the index.
daily = pd.DataFrame({"Index level": result.index.target.levels,
                      "Portfolio NAV": result.portfolio.nav})
daily.tail().round(2)
| Index level | Portfolio NAV | |
|---|---|---|
| 2024-12-24 | 1088.28 | 108747.08 |
| 2024-12-26 | 1091.06 | 109025.21 |
| 2024-12-27 | 1097.57 | 109675.70 |
| 2024-12-30 | 1119.11 | 111828.46 |
| 2024-12-31 | 1133.80 | 113295.48 |
pd.DataFrame({"Portfolio": result.summary()}).round(4)
| Portfolio | |
|---|---|
| total_return | 0.1330 |
| annualised_return | 0.1330 |
| volatility | 0.1214 |
| sharpe_ratio | 1.0950 |
| max_drawdown | -0.1148 |
| tracking_error | 0.0005 |
| tracking_difference | -0.0008 |
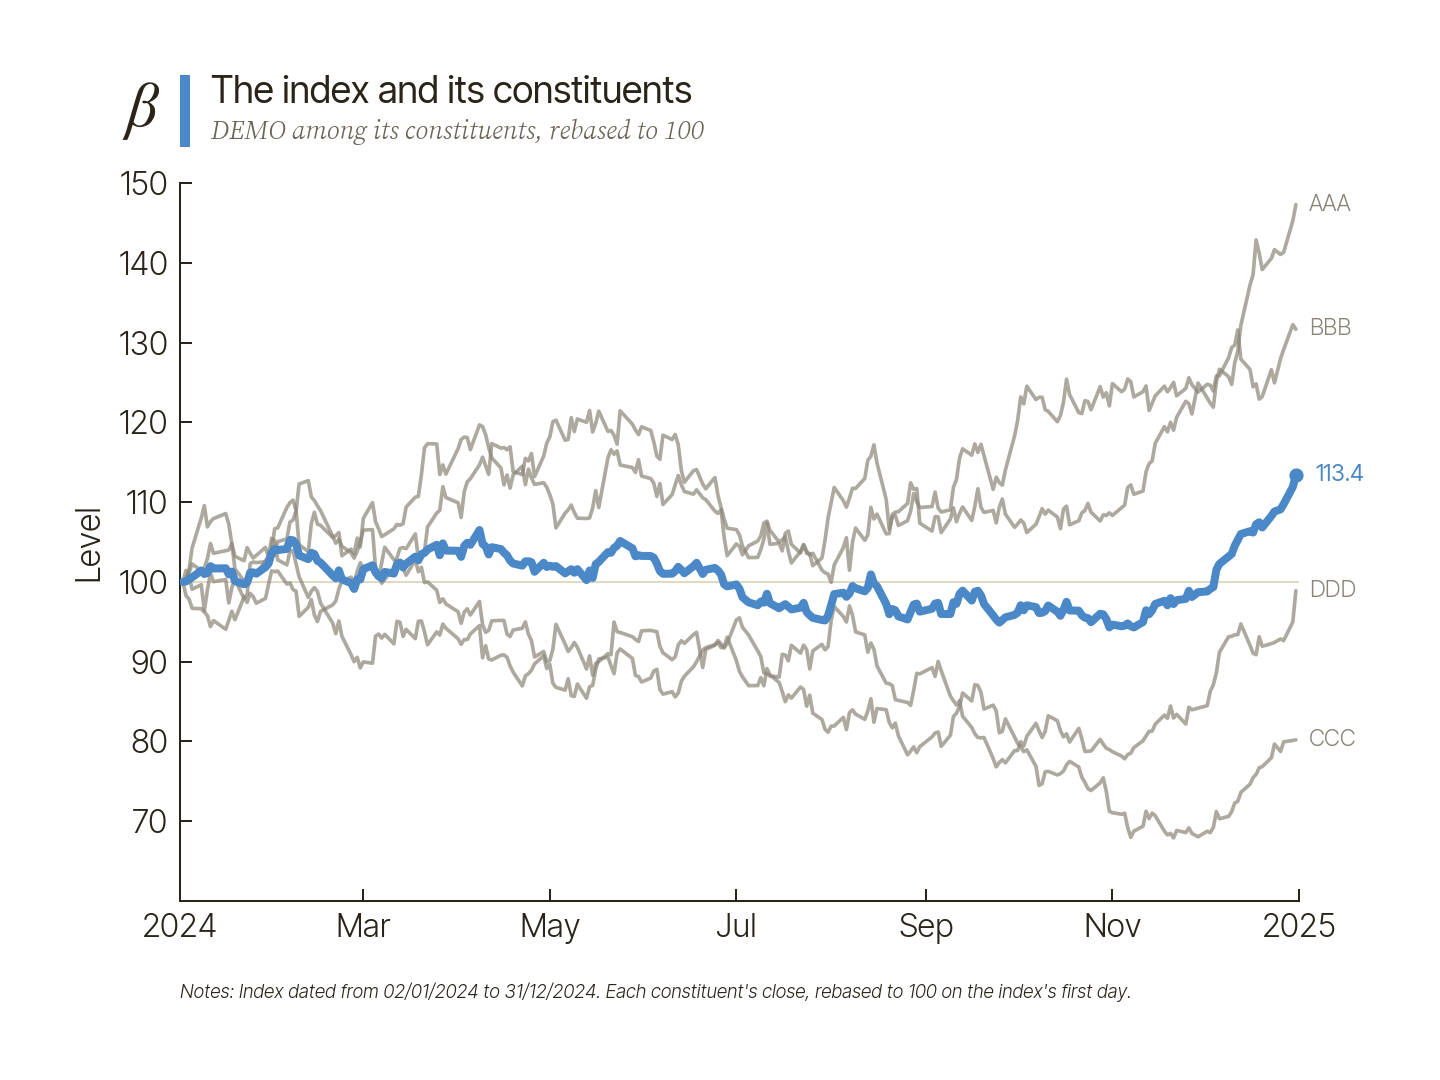
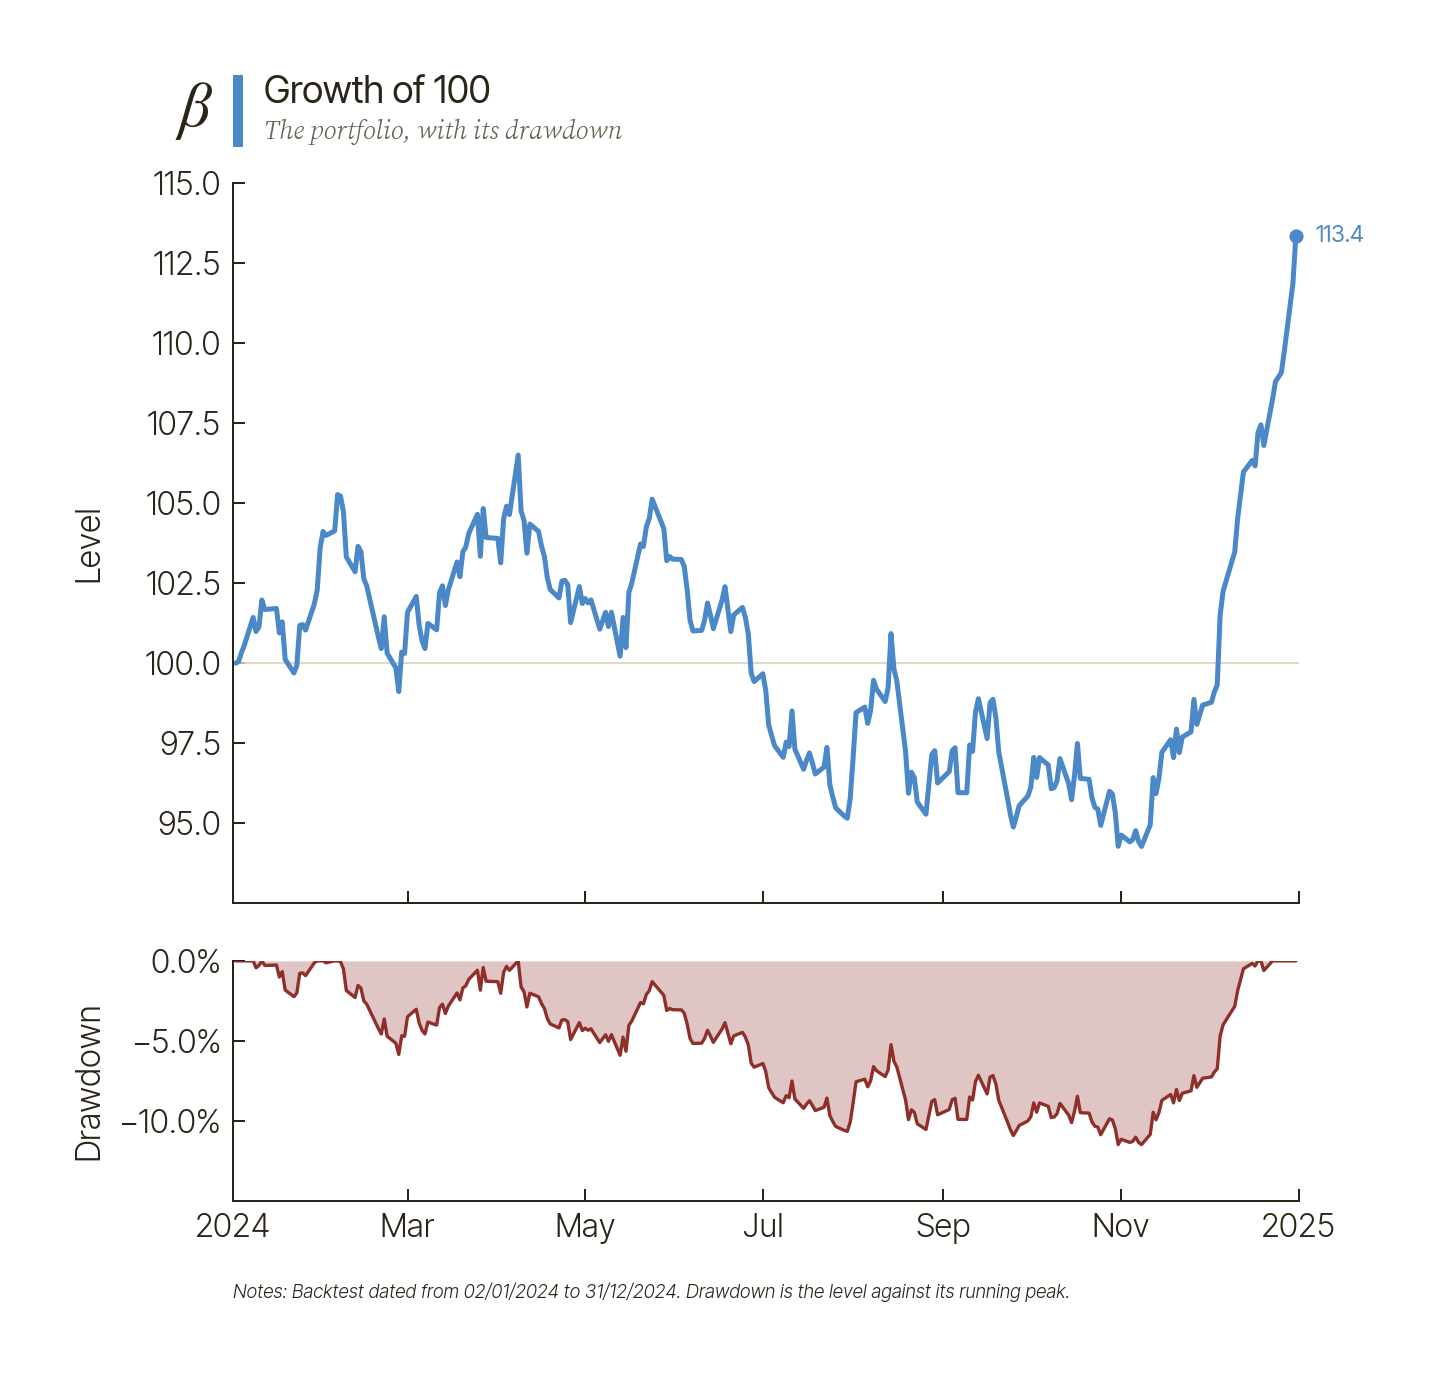
Charts. The index among its four stocks, then the portfolio's growth and
drawdown. The charts here have no background of their own:
transparent-dark-axes is for a light page and transparent-light-axes for
a dark one, and these are shown in whichever matches yours. use("light")
and use("dark") draw on Beacon's own canvas.
from beacon.plot import use

use("transparent-dark-axes")  # no background, for a light page

result.plot.constituents()
result.plot.performance()
Any chart becomes interactive: .interactive() returns a plotly figure drawn
from the same layout, with a popup under the pointer giving each series' value
on the date there. Its HTML carries its fonts and plotly.js, so it works
offline.
result.plot.performance().interactive().write_html("performance.html")
result.index.target holds the index the run aimed at, and
result.portfolio holds the simulated portfolio: its NAV, positions, cash and
transactions. The portfolio ends a little behind the index because it pays
for its trades.
How it fits together
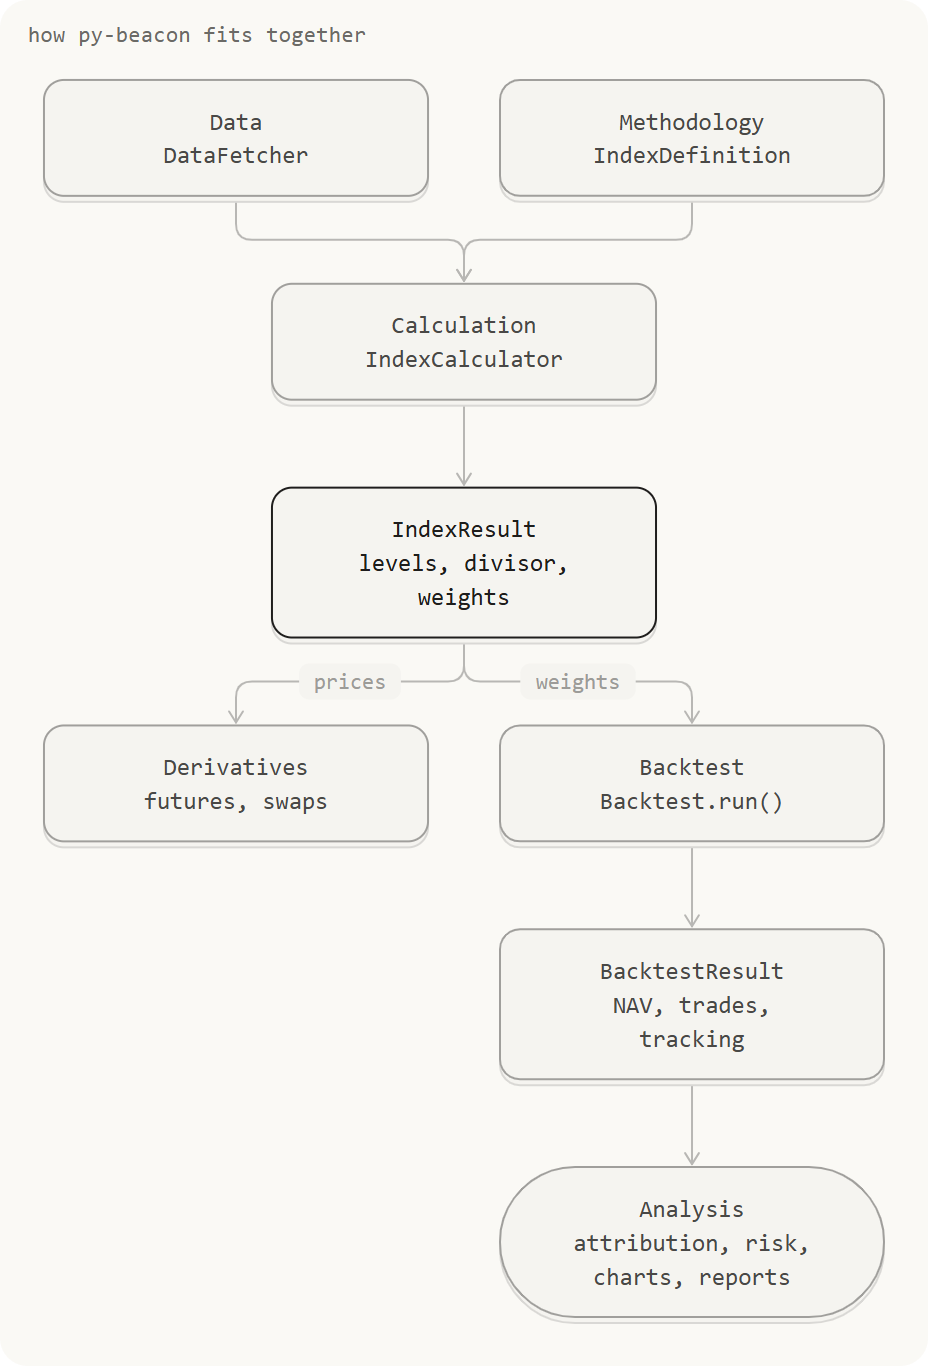
Data, the index and the backtest are separate layers. A DataFetcher serves
every calculation its data. An IndexDefinition says what the index holds,
and IndexCalculator computes its history as an IndexResult. A backtest
trades to the index's weights, and a derivative is priced off its levels.
A backtest has five parts. The strategy decides what is held and the implementation how it is traded. Flows move money in and out, which the vehicle deals at its price and charges its fees on. The modelling assumptions are what the run takes as given.
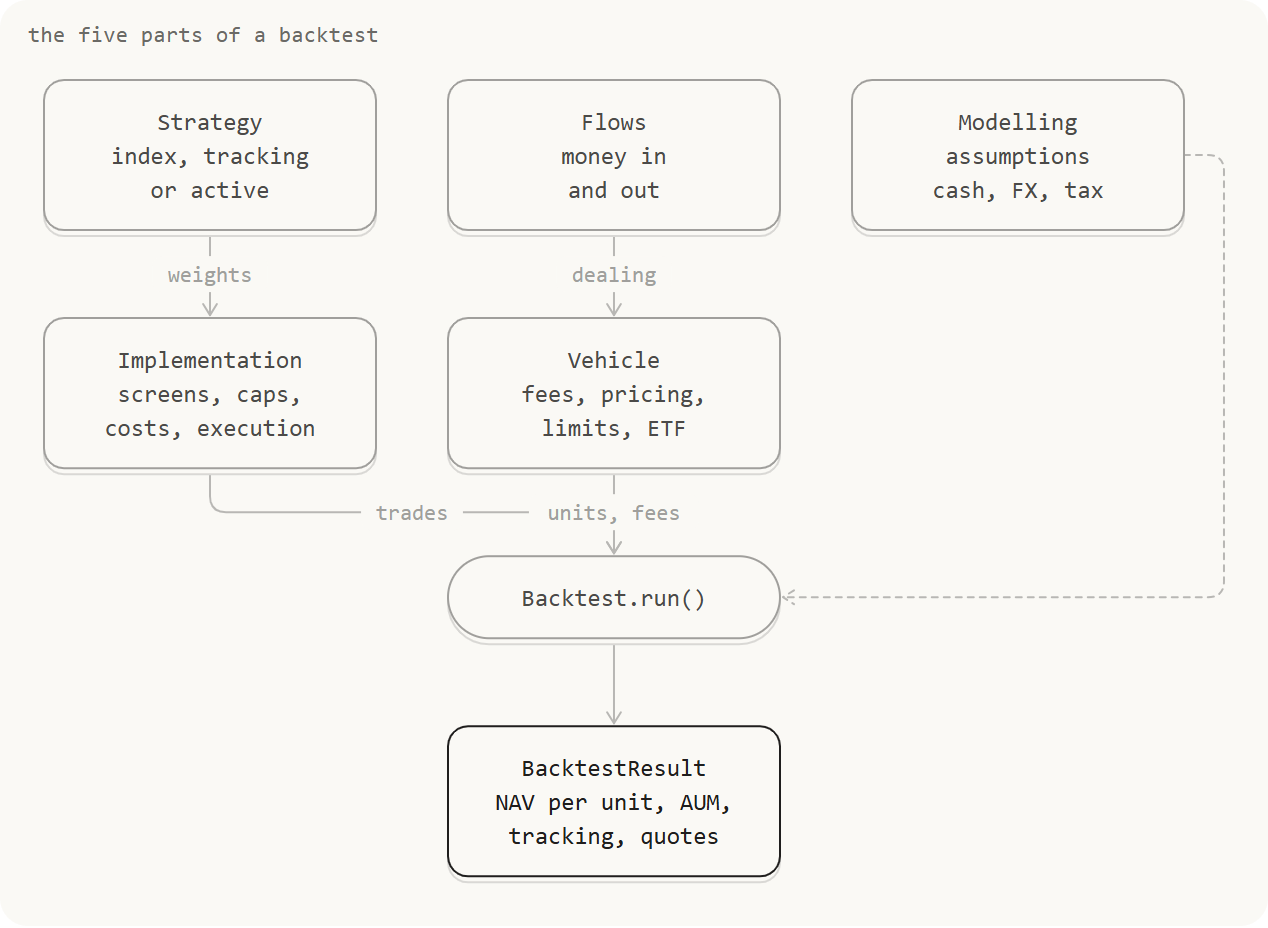
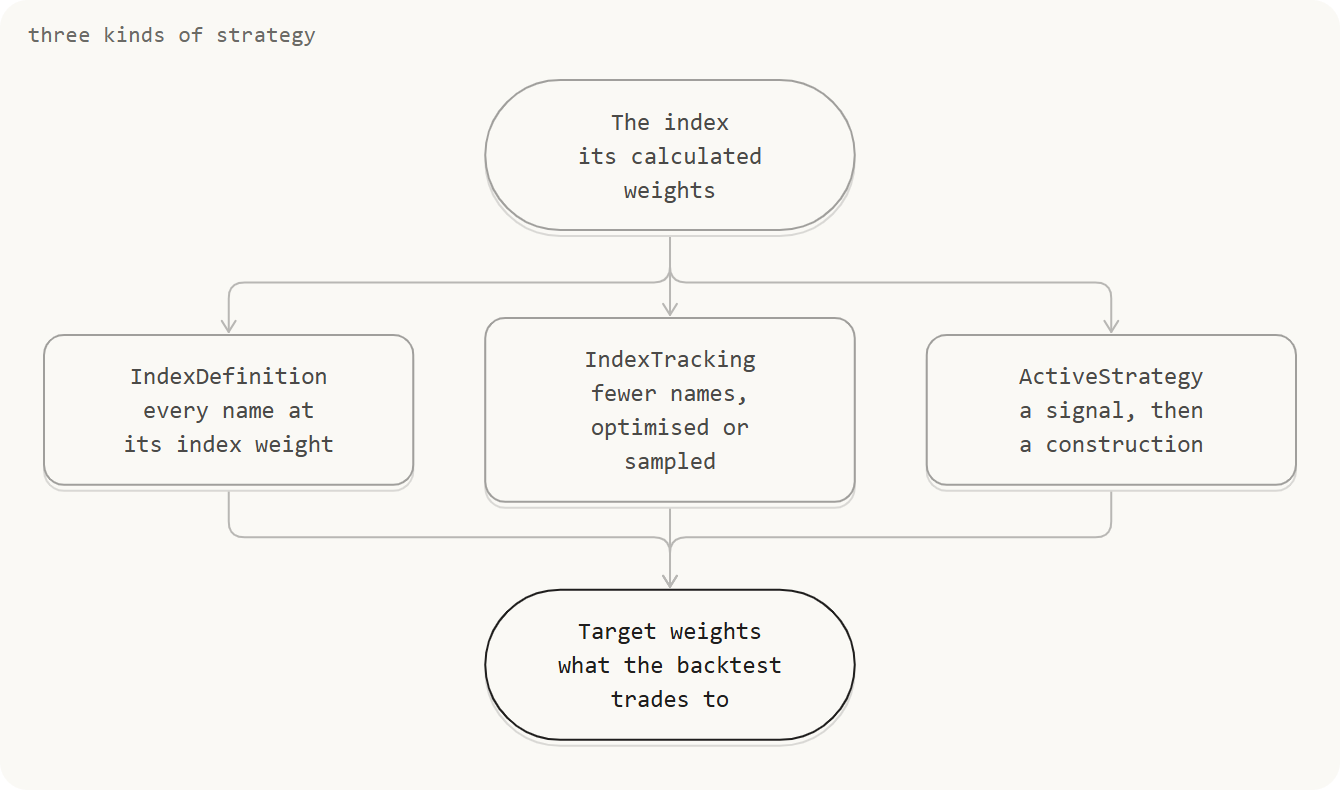
The strategy can hold the index in full, track it with fewer names, or try to beat it. Each gives the backtest its target weights.
What it does
- Indices. Select constituents with eligibility rules, including
expressions such as
data.market.market_cap > 1e9; weight them equally or by (free-float) market cap; cap any one name's weight; and rebalance on a schedule against a real exchange calendar. Indices can be price, total return or net total return, and the divisor handles rebalances, special dividends and delistings. (Methodology) - Backtests. Simulate a portfolio trading towards the index's weights, with transaction costs, drift thresholds and a benchmark, then read its NAV, trades and tracking error. (Backtest)
- Data. Load prices and reference data from CSV or Excel files, a data store on disk, a Postgres database or Yahoo Finance, or generate a realistic synthetic market. Names in several currencies are converted with FX rates. (Data)
- Funds and derivatives. Index funds and ETFs with management fees; index and ETF futures and total return swaps, with pricing functions. (Funds, Derivatives)
- Optimisation and risk. Optimised indices and portfolios under constraints, covariance estimation with shrinkage, factor models, and risk contributions. (Optimiser, Risk model)
- Analysis and output. Return and risk attribution, concentration and drift, charts drawn from results, and PDF and Excel reports. (Attribution, Charts, Reports)
The local server
py-beacon also runs as a local API server, which is how the Beacon desktop app uses it. This generates a synthetic dataset and serves it:
pip install "py-beacon-kit[server]"
python -m beacon.synthetic --seed 42
python -m beacon.server --port 0 --token dev
See the server guide and serving data.
Versioning
py-beacon follows Semantic Versioning. Before 1.0 the API is still settling: a breaking change raises the minor version (0.1 to 0.2), and additions and fixes raise the patch. The full policy is in CONTRIBUTING.md.
Contributing
See CONTRIBUTING.md for setting up a development install, the checks every change must pass, and the release process.
py-beacon is released under the MIT licence.
1 maintainer

Metadata
1 maintainer
Release files for py-beacon-kit 0.9.0
For a detailed explanation of source distributions (sdists) and built distributions (wheels), please see the package formats documentation.
Source distribution (sdist)
| File | Size | Uploaded | |
|---|---|---|---|
| py_beacon_kit-0.9.0.tar.gz | 3.8 MB | Details |
Built distribution (wheel)
| File | Interpreter | ABI | Platform | Reset |
|---|---|---|---|---|
| py_beacon_kit-0.9.0-py3-none-any.whl | Python 3 | none | any | Details |
Total release size: 5.4 MB
Release files / py_beacon_kit-0.9.0.tar.gz
| Download URL | py_beacon_kit-0.9.0.tar.gz |
|---|---|
| Size | 3.8 MB |
| Tags | Source |
|
SHA-256 checksum How to use checksums |
4dc186a3b0265580161dc65ebaee6966f948f2160fd729a6f0e3ac6af2c0cb61
|
|
BLAKE2b-256 checksum How to use checksums |
6fdd2d1f4982bea728ccf41d21a355386cd8ba19ba1534326c01a3dce55bfa4b
|
| Upload date | |
|
Uploaded using Trusted Publishing? What is trusted publishing? |
Yes |
| Uploaded via |
twine/7.0.0 CPython/3.13.14
|
Provenance
Provenance describes where a file came from. On PyPI, provenance is shared via attestations, which provide a verifiable record of the build or publishing details. View details, limitations and caveats.


PyPI Publish Attestation
PyPI verified that this artifact, at this checksum, originated from the publisher listed below.
Signed by GitHub Actions, verified by PyPI on Oct 16, 2026.
Transparency logRelease files / py_beacon_kit-0.9.0-py3-none-any.whl
| Download URL | py_beacon_kit-0.9.0-py3-none-any.whl |
|---|---|
| Size | 1.6 MB |
| Tags | Python 3 |
|
SHA-256 checksum How to use checksums |
3828d5692966a53dc50048841b9890d3fa0876ad619d4aa4c4bef1bac07ce721
|
|
BLAKE2b-256 checksum How to use checksums |
179642f025eb2becfa24bd5d48831de1115de789aea1b12a5f5b63a1019f6f56
|
| Upload date | |
|
Uploaded using Trusted Publishing? What is trusted publishing? |
Yes |
| Uploaded via |
twine/7.0.0 CPython/3.13.14
|
Provenance
Provenance describes where a file came from. On PyPI, provenance is shared via attestations, which provide a verifiable record of the build or publishing details. View details, limitations and caveats.
PyPI Publish Attestation
PyPI verified that this artifact, at this checksum, originated from the publisher listed below.
Signed by GitHub Actions, verified by PyPI on Oct 16, 2026.
Transparency log













