A library to measure your method, function execution time.

Project description
PY Profiler
A library to measure method, function or your restful api execution time.
Install
- Run
pip install py-profilerorpip3 install py-profilerto install this library
Usage
It comes with a really easy api to use, you can add profiler(name = None) decorator to any method or function you want
to measure its execution time.
E.g:
from py_profiler import profiler, profiling_service


@profiler('hello')
def hello():
    print('hello')


class Foo:

    @profiler('Food.some_thing')
    def some_thing(self):
        print('some_thing')

    # By default, profiler name is f'{class_name}.{method_name}'
    @profiler()
    def method_2(self):
        print('method_2')
Access Profiler
There are 3 ways to access the profiler:
- View as a raw table in the console.
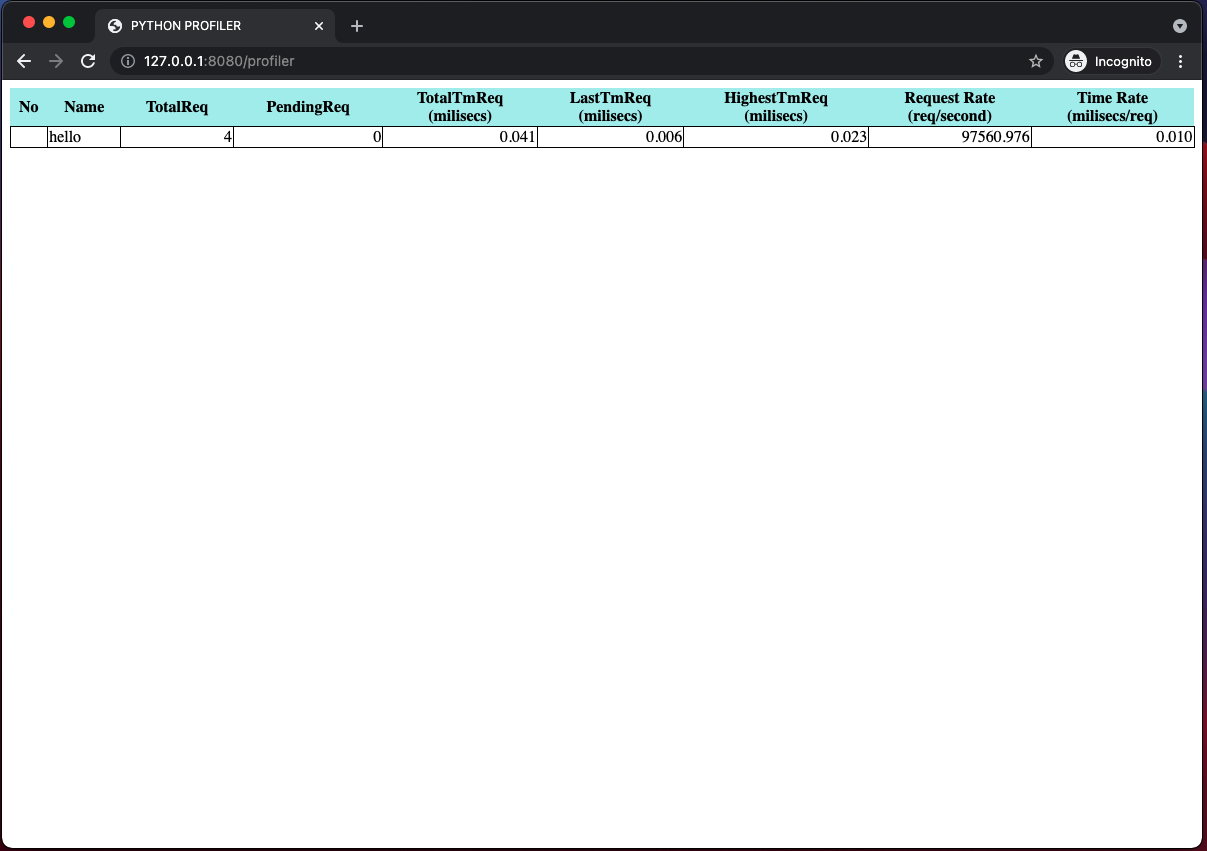
- View as a HTML page using a provided Flask blueprint.
- Integrate with your own RESTFul framework.
- Exec time is in milliseconds
- View as a table
from py_profiler import profiling_service

print(profiling_service.as_table())
| No | Name | Total Req | Pending Req | Total Exec Time | Last Exec Time | Highest Exec Time | Request Rate (req/sec) | Avg Time/Request (millis/req) |
|---|---|---|---|---|---|---|---|---|
| 1 | Foo.method_2 | 1 | 0 | 0.014 | 0.014 | 0.014 | 71428.571 | 0.014 |
| 2 | Food.some_thing | 1 | 0 | 0.011 | 0.011 | 0.011 | 90909.091 | 0.011 |
| 3 | hello | 1 | 0 | 0.031 | 0.031 | 0.031 | 32258.065 | 0.031 |
- Integrate with FastAPI
- If you are using FastAPI to implement your Restful API. You can add
profiler_routerto your FastAPI app.
E.g:
from fastapi import FastAPI
from py_profiler.fastapi_profiler_controller import profiler_router

app = FastAPI()
app.include_router(profiler_router)
Then you can access the profiler page at: http://127.0.0.1:8080/profiler
- Integrate with Flask
- If you are using Flask to implement your Restful API. You can add
profiler_blueprintto your Flash app.
E.g:
from flask import Flask
from waitress import serve
from py_profiler.profiler_controller import profiler_blueprint

app = Flask(__name__)
app.register_blueprint(profiler_blueprint)

serve(
    app,
    host="0.0.0.0",
    port=8080
)
Then you can access the profiler page at: http://127.0.0.1:8080/profiler
- Integrate with 3rd restful library.
You can build your custom profiler viewer by using as_html()
from py_profiler import profiling_service

html_page = profiling_service.as_html()
Then, you can implement a html page and return this html_page to your client to see profiler viewer.
Release history Release notifications | RSS feed


Download files
Download the file for your platform. If you're not sure which to choose, learn more about installing packages.
Source Distribution
Built Distribution
Filter files by name, interpreter, ABI, and platform.
If you're not sure about the file name format, learn more about wheel file names.
Copy a direct link to the current filters
File details
Details for the file py_profiler-0.3.1.tar.gz.
File metadata
- Download URL: py_profiler-0.3.1.tar.gz
- Upload date:
- Size: 8.0 kB
- Tags: Source
- Uploaded using Trusted Publishing? No
- Uploaded via: twine/4.0.2 CPython/3.8.9
File hashes
| Algorithm | Hash digest | |
|---|---|---|
| SHA256 |
cc3b7a3f8c04c17f9776a03878a9ed47d243f84102c7dfa54016c8a69b86c427
|
|
| MD5 |
4132146fdd4db70922d4bc0a1cd68088
|
|
| BLAKE2b-256 |
05b9f492f752229834ea6b07fb0d9310a58d7e131dff02a2bd3dcfe21c162ff1
|
File details
Details for the file py_profiler-0.3.1-py3-none-any.whl.
File metadata
- Download URL: py_profiler-0.3.1-py3-none-any.whl
- Upload date:
- Size: 8.2 kB
- Tags: Python 3
- Uploaded using Trusted Publishing? No
- Uploaded via: twine/4.0.2 CPython/3.8.9
File hashes
| Algorithm | Hash digest | |
|---|---|---|
| SHA256 |
62a3101fa45f2d7b37abfc706e3820c0137a36e6474139126631964ef3ea2cdb
|
|
| MD5 |
f51973783e1ef15e52dba1c20ac06b39
|
|
| BLAKE2b-256 |
e3ced9dcea5e948c4281fb142d3eb0e09da8b4a82d017f6a0ccafca184e85a1f
|


