Wrapper for the public UNHCR API, with built-in functions to make things easier

Project description
UNHCR Wrapper
This is a wrapper for the UNHCR API. It is written in Python and uses the requests library to make HTTP requests to the API.
Installation
You can install the package using pip:
pip install py-unhcr
Usage
To use the wrapper, you need to import the UNHCR class and create an instance of it. You can then use the methods provided by the class to interact
with the API. Here is an example:
from py_unhcr import UNHCR

# Create an instance of the UNHCR class
unhcr = UNHCR()

# Get asylum applicants from Afghanistan in 2020 and return the data as a DataFrame
data = unhcr.set_filter(coo="AFG", year_from=2020).asylum_applications(dataframe=True)
Using @dataframe decorator
The @dataframe decorator can be used to automatically convert the response data to a pandas DataFrame. Here is an example:
from py_unhcr import UNHCR, dataframe

unhcr_client = UNHCR()


@dataframe
def get_data():
    data = unhcr_client.set_filter(coo="VEN", year_from=2021).asylum_applications()
    return data


data = get_data()
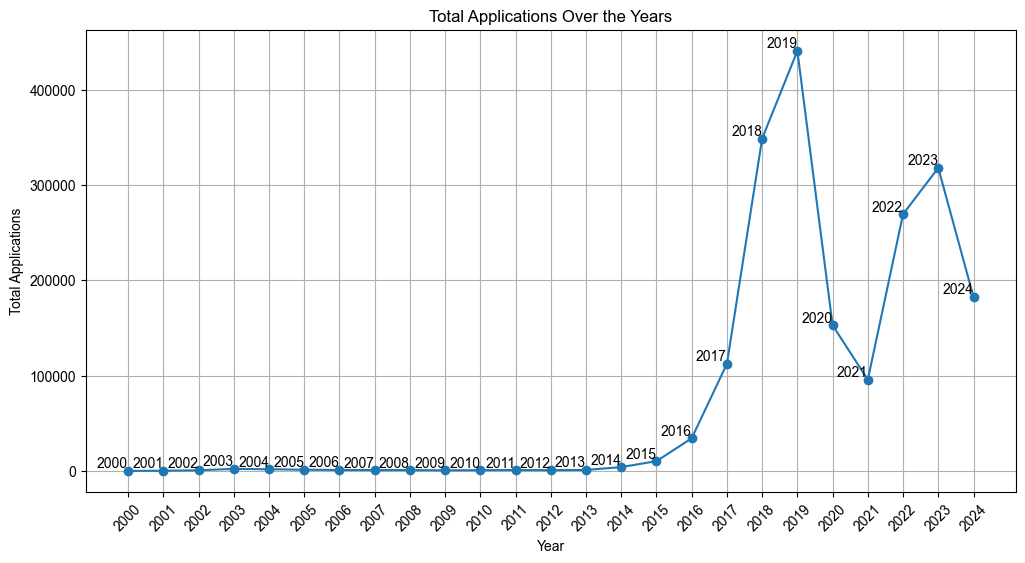
How to plot data
To plot the data, you can use matplotlib. Here is an example:
import matplotlib.pyplot as plt
from py_unhcr import UNHCR

unhcr_client = UNHCR()
unhcr = unhcr_client.set_filter(coo="VEN", year_from=2000, year_to=2024, coa_all=True).asylum_applications(
    dataframe=True)

# Group by year and sum the 'applied' values
yearly_data = unhcr.groupby('year')['applied'].sum()

# Create the plot
plt.figure(figsize=(12, 6))  # Increase figure size for better readability
yearly_data.plot(kind='line', marker='o')

# Title and labels
plt.title('Total Applications Over the Years')
plt.xlabel('Year')
plt.ylabel('Total Applications')

# Rotate x-axis labels for better readability
plt.xticks(rotation=45)

# Optional: Limit the number of x-axis labels to avoid crowding
plt.xticks(ticks=range(min(yearly_data.index), max(yearly_data.index) + 1, 1))

# Display year labels on each point
for x, y in zip(yearly_data.index, yearly_data):
    plt.text(x, y, str(x), fontsize=10, ha='right', va='bottom')

# Show the grid for better visibility
plt.grid(True)

# Show the plot
plt.show()
This would output a line plot showing the total number of applications over the years for the specified country.
This is a WIP
This project is a work in progress and more features will be added in the future. If you have any suggestions or feedback, feel free to open an issue or submit a pull request.
Release history Release notifications | RSS feed


Download files
Download the file for your platform. If you're not sure which to choose, learn more about installing packages.
Source Distribution
Built Distribution
Filter files by name, interpreter, ABI, and platform.
If you're not sure about the file name format, learn more about wheel file names.
Copy a direct link to the current filters
File details
Details for the file py_unhcr-0.1.2.tar.gz.
File metadata
- Download URL: py_unhcr-0.1.2.tar.gz
- Upload date:
- Size: 6.4 kB
- Tags: Source
- Uploaded using Trusted Publishing? No
- Uploaded via: twine/6.0.1 CPython/3.12.8
File hashes
| Algorithm | Hash digest | |
|---|---|---|
| SHA256 |
5e0fa38183a7a3bc2bb28253288b3516e96966a6406ba0c9461166b7c61dbbf2
|
|
| MD5 |
6e217be3166b7847eacb297ba0c1636d
|
|
| BLAKE2b-256 |
cac75433da483ff6fb449672a1c7aab712bc88a1a6cb7d17316a702203d3020b
|
File details
Details for the file py_unhcr-0.1.2-py3-none-any.whl.
File metadata
- Download URL: py_unhcr-0.1.2-py3-none-any.whl
- Upload date:
- Size: 6.5 kB
- Tags: Python 3
- Uploaded using Trusted Publishing? No
- Uploaded via: twine/6.0.1 CPython/3.12.8
File hashes
| Algorithm | Hash digest | |
|---|---|---|
| SHA256 |
cfdac0b0318d4cc5de821d9b76a931d568b57f99ddabbffe8c5416fe7229f31c
|
|
| MD5 |
07613258bc8697e080c279a72f63367a
|
|
| BLAKE2b-256 |
0ca10d3be9e313f8f01446a0bcaa042f6a058e835e514fd1eb2f63d64af91966
|


