Data import/export and EViews function calls from Python


Project description
The purpose of the py2eviews package is to make it easier for EViews and Python to talk to each other, so Python programmers can use the econometric engine of EViews directly from Python. This package uses COM to transfer data between Python and EViews. (For more information on COM and EViews, take a look at our whitepaper on the subject.)
Here’s a simple example going from Python to EViews. We’re going to use the popular Chow-Lin interpolation routine in EViews using data created in Python. Chow-Lin interpolation is a regression-based technique to transform low-frequency data (in our example, annual) into higher-frequency data (in our example, quarterly). It has the ability to use a higher-frequency series as a pattern for the interpolated series to follow. The quarterly interpolated series is chosen to match the annual benchmark series in one of four ways: first (the first quarter value of the interpolated series matches the annual series), last (same, but for the fourth quarter value), sum (the sum of the first through fourth quarters matches the annual series), and average (the average of the first through fourth quarters matches the annual series).
We’re going to create two series in Python using the time series functionality of the pandas package, transfer it to EViews, perform Chow-Lin interpolation on our series, and bring it back into Python. The data are taken from [BLO2001] in an example originally meant for Denton interpolation.
Install the py2eviews package using your method of choice. For example, head over to the py2eviews package at the Python Package Index and at a Windows command prompt:
$ pip install py2eviews
Or, download the package, navigate to your installation directory, and use:
$ python setup.py install
For more details on installation, see our whitepaper.
Start python and create two time series using pandas. We’ll call the annual series “benchmark” and the quarterly series “indicator”:
>>> import numpy as np
>>> import pandas as pa
>>> dtsa = pa.date_range('1998', periods = 3, freq = 'A')
>>> benchmark = pa.Series([4000.,4161.4,np.nan], index=dtsa, name = 'benchmark')
>>> dtsq = pa.date_range('1998q1', periods = 12, freq = 'Q')
>>> indicator = pa.Series([98.2, 100.8, 102.2, 100.8, 99., 101.6, 102.7, 101.5, 100.5, 103., 103.5, 101.5], index = dtsq, name = 'indicator')
Load the py2eviews package and create a custom COM application object so we can customize our settings. Set showwindow (which displays the EViews window) to True. Then call the PutPythonAsWF function to create pages for the benchmark and indicator series:
>>> import py2eviews as evp
>>> eviewsapp = evp.GetEViewsApp(instance='new', showwindow=True)
>>> evp.PutPythonAsWF(benchmark, app=eviewsapp)
>>> evp.PutPythonAsWF(indicator, app=eviewsapp, newwf=False)
Behind the scenes, py2eviews will detect if the DatetimeIndex of your pandas object (if you have one) needs to be adjusted to match EViews’ dating customs. Since EViews assigns dates to be the beginning of a given period depending on the frequency, this can lead to misalignment issues and unexpected results when calculations are performed. For example, a DatetimeIndex with an annual ‘A’ frequency and a date of 2000-12-31 will be assigned an internal EViews date of 2000-12-01. In this case, py2eviews will adjust the date to 2000-01-01 before pushing the data to EViews.
Name the pages of the workfile:
>>> evp.Run('pageselect Untitled', app=eviewsapp)
>>> evp.Run('pagerename Untitled annual', app=eviewsapp)
>>> evp.Run('pageselect Untitled1', app=eviewsapp)
>>> evp.Run('pagerename Untitled1 quarterly', app=eviewsapp)
Use the EViews copy command to copy the benchmark series in the annual page to the quarterly page, using the indicator series in the quarterly page as the high-frequency indicator and matching the sum of the benchmarked series for each year (four quarters) with the matching annual value of the benchmark series:
>>> evp.Run('copy(rho=.7, c=chowlins) annual\\benchmark quarterly\\benchmarked @indicator indicator', app=eviewsapp)Bring the new series back into Python:
>>> benchmarked = evp.GetWFAsPython(app=eviewsapp, pagename= 'quarterly', namefilter= 'benchmarked')
>>> print(benchmarked)
                BENCHMARKED
    1998-01-01   867.421429
    1998-04-01  1017.292857
    1998-07-01  1097.992857
    1998-10-01  1017.292857
    1999-01-01   913.535714
    1999-04-01  1063.407143
    1999-07-01  1126.814286
    1999-10-01  1057.642857
    2000-01-01  1000.000000
    2000-04-01  1144.107143
    2000-07-01  1172.928571
    2000-10-01  1057.642857
Release the memory allocated to the COM process (this does not happen automatically in interactive mode):
>>> eviewsapp.Hide()
>>> eviewsapp = None
>>> evp.Cleanup()
Note that if you choose not to create a custom COM application object (the GetEViewsApp function), you won’t need to use the first two lines in the last step. You only need to call Cleanup(). If you create a custom object but choose not to show it, you won’t need to use the first line (the Hide() function).
If you want, plot everything to see how the interpolated series follows the indicator series:
>>> # load the matplotlib package to plot
    import matplotlib.pyplot as plt
>>> # reindex the benchmarked series to the end of the quarter so the dates match those of the indicator series
    benchmarked_reindexed = pa.Series(benchmarked.values.flatten(), index = benchmarked.index + pa.DateOffset(months = 3, days = -1))
>>> # plot
    fig, ax1 = plt.subplots()
    plt.xticks(rotation=70)
    ax1.plot(benchmarked_reindexed, 'b-', label='benchmarked')
    # multiply the indicator series by 10 to put it on the same axis as the benchmarked series
    ax1.plot(indicator*10, 'b--', label='indicator*10')
    ax1.set_xlabel('dates')
    ax1.set_ylabel('indicator & interpolated values', color='b')
    ax1.xaxis.grid(True)
    for tl in ax1.get_yticklabels():
        tl.set_color('b')
    plt.legend(loc='lower right')
    ax2 = ax1.twinx()
    ax2.set_ylim([3975, 4180])
    ax2.plot(benchmark, 'ro', label='benchmark')
    ax2.set_ylabel('benchmark', color='r')
    for tl in ax2.get_yticklabels():
        tl.set_color('r')
    plt.legend(loc='upper left')
    plt.title("Chow-Lin interpolation: \nannual sum of benchmarked = benchmark", fontsize=14)
    plt.show()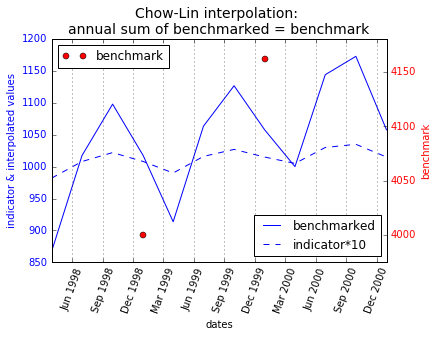
For more information on the py2eviews package, including a list of functions, please take a look at our whitepaper on the subject.
References
Bloem, A.M, Dippelsman, R.J. and Maehle, N.O. 2001 Quarterly National Accounts Manual - Concepts, Data Sources, and Compilation. IMF. http://www.imf.org/external/pubs/ft/qna/2000/Textbook/index.htm
Requirements
EViews, of course
comtypes, numpy, and pandas
Release history Release notifications | RSS feed


Download files
Download the file for your platform. If you're not sure which to choose, learn more about installing packages.
Source Distribution
Built Distribution
Filter files by name, interpreter, ABI, and platform.
If you're not sure about the file name format, learn more about wheel file names.
Copy a direct link to the current filters
File details
Details for the file py2eviews-1.0.8.tar.gz.
File metadata
- Download URL: py2eviews-1.0.8.tar.gz
- Upload date:
- Size: 53.6 kB
- Tags: Source
- Uploaded using Trusted Publishing? No
- Uploaded via: twine/6.2.0 CPython/3.14.0
File hashes
| Algorithm | Hash digest | |
|---|---|---|
| SHA256 |
9cb153acbdac0efb3ff3a613a13bb95856c39e6a1f5662d1801487e4fc77a8ff
|
|
| MD5 |
0edd558786954077f54674d79503099f
|
|
| BLAKE2b-256 |
f180494e04654996a3f359e114f625de078c6dfacdd0e0e61a44db64355ebfbe
|
File details
Details for the file py2eviews-1.0.8-py3-none-any.whl.
File metadata
- Download URL: py2eviews-1.0.8-py3-none-any.whl
- Upload date:
- Size: 11.5 kB
- Tags: Python 3
- Uploaded using Trusted Publishing? No
- Uploaded via: twine/6.2.0 CPython/3.14.0
File hashes
| Algorithm | Hash digest | |
|---|---|---|
| SHA256 |
3d7a5f15d00940492381003a5c5a69475f0dd1ef8029476e1c92ccfba6ad0263
|
|
| MD5 |
e6a1bf627aa36970dba8403fb09fee07
|
|
| BLAKE2b-256 |
9cfaf9b24710b261a30128ba8512ff33ff7488fd6a1e2bc3ebbaa71e29e443cb
|


