Decision tree visualization

Project description
pybaobabdt Package
The pybaobabdt package provides a python implementation for the visualization of decision trees. The technique is based on the scientific paper BaobabView: Interactive construction and analysis of decision trees developed by the TU/e. A typical decision tree is visualized using a standard node link diagram:
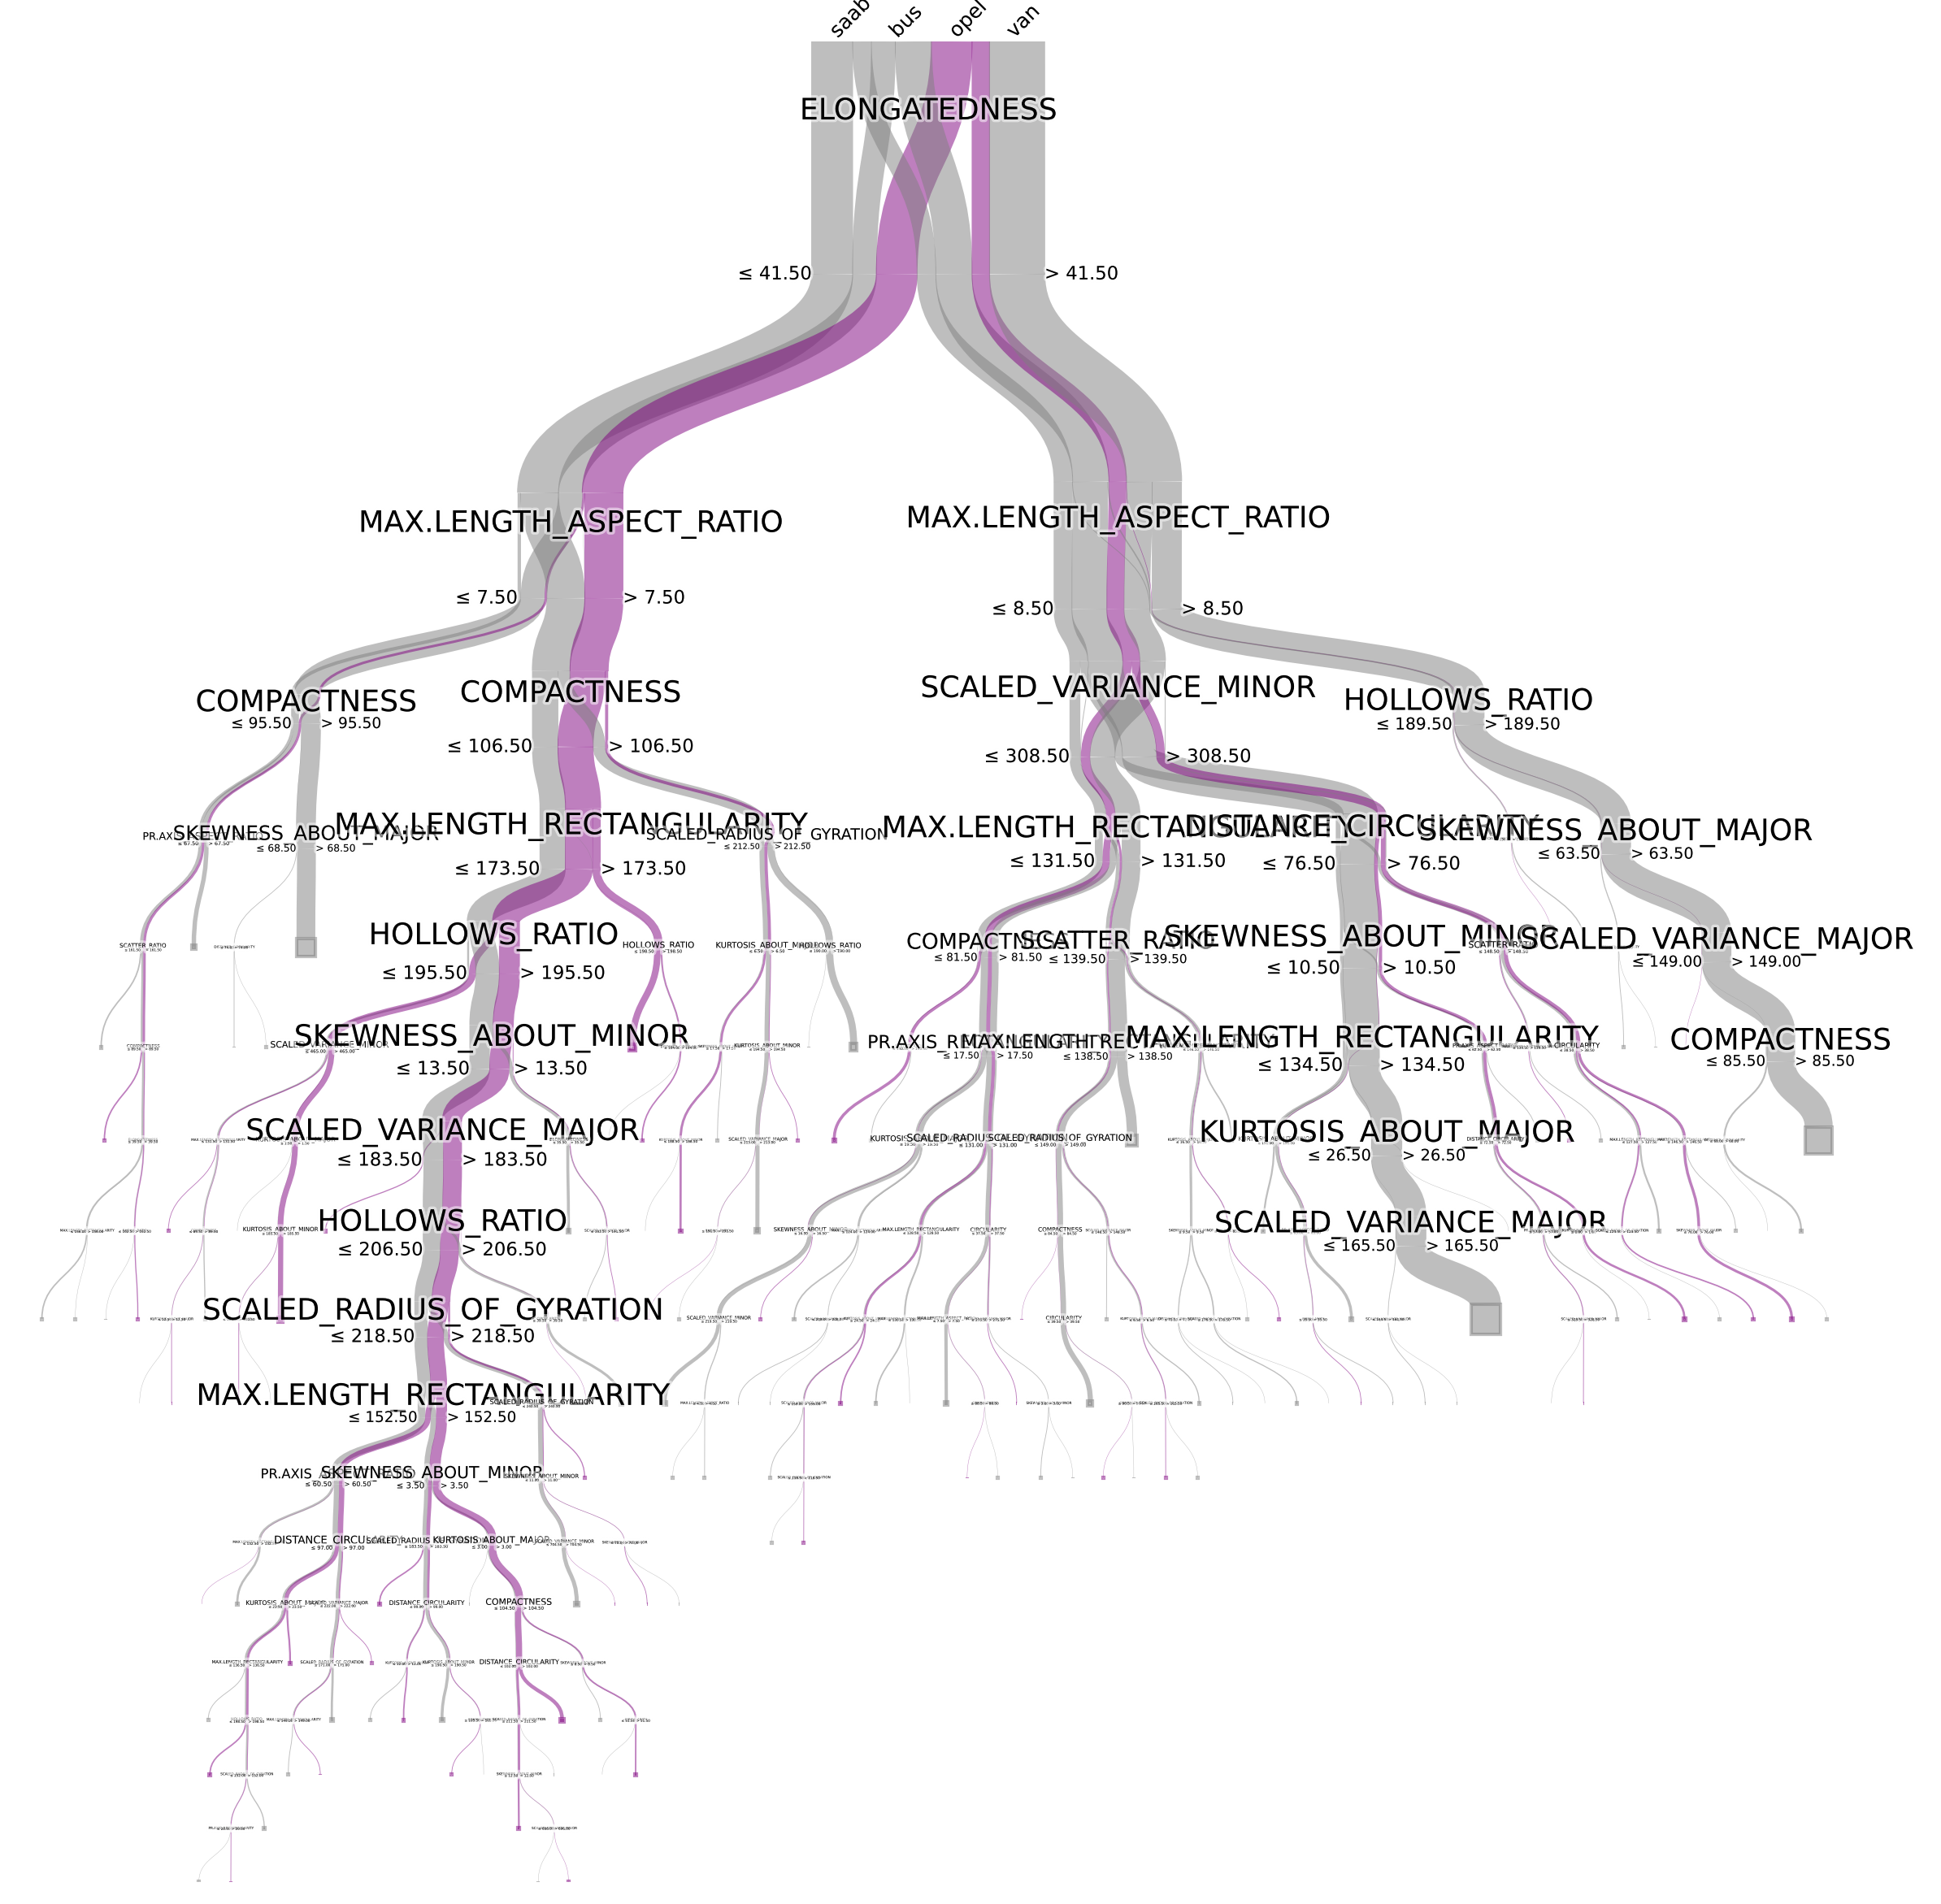
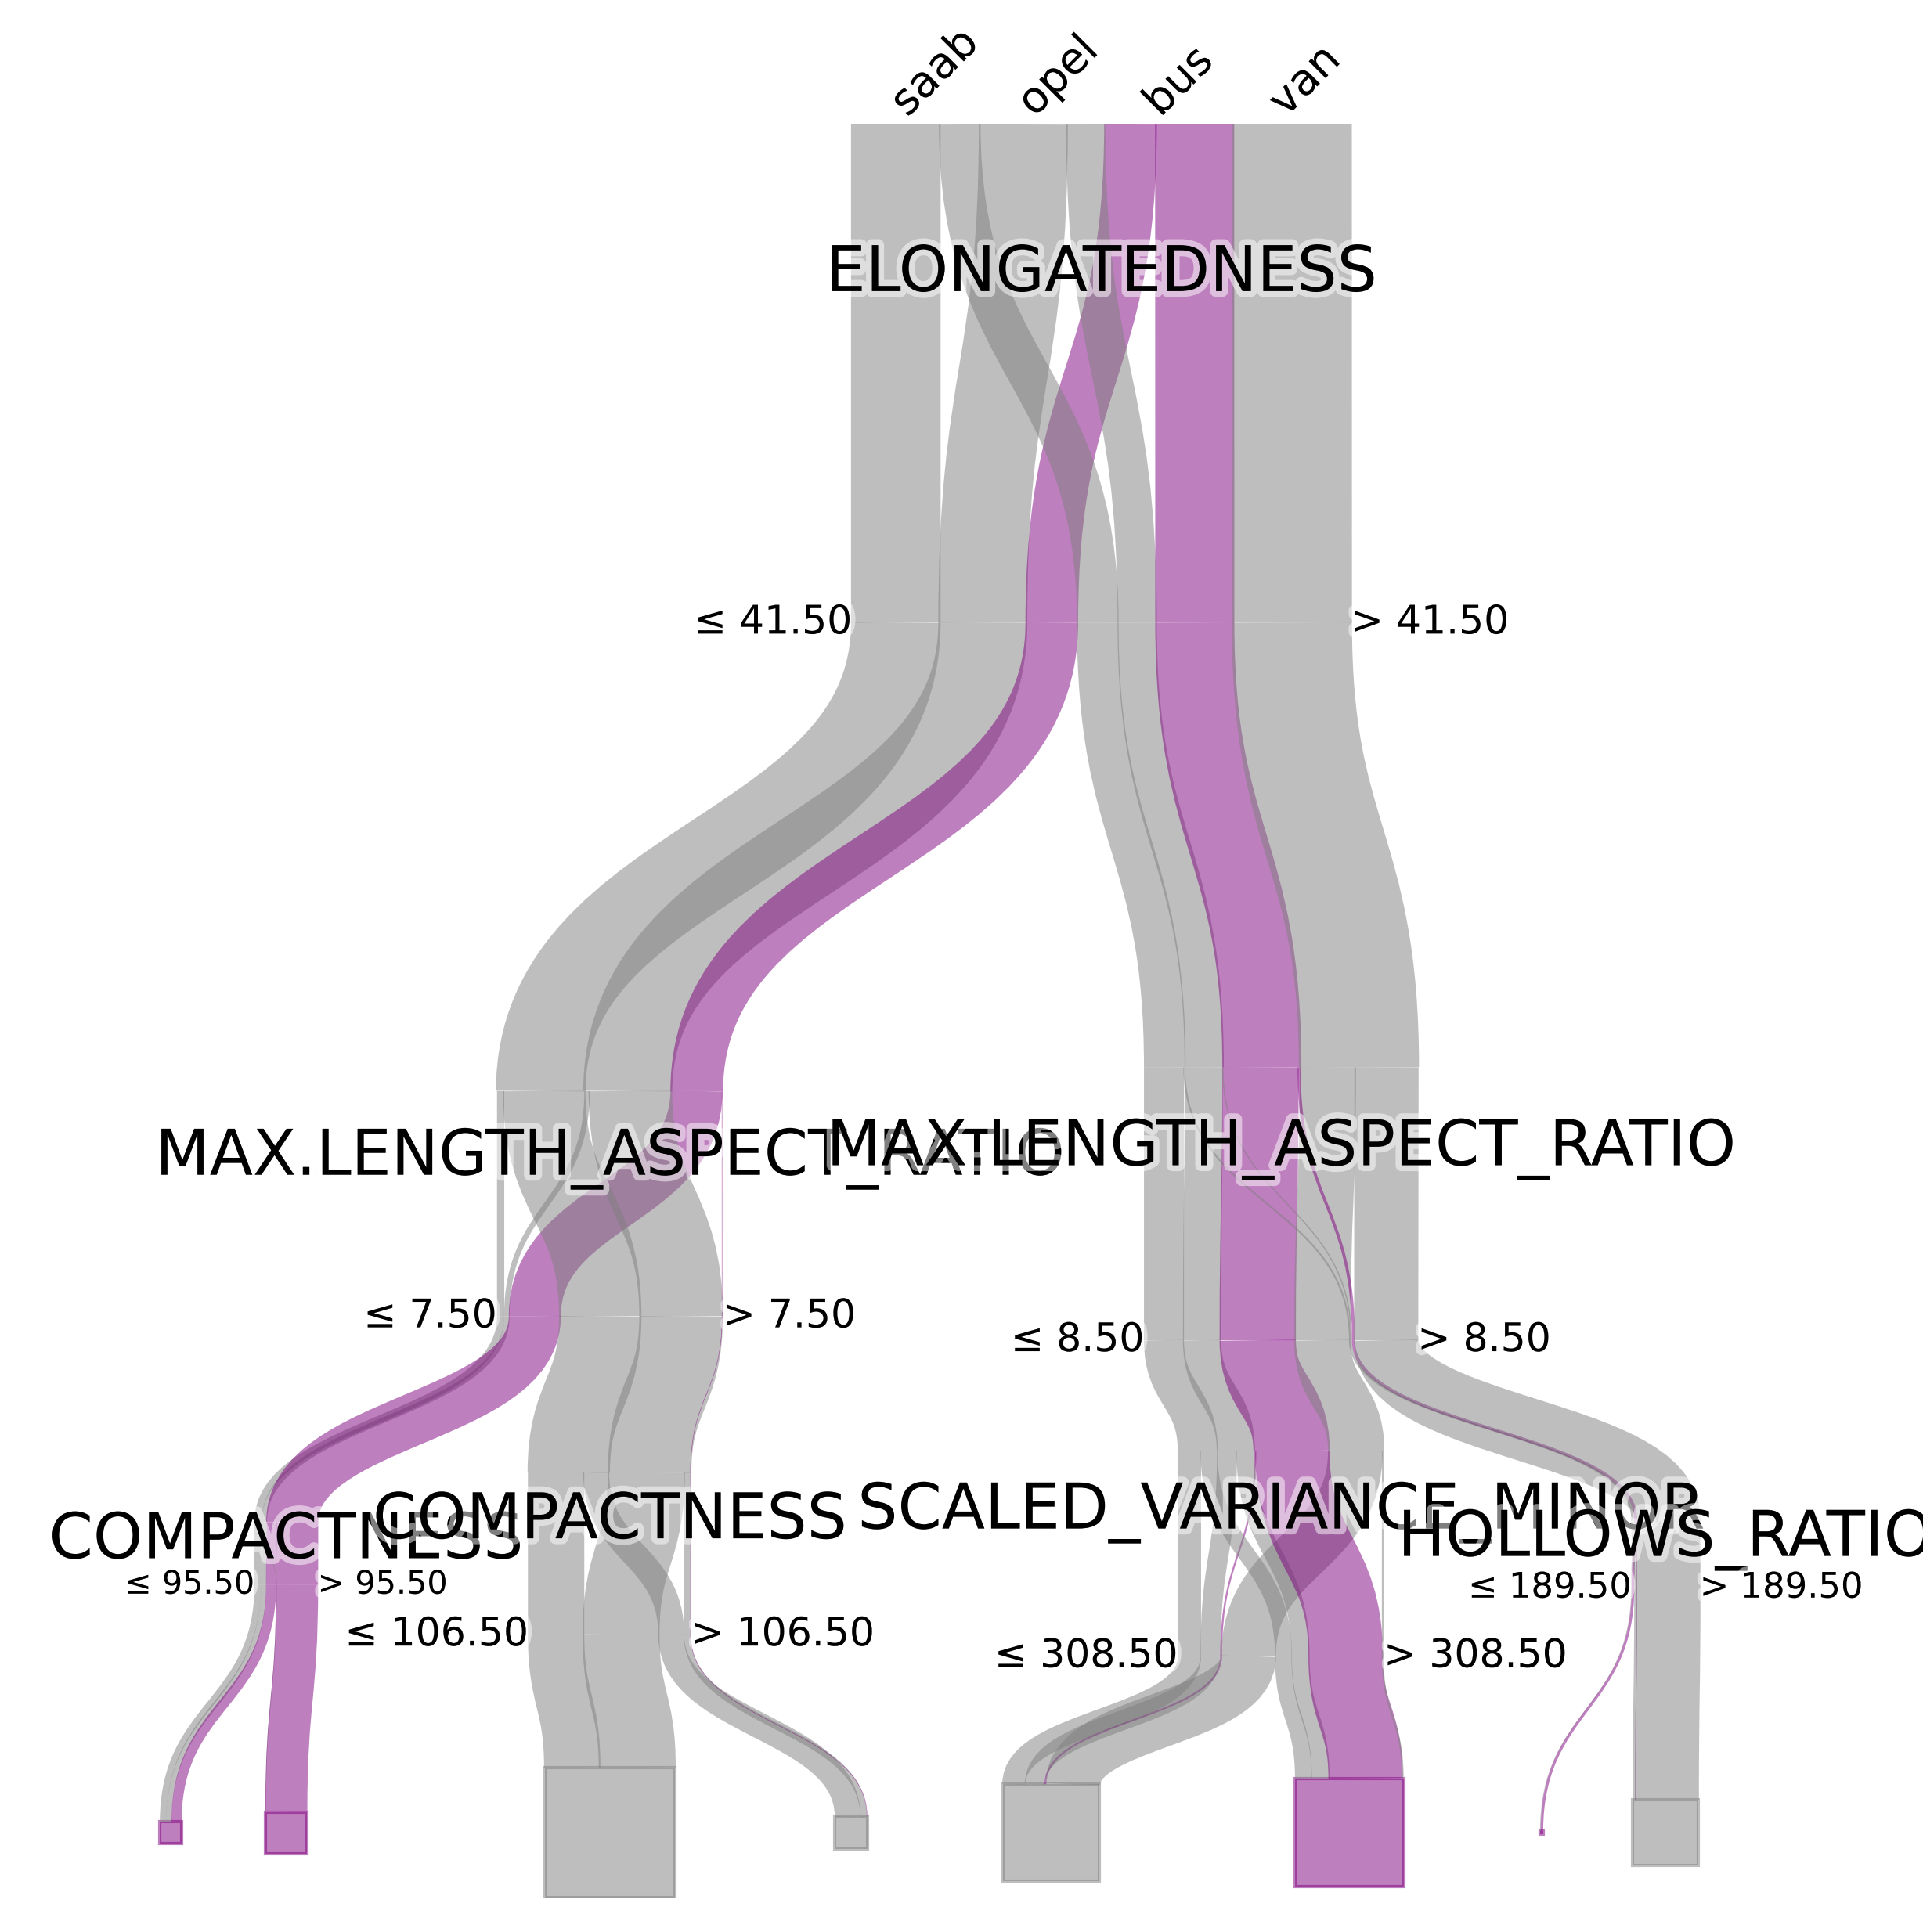
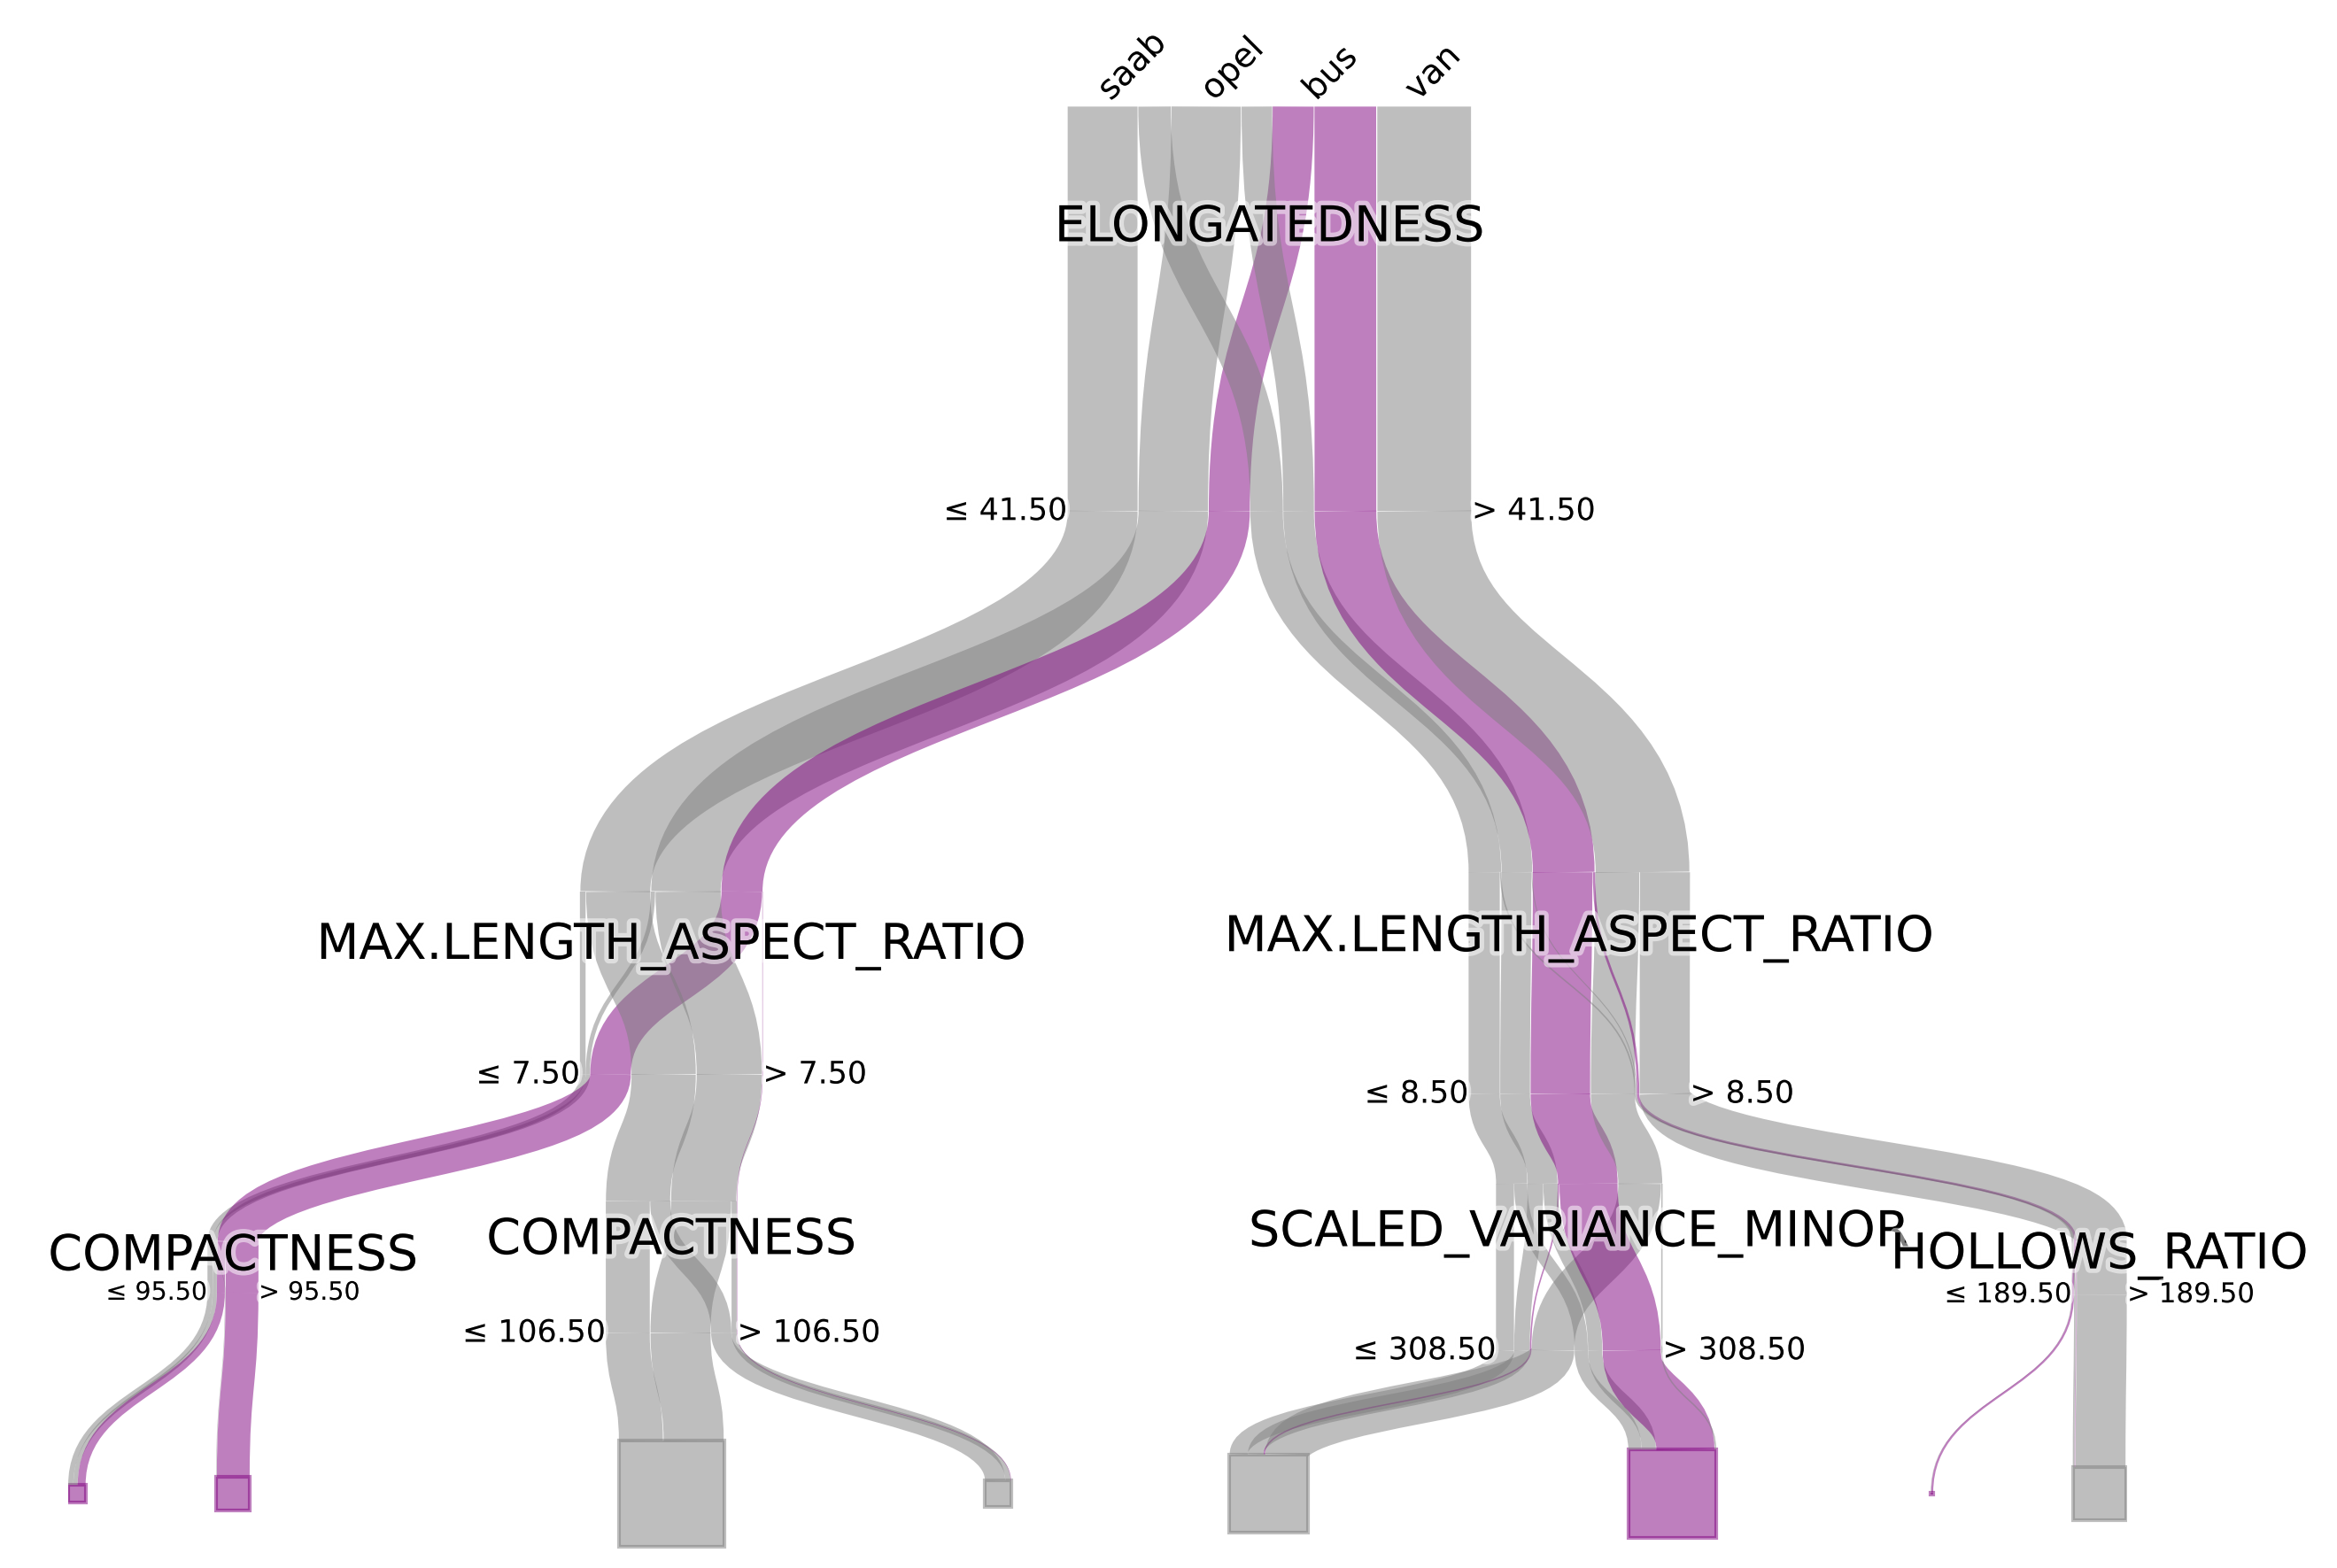
The problem, however, is that information is not easily extracted from this. Which classes are easy to separate for example, which classes are similar, where does the main flow of items go etc. Therefore, we developed techniques to answer these questions with a scalable visualization:
Note, this is the same decision tree as the standard node-link diagram above. Each class is represented by a color, the width of the link represents the number of items flowing from one node to the other.
Installation
Currently it is supported on Python3.6 onwards. The package can be installed through pip:
$ pip install pybaobabdt
Requirements
This implementation requires Graphviz. Graphviz can be installed using:
$ sudo apt-get install graphviz graphviz-dev
Furthermore it depends on the following python packages (sklearn, numpy, pygraphviz, matplotlib, scipy, pandas), which can be installed through pip:
$ python3 -m pip install -r requirements.txt
Usage
The following example illustrates the ease of use of this package. First build (or load) a decision tree classifier with sklearn:
import pybaobabdt
import pandas as pd
from scipy.io import arff
from sklearn.tree import DecisionTreeClassifier

data = arff.loadarff('winequality-red.arff')
df   = pd.DataFrame(data[0])

y = list(df['class'])
features = list(df.columns)
features.remove('class')
X = df.loc[:, features]

clf = DecisionTreeClassifier().fit(X,y)
Next, use pybaobab to visualize it:
ax = pybaobabdt.drawTree(clf, size=10, dpi=72, features=features)
You can then save it to a file with for example:
ax.get_figure().savefig('tree.png', format='png', dpi=300, transparent=True)
Also, trees from a RandomForest classifier can be visualized and saved to a high-resolution image for inspection:
import pybaobabdt
import pandas as pd
from scipy.io import arff
import matplotlib.pyplot as plt
from sklearn.ensemble import RandomForestClassifier

data = arff.loadarff('vehicle.arff')

df = pd.DataFrame(data[0])
y = list(df['class'])
features = list(df.columns)
features.remove('class')
X = df.loc[:, features]

clf = RandomForestClassifier(n_estimators=20, n_jobs=-1, random_state=0)
clf.fit(X, y)
Save to image:
size = (15,15)
plt.rcParams['figure.figsize'] = size
fig = plt.figure(figsize=size, dpi=300)

for idx, tree in enumerate(clf.estimators_):
    ax1 = fig.add_subplot(5, 4, idx+1)
    pybaobabdt.drawTree(tree, model=clf, size=15, dpi=300, features=features, ax=ax1)

fig.savefig('random-forest.png', format='png', dpi=1200, transparent=True)
Options
There are several different options that can be used in the drawTree function.
- colormap='plasma' (all matplotlib colormaps are supported)
You can also define your own colormap, which could be useful to highlight a specific class for example:
#colors = [[1,0,0], [0,1,0], [0,0,1], [1,1,0]]
colors = ["gray", "gray", "purple", "gray"]
colorMap = ListedColormap(colors)

ax = pybaobabdt.drawTree(clf, size=10, dpi=72, features=features, colormap=colorMap)
- maxdepth=3 (set the maximum depth of the tree to render, this can be useful for large trees, to inspect only the top splits.)
- ratio=0.5 (sets the aspect ratio of the tree, default = 1)
Note that examples can be found in the 'notebooks' folder containing jupyter notebook examples.
License
GNU General Public License v3.0
Reference
If you need to reference this work please use the following bibtex entry:
@INPROCEEDINGS{Elzen2011,
  author={van den Elzen, Stef and van Wijk, Jarke J.},
  booktitle={2011 IEEE Conference on Visual Analytics Science and Technology (VAST)},
  title={BaobabView: Interactive construction and analysis of decision trees},
  year={2011},
  pages={151-160},
  doi={10.1109/VAST.2011.6102453}}
S. van den Elzen and J. J. van Wijk, "BaobabView: Interactive construction and analysis of decision trees," 2011 IEEE Conference on Visual Analytics Science and Technology (VAST), 2011, pp. 151-160, doi: 10.1109/VAST.2011.6102453.
Release history Release notifications | RSS feed

Download files
Download the file for your platform. If you're not sure which to choose, learn more about installing packages.
Source Distribution
Built Distribution
Filter files by name, interpreter, ABI, and platform.
If you're not sure about the file name format, learn more about wheel file names.
Copy a direct link to the current filters
File details
Details for the file pybaobabdt-1.0.1.tar.gz.
File metadata
- Download URL: pybaobabdt-1.0.1.tar.gz
- Upload date:
- Size: 22.5 kB
- Tags: Source
- Uploaded using Trusted Publishing? No
- Uploaded via: twine/3.6.0 importlib_metadata/4.8.2 pkginfo/1.8.1 requests/2.22.0 requests-toolbelt/0.9.1 tqdm/4.62.3 CPython/3.8.10
File hashes
| Algorithm | Hash digest | |
|---|---|---|
| SHA256 |
e09451dd655b7df43cc4b50749338bb1a4f481f15f60550f3b09df86b6dbd65b
|
|
| MD5 |
d360fd9f20a1678c4da2fbfebbcda183
|
|
| BLAKE2b-256 |
dd7684690c00b68b92c13895bee09fc96407db1919eefa5ac3a11d81f76028d8
|
File details
Details for the file pybaobabdt-1.0.1-py3-none-any.whl.
File metadata
- Download URL: pybaobabdt-1.0.1-py3-none-any.whl
- Upload date:
- Size: 20.5 kB
- Tags: Python 3
- Uploaded using Trusted Publishing? No
- Uploaded via: twine/3.6.0 importlib_metadata/4.8.2 pkginfo/1.8.1 requests/2.22.0 requests-toolbelt/0.9.1 tqdm/4.62.3 CPython/3.8.10
File hashes
| Algorithm | Hash digest | |
|---|---|---|
| SHA256 |
cde1f30349929fe67f56ea658381c911094c6c812f5eb5ed2ce05151da46325b
|
|
| MD5 |
b51f61111134f2a95c9b3337a33d64db
|
|
| BLAKE2b-256 |
a327829808b105e74311c8963419ee0b41856ce7229e1ecfb2cdf01ee6fbbb5b
|


