A Bibliometric and Scientometric Library Powered with Artificial Intelligence Tools

Project description
Citation
PEREIRA, V.; BASILIO, M.P.; SANTOS, C.H.T. (2025). PyBibX: A Python Library for Bibliometric and Scientometric Analysis Powered with Artificial Intelligence Tools. Data Technologies and Applications. Vol. 59, Iss. 2, pp. 302-337. doi: https://doi.org/10.1108/DTA-08-2023-0461
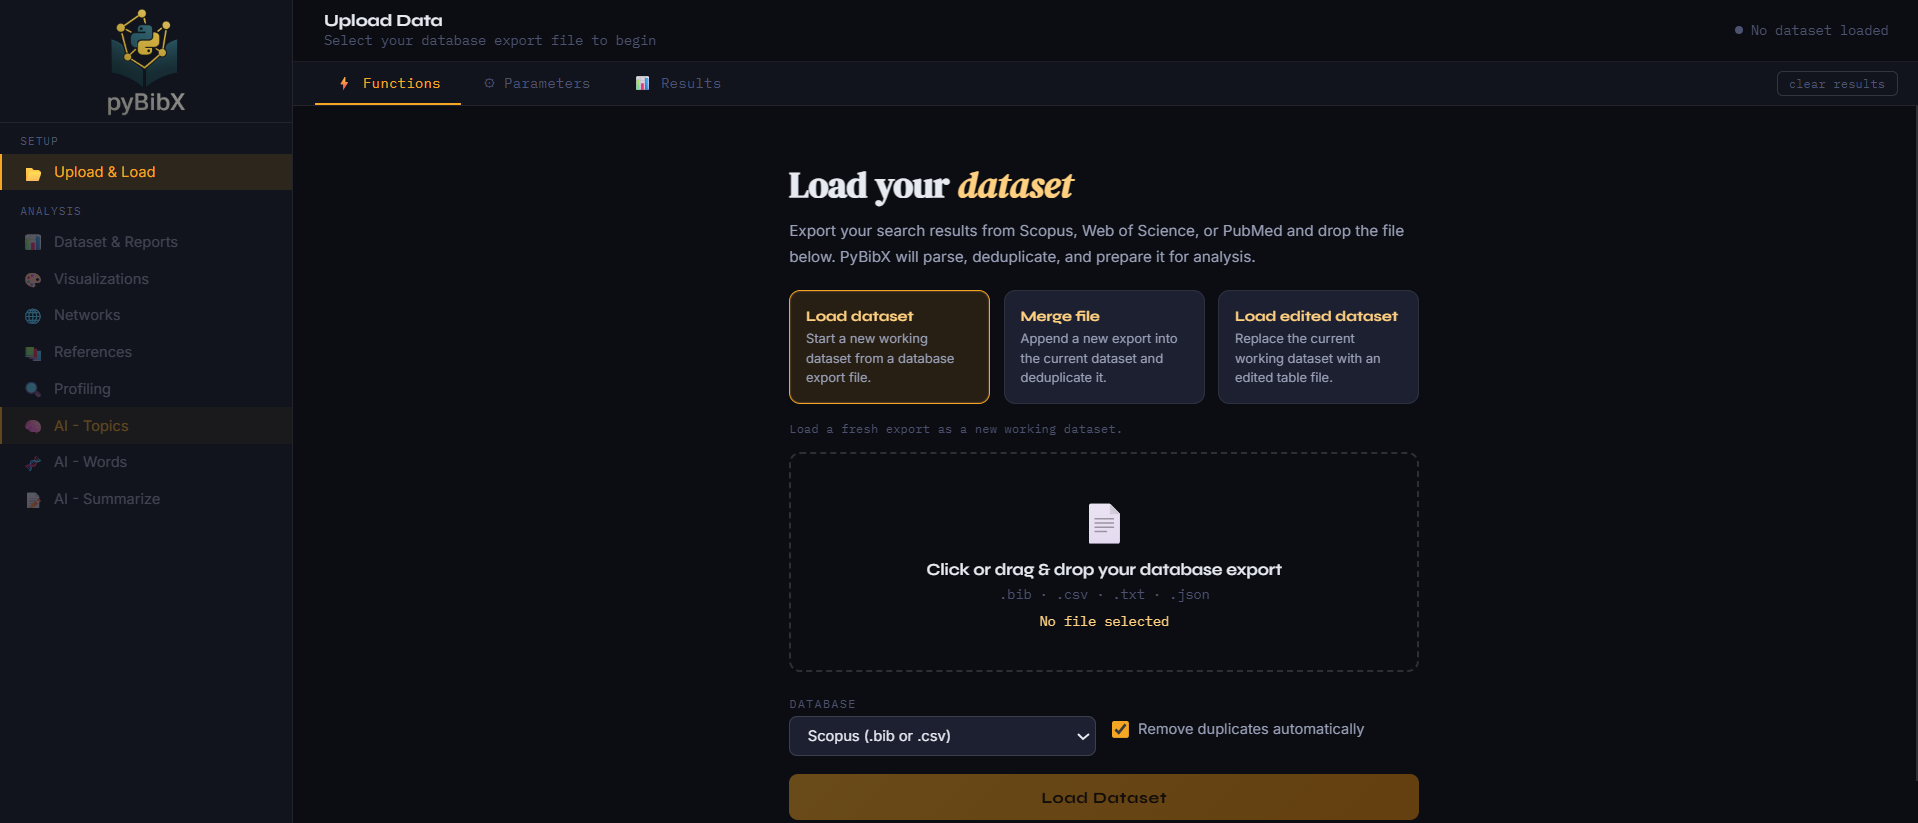
pybibx Web App
New to Python or prefer a graphical interface? The pybibx Web App lets you run your analysis in clicks, not lines of code.
import pybibx

# Start the web service using:
pybibx.web_app()

# Terminate the web service using:
pybibx.web_stop()
This Google Colab Demo is intended for quick demos only. For the best experience, run the Web UI locally or open it directly in a full browser.
Introduction
A Bibliometric and Scientometric python library that uses the raw files generated by Scopus (.bib files or .csv files), WOS (Web of Science) (.bib files), and PubMed (.txt files) scientific databases. Also, Powered with Advanced AI Technologies for Analyzing Bibliometric, Scientometric Outcomes, and Textual Data
To export the correct file formats from Scopus, Web of Science, and PubMed, follow these steps:
- a) Scopus: Search, select articles, click "Export" choose "BibTeX" or "CSV", select all fields, click "Export" again. When using the "CSV" format, the exported files will include the References for the articles
- b) WoS: Search, select articles, click "Export" choose "Save to Other File Formats" select "BibTeX" select all fields, click "Send"
- c) PubMed: Search, select articles, click "Save" choose "PubMed" format, click "Save" to download a .txt file. The exported files do not contain the References for the articles
General Capabilities:
- a) Works with Scopus (.bib files or .csv files), WOS (.bib files) and PubMed (.txt files) databases
- b) Identification and Removal of duplicates
- c) Identification of documents per type
- d) Generates a Health Report to evaluate the quality of the .bib/.csv file
- e) Generates an EDA (Exploratory Data Analysis) Report: Publications Timespan, Total Number of Countries, Total Number of Institutions, Total Number of Sources, Total Number of References, Total Number of Languages (and also the number of docs for each language), Total Number of Documents, Average Documents per Author, Average Documents per Institution, Average Documents per Source, Average Documents per Year, Total Number of Authors, Total Number of Authors Keywords, Total Number of Authors Keywords Plus, Total Single-Authored Documents, Total Multi-Authored Documents, Average Collaboration Index, Max H-Index, Total Number of Citations, Average Citations per Author, Average Citations per Institution, Average Citations per Document, Average Citations per Source
- f) Creates an ID (Identification) for each Document, Authors, Sources, Institutions, Countries, Authors' Keywords, Keywords Plus and References. The IDs can be used in graphs/plots to obtain a cleaner visualization
- g) Generates Profiling Functions that are a detailed summary (profile) for any selected entity: Authors, Sources, Institutions, Countries, Authors' Keywords, Keywords Plus and References. For each entity, the function aggregates key statistics and metadata, including the list of associated publications, total and average citations, time span of activity, and more.
- h) Creates an Authors's Metrics Table with H-Index, E-Index, G-Index, M-Index and J-Index
- i) Creates a WordCloud from the Abstracts, Titles, Authors Keywords or Keywords Plus
- j) Creates a N-Gram Bar Plot (interactive plot) from the Abstracts, Titles, Authors Keywords or Keywords Plus
- k) Creates a Projection (interactive plot) of the documents based on the Abstracts, Titles, Authors Keywords or Keywords Plus
- l) Creates an Evolution Plot (interactive plot) based on Abstracts, Titles, Sources, Authors Keywords or Keywords Plus
- m) Creates an Evolution Plot Complement (interactive plot) based on Abstracts, Titles, Sources, Authors Keywords or Keywords Plus
- n) Creates a Sankey Diagram (interactive plot) with any combination of the following keys: Authors, Countries, Institutions, Journals, Auhors_Keywords, Keywords_Plus, and/or Languages
- o) Creates a XY Bar Chart (interactive plot) that displays the count of a specified Y-key for each category defined by a specified X-key. The plot visualizes the distribution of entities such as Authors, Countries, Institutions, Journals, Authors_Keywords, Keywords_Plus, and/or Languages. For example, it can show how many Authors publications are associated with each Country
- p) Creates a XY Heatmap (interactive plot) that displays the count and papers' ID of a specified Y-key for each category defined by a specified X-key. The plot visualizes the distribution of entities such as Authors, Countries, Institutions, Journals, Authors_Keywords, Keywords_Plus, and/or Languages. For example, it can show how many Authors publications are associated with each Authors_Keywords and the papers associated to them.
- q) Creates a TreeMap (interactive plot) from the Authors, Countries, Institutions, Journals, Auhors_Keywords, or Keywords_Plus
- r) Creates an Authors Productivity Plot (interactive plot) It informs for each year the documents (IDs) published for each author
- s) Creates a Countries Productivity Plot (interactive plot) It informs for each year the documents (IDs) published for each country (each author's country)
- t) Creates a Institutions Productivity Plot (interactive plot) It informs for each year the documents (IDs) published for each institution (each author's institution)
- u) Creates a Sources Productivity Plot (interactive plot) It informs for each year the documents (IDs) published for each source (journal)
- v) Creates a Bar Plot (interactive plot) for the following statistics: Documents per Year, Citations per Year, Past Citations per Year, Lotka's Law, Sources per Documents, Sources per Citations, Authors per Documents, Authors per Citations, Authors per H-Index, Bradford's Law (Core Sources 1, 2 or 3), Institutions per Documents, Institutions per Citations, Countries per Documents, Countries per Citations, Language per Documents, Keywords Plus per Documents and Authors' Keywords per Documents
- w) Creates a Top Reference Plot (interactive plot) to visualize the top cited References
- x) Creates a Citation Trajectory Plot (interactive plot) that shows the yearly citation counts for each selected Reference
- y) Creates a Citation Matrix that shows for each Reference, which citing articles (with their publication years) mentioned that Reference, the Unique Reference ID, and the Reference's publication year
- z) Creates a RPYS-Reference Publication Year Spectroscopy (interactive plot) to visualize citation patterns over the years. Revealing the peaks in reference publication years (trough Gaussian Filters) that might indicate influential works or shifts in research trends
Network Capabilities:
- a) Creates a Top Reference Set Matrix, which, for a given group size n, identifies and returns the most frequently co-cited Reference groups of size n
- b) Creates a Reference Co-Citation Network (interactive plot) that visually displays the top n References that are most frequently cited together with a target Reference
- c) Collaboration Plot between Authors, Countries, Institutions, Authors' Keywords or Keywords Plus
- d) Computes Hubs & Authorities scores for papers in a citation network, and can also find the top-ranked nodes per decade.
- e) Identifies Sleeping Beauties papers that were uncited for a long time but later received sudden attention.
- f) Identifies the Princes of the Sleeping Beauties.
- g) Citation Analysis (interactive plot) between Documents (Blue Nodes) and Citations (Red Nodes). Documents and Citations can be highlighted for better visualization
- h) Collaboration Analysis (interactive plot) between Authors, Countries, Institutions or Adjacency Analysis (interactive plot) between Authors' Keywords or Keywords Plus. Collaboration and Adjacency can be highlighted for better visualization
- i) Similarity Analysis (interactive plot) can be performed using coupling or cocitation methods
- j) World Map Collaboration Analysis (interactive plot) between Countries in a Map
Artificial Intelligence Capabilities:
- a) Topic Modelling using BERTopic to cluster documents by topic
- b) Visualize topics distribution
- c) Visualize topics by the most representative words
- d) Visualize documents projection and clusterization by topic
- e) Visualize topics heatmap
- f) Visualize topics over time
- g) Find the most representative documents from each topic
- h) Find the most representative topics according to a word
- i) Find how each word in its abstract semantically aligns with all topics in the model
- j) Creates W2V Embeddings from Abstracts
- k) Find Documents based in words
- m) Calculates the cosine similarity between two words
- n) Make operations between W2V Embeddings
- o) Visualize W2V Embeddings operations
- p) Creates Sentence Embeddings from Abstracts, Titles, Authors Keywords or Keywords Plus
- q) Abstractive Text Summarization using PEGASUS on a set of selected documents or all documents
- r) Abstractive Text Summarization using chatGPT on a set of selected documents or all documents. Requires the user to have an API key (https://platform.openai.com/account/api-keys)
- s) Abstractive Text Summarization using Gemini on a set of selected documents or all documents. Requires the user to have an API key (https://ai.google.dev/gemini-api/)
- t) Extractive Text Summarization using BERT on a set of selected documents or all documents
- u) Ask chatGPT to analyze the following results: EDA Report, WordCloud, N-Grams, Evolution Plot, Sankey Diagram, Authors Productivity Plot, Countries Productivity Plot, Institutions Productivity Plot, Sources Productivity Plot, Bar Plots, Citation Analysis, Collaboration Analysis, Similarity Analysis, and World Map Collaboration Analysis (consult Example 08). Requires the user to have an API key (https://platform.openai.com/account/api-keys)
- v) Ask Gemini to analyze the following results: EDA Report, WordCloud, N-Grams, Evolution Plot, Sankey Diagram, Authors Productivity Plot, Countries Productivity Plot, Institutions Productivity Plot, Sources Productivity Plot, Bar Plots, Citation Analysis, Collaboration Analysis, Similarity Analysis, and World Map Collaboration Analysis (consult Example 09). Requires the user to have an API key (https://ai.google.dev/gemini-api/)
Correction and Manipulation Capabilities:
- a) Filter the .bib, .csv or .txt file by Year, Sources, Bradford Law Cores, Countries, Languages and/or Abstracts (Documents with Abstracts)
- b) Merge Authors, Institutions, Countries, Languages, Sources and/or References that have multiple entries
- c) Merge different or the same database files one at a time. The preference for information preservation is given to the old database, so the order of merging matters (consult Examples 04 and 05)
Usage
- Install
pip install pybibx
- Try it in Colab:
- Example 00: Web App -- No Code -- ( Colab Demo )
- Example 01: Scopus ( Colab Demo )
- Example 02: WOS ( Colab Demo )
- Example 03: PubMed ( Colab Demo )
- Example 04: Scopus + WOS ( Colab Demo )
- Example 05: WOS + Scopus ( Colab Demo )
- Example 06: Scopus + WOS + Pubmed ( Colab Demo )
- Example 07: Your Own ( Colab Demo )
- Example 08: Ask chatGPT Analysis ( Colab Demo )
- Example 09: Ask Gemini Analysis ( Colab Demo )
Acknowledgement
This section indicates the libraries that inspired pybibx
-
BERT (https://smrzr.io/):
a) Github: https://github.com/dmmiller612/bert-extractive-summarizer
b) Paper: DEREK, M. (2019). Leveraging BERT for Extractive Text Summarization on Lectures. arXiv. doi: https://doi.org/10.48550/arXiv.1906.04165
-
SciBERT (https://huggingface.co/allenai/scibert_scivocab_uncased):
a) Github: https://github.com/allenai/scibert
b) Paper: BELTAGY, I.;, LO, K.; COHAN, A. (2019). SCIBERT: A Pretrained Language Model for Scientific Text. arXiv. doi: https://doi.org/10.48550/arXiv.1903.10676
-
BERTopic (https://maartengr.github.io/BERTopic/index.html):
a) Github: https://github.com/MaartenGr/BERTopic
b) Paper: GROOTENDORST, M. (2022). BERTopic: Neural Topic Modeling with a Class-based TF-IDF Procedure. arXiv. doi: https://doi.org/10.48550/arXiv.2203.05794
-
Bibliometrix (https://www.bibliometrix.org/home/):
a) Github: https://github.com/massimoaria/bibliometrix
b) Paper: ARIA, M.; CUCCURULLO, C. (2017). Bibliometrix: An R-tool for Comprehensive Science Mapping Analysis. Journal of Informetrics, 11(4), 959-975. doi: https://doi.org/10.1016/j.joi.2017.08.007
-
Gemini (https://gemini.google.com/app):
a) Github: https://github.com/google-gemini
b) Paper: Gemini Team Google (2024). Gemini: A Family of Highly Capable Multimodal Models. arXiv. doi: https://arxiv.org/abs/2312.11805
-
Gensim (https://radimrehurek.com/gensim/):
a) Github: https://github.com/piskvorky/gensim
b) Paper: REHUREK, R.; SOJKA, P. (2010). Software Framework for Topic Modelling with Large Corpora. LREC 2010. doi: https://doi.org/10.13140/2.1.2393.1847
-
chatGPT (https://chat.openai.com/chat):
a) Github: https://github.com/openai
b) Paper: OPENAI. (2023). GPT-4 Technical Report. arXiv. doi: https://doi.org/10.48550/arXiv.2303.08774
-
Metaknowledge (http://www.networkslab.org/metaknowledge):
a) Github: https://github.com/UWNETLAB/metaknowledge
b) Paper: McILROY-YOUNG, R.; McLEVEY, J.; ANDERSON, J. (2015). Metaknowledge: Open Source Software for Social Networks, Bibliometrics, and Sociology of Knowledge Research.
-
SentenceTransformers (https://www.sbert.net/):
a) Github: https://github.com/UKPLab/sentence-transformers
b) Paper: REIMERS, N.; GUREVYCH, I. (2019). Sentence-BERT: Sentence Embeddings using Siamese BERT-Networks. arXiv. doi: https://arxiv.org/abs/1908.10084
-
PEGASUS (https://ai.googleblog.com/2020/06/pegasus-state-of-art-model-for.html?m=1):
a) Github: https://github.com/huggingface/transformers
b) Paper: ZHANG, J.; ZHAO, Y.; SALEH, M.; LIU, P.J. (2019). PEGASUS: Pre-training with Extracted Gap-sentences for Abstractive Summarization. arXiv. doi: https://doi.org/10.48550/arXiv.1912.08777
And to all the people who helped to improve or correct the code. Thank you very much!
- Fabio Ribeiro von Glehn (29.DECEMBER.2022) - UFG - Federal University of Goias (Brazil)


Download files
Download the file for your platform. If you're not sure which to choose, learn more about installing packages.
Source Distribution
Built Distribution
Filter files by name, interpreter, ABI, and platform.
If you're not sure about the file name format, learn more about wheel file names.
Copy a direct link to the current filters
File details
Details for the file pybibx-5.7.0.tar.gz.
File metadata
- Download URL: pybibx-5.7.0.tar.gz
- Upload date:
- Size: 172.3 kB
- Tags: Source
- Uploaded using Trusted Publishing? No
- Uploaded via: twine/6.2.0 CPython/3.10.9
File hashes
| Algorithm | Hash digest | |
|---|---|---|
| SHA256 |
316df1fe580ec8c6868823fd566ca78aef921d93d78bebad93171857befbbbbc
|
|
| MD5 |
0e5ab864cd7b7ab441302abc514a6eb3
|
|
| BLAKE2b-256 |
339cbfd279cee50ecb3bc1a824b7069084a410d3dc5b7c2665e99137c4859da8
|
File details
Details for the file pybibx-5.7.0-py3-none-any.whl.
File metadata
- Download URL: pybibx-5.7.0-py3-none-any.whl
- Upload date:
- Size: 167.6 kB
- Tags: Python 3
- Uploaded using Trusted Publishing? No
- Uploaded via: twine/6.2.0 CPython/3.10.9
File hashes
| Algorithm | Hash digest | |
|---|---|---|
| SHA256 |
5677dc5872e8547ccf8c9de3a042daec64089c20ab4b5256d425963d75e31c6e
|
|
| MD5 |
20cb1f6944366749e4731450ffb2264e
|
|
| BLAKE2b-256 |
6ece26a062dcad01b3f8dabb3185b31a15c93170f43191e385496056e8f498e6
|


