Observation Sequence Diagnostics for DART

Project description


pyDARTdiags
pyDARTdiags is a Python library for obsevation space diagnostics for the Data Assimilation Research Testbed (DART).
pyDARTdiags is under initial development, so please use caution. The MATLAB observation space diagnostics are available through DART.
pyDARTdiags can be installed through pip: https://pypi.org/project/pydartdiags/
Documenation : https://ncar.github.io/pyDARTdiags/
We recommend installing pydartdiags in a virtual enviroment:
python3 -m venv dartdiags
source dartdiags/bin/activate
pip install pydartdiags
Example importing the obs_sequence and plots modules
from pydartdiags.obs_sequence import obs_sequence as obsq
from pydartdiags.plots import plots
Examining the dataframe
obs_seq = obsq.obs_sequence('obs_seq.final.ascii')
obs_seq.df.head()
| obs_num | observation | prior_ensemble_mean | prior_ensemble_spread | prior_ensemble_member_1 | prior_ensemble_member_2 | prior_ensemble_member_3 | prior_ensemble_member_4 | prior_ensemble_member_5 | prior_ensemble_member_6 | ... | latitude | vertical | vert_unit | type | seconds | days | time | obs_err_var | bias | sq_err | |
|---|---|---|---|---|---|---|---|---|---|---|---|---|---|---|---|---|---|---|---|---|---|
| 0 | 1 | 230.16 | 231.310652 | 0.405191 | 231.304725 | 231.562874 | 231.333915 | 231.297690 | 232.081416 | 231.051063 | ... | 0.012188 | 23950.0 | pressure (Pa) | ACARS_TEMPERATURE | 75603 | 153005 | 2019-12-01 21:00:03 | 1.00 | 1.150652 | 1.324001 |
| 1 | 2 | 18.40 | 15.720527 | 0.630827 | 14.217207 | 15.558196 | 15.805599 | 16.594644 | 14.877743 | 16.334438 | ... | 0.012188 | 23950.0 | pressure (Pa) | ACARS_U_WIND_COMPONENT | 75603 | 153005 | 2019-12-01 21:00:03 | 6.25 | -2.679473 | 7.179578 |
| 2 | 3 | 1.60 | -4.932073 | 0.825899 | -5.270562 | -5.955998 | -4.209766 | -5.105016 | -4.669405 | -4.365305 | ... | 0.012188 | 23950.0 | pressure (Pa) | ACARS_V_WIND_COMPONENT | 75603 | 153005 | 2019-12-01 21:00:03 | 6.25 | -6.532073 | 42.667980 |
| 3 | 4 | 264.16 | 264.060532 | 0.035584 | 264.107192 | 264.097270 | 264.073212 | 264.047718 | 264.074140 | 264.019895 | ... | 0.010389 | 56260.0 | pressure (Pa) | ACARS_TEMPERATURE | 75603 | 153005 | 2019-12-01 21:00:03 | 1.00 | -0.099468 | 0.009894 |
| 4 | 5 | 11.60 | 10.134115 | 0.063183 | 10.067956 | 10.078798 | 10.120263 | 10.084885 | 10.135112 | 10.140610 | ... | 0.010389 | 56260.0 | pressure (Pa) | ACARS_U_WIND_COMPONENT | 75603 | 153005 | 2019-12-01 21:00:03 | 6.25 | -1.465885 | 2.148818 |
5 rows × 97 columns
Find the numeber of assimilated (used) observations vs. possible observations by type
obsq.possible_vs_used(obs_seq.df)
| type | possible | used | |
|---|---|---|---|
| 0 | ACARS_TEMPERATURE | 175429 | 128040 |
| 1 | ACARS_U_WIND_COMPONENT | 176120 | 126946 |
| 2 | ACARS_V_WIND_COMPONENT | 176120 | 127834 |
| 3 | AIRCRAFT_TEMPERATURE | 21335 | 13663 |
| 4 | AIRCRAFT_U_WIND_COMPONENT | 21044 | 13694 |
| 5 | AIRCRAFT_V_WIND_COMPONENT | 21044 | 13642 |
| 6 | AIRS_SPECIFIC_HUMIDITY | 6781 | 0 |
| 7 | AIRS_TEMPERATURE | 19583 | 7901 |
| 8 | GPSRO_REFRACTIVITY | 81404 | 54626 |
| 9 | LAND_SFC_ALTIMETER | 21922 | 0 |
| 10 | MARINE_SFC_ALTIMETER | 9987 | 0 |
| 11 | MARINE_SFC_SPECIFIC_HUMIDITY | 4196 | 0 |
| 12 | MARINE_SFC_TEMPERATURE | 8646 | 0 |
| 13 | MARINE_SFC_U_WIND_COMPONENT | 8207 | 0 |
| 14 | MARINE_SFC_V_WIND_COMPONENT | 8207 | 0 |
| 15 | RADIOSONDE_SPECIFIC_HUMIDITY | 14272 | 0 |
| 16 | RADIOSONDE_SURFACE_ALTIMETER | 601 | 0 |
| 17 | RADIOSONDE_TEMPERATURE | 29275 | 22228 |
| 18 | RADIOSONDE_U_WIND_COMPONENT | 36214 | 27832 |
| 19 | RADIOSONDE_V_WIND_COMPONENT | 36214 | 27975 |
| 20 | SAT_U_WIND_COMPONENT | 107212 | 82507 |
| 21 | SAT_V_WIND_COMPONENT | 107212 | 82647 |
Example plotting
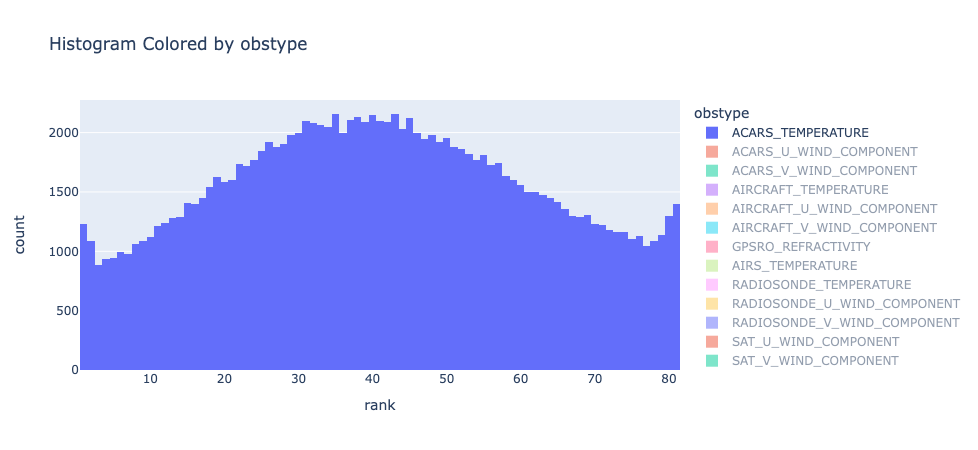
rank histogram
- Select only observations that were assimliated (QC === 0).
- plot the rank histogram
df_qc0 = obsq.select_by_dart_qc(obs_seq.df, 0)
plots.plot_rank_histogram(df_qc0)
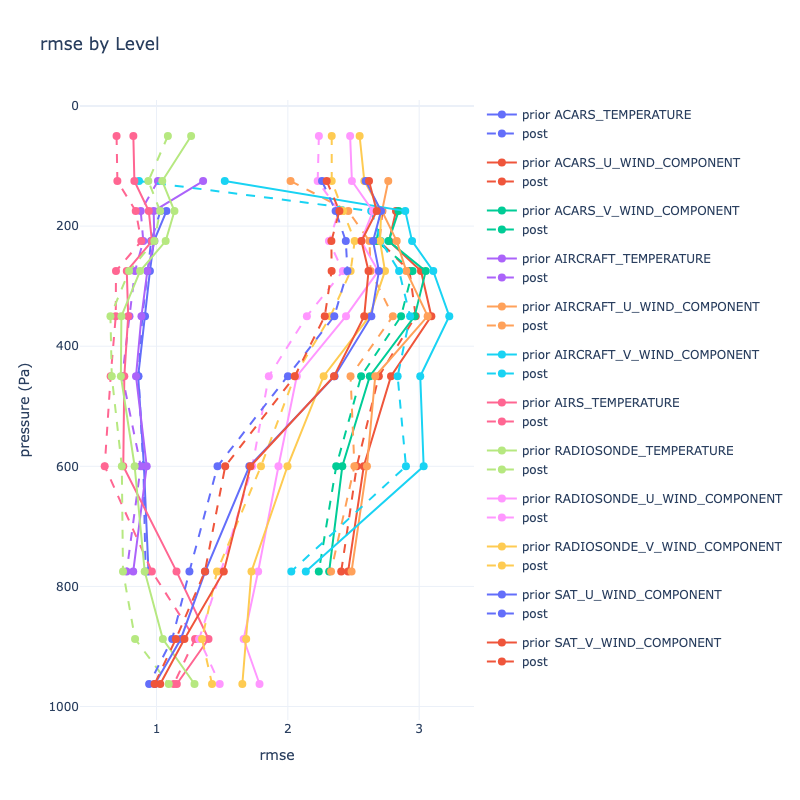
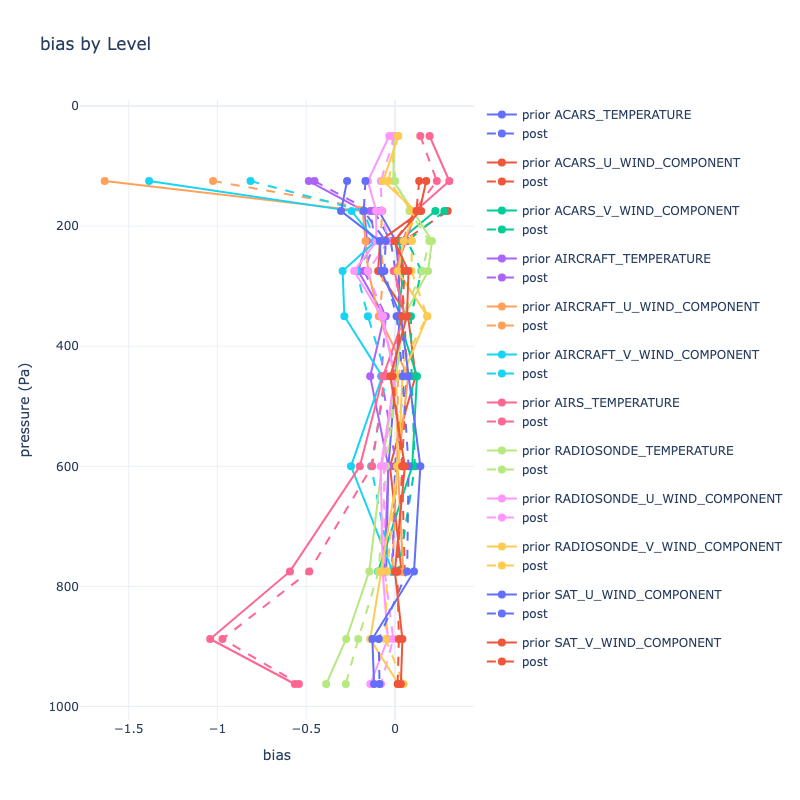
plot profile of RMSE and Bias
- Chose levels
- Select only observations that were assimliated (QC === 0).
- plot the profiles
hPalevels = [0.0, 100.0,  150.0, 200.0, 250.0, 300.0, 400.0, 500.0, 700, 850, 925, 1000]# float("inf")] # Pa?
plevels = [i * 100 for i in hPalevels]

df_qc0 = obsq.select_by_dart_qc(obs_seq.df, 0)  # only qc 0
df_profile, figrmse, figbias = plots.plot_profile(df_qc0, plevels)
Contributing
Contributions are welcome! If you have a feature request, bug report, or a suggestion, please open an issue on our GitHub repository.
License
pyDARTdiags is released under the Apache License 2.0. For more details, see the LICENSE file in the root directory of this source tree or visit Apache License 2.0.
Release history Release notifications | RSS feed


Download files
Download the file for your platform. If you're not sure which to choose, learn more about installing packages.
Source Distribution
Built Distribution
Filter files by name, interpreter, ABI, and platform.
If you're not sure about the file name format, learn more about wheel file names.
Copy a direct link to the current filters
File details
Details for the file pydartdiags-0.0.42.tar.gz.
File metadata
- Download URL: pydartdiags-0.0.42.tar.gz
- Upload date:
- Size: 21.7 kB
- Tags: Source
- Uploaded using Trusted Publishing? No
- Uploaded via: twine/5.1.1 CPython/3.9.6
File hashes
| Algorithm | Hash digest | |
|---|---|---|
| SHA256 |
9107b2e077b6f39e18fe3b220abe09364a1f88173f98c623716e2e01237e4cd8
|
|
| MD5 |
9ef1641bdc27aa172dd0264ed7a87562
|
|
| BLAKE2b-256 |
c6b2597e24cdacf16ba7b5f5192b79cd9f0e342bac85851784d6a8c84a558768
|
File details
Details for the file pydartdiags-0.0.42-py3-none-any.whl.
File metadata
- Download URL: pydartdiags-0.0.42-py3-none-any.whl
- Upload date:
- Size: 18.4 kB
- Tags: Python 3
- Uploaded using Trusted Publishing? No
- Uploaded via: twine/5.1.1 CPython/3.9.6
File hashes
| Algorithm | Hash digest | |
|---|---|---|
| SHA256 |
f822e94067aa92eb0f699ac8dc5d55d1e005308a70c7ed82ddb11a19ffd68959
|
|
| MD5 |
02d338e95545a06d6c4f5fc609daec51
|
|
| BLAKE2b-256 |
a9ea58a720fc2ac109e21f5581de8bb35688a81e0defbb90d3718ec5eda1226d
|


