An assortment of graphics utilities

Project description
PyDove: an assortment of graphics utilities


This is an assortment of utilities for plotting in Python using matplotlib and seaborn. Below are some highlights.
Features
A figure manager
The default matplotlib figure uses a box around the figure. For most plots I find this to be both a waste of ink and a bit ugly. It can also make it hard to see points close to the edges of the figure. For these reasons, I usually use the despine function from seaborn to remove the right and upper segments of the figure box, and also to add a bit of an offset between the remaining spines. Like this:
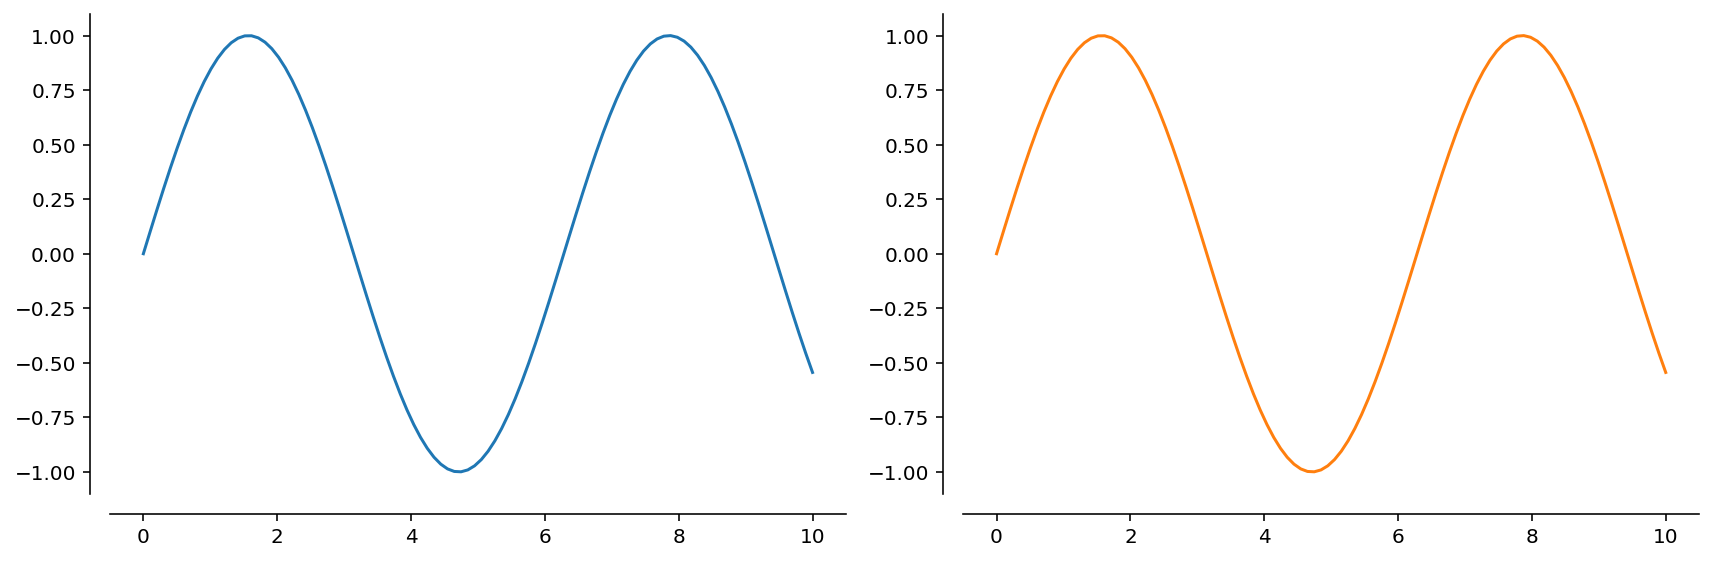
To automate this behavior, I created FigureManager, a context manager that basically calls plt.subplots, but also applies despine to the axes upon exit. For instance, the figure above can be obtained using:
import numpy as np
from pydove import FigureManager

with FigureManager(1, 2) as (_, axs):
    x = np.linspace(0, 10, 100)
    for i, ax in enumerate(axs):
        ax.plot(x, np.sin(x), c=f"C{i}")
Note that the FigureManager also scales the figure size when using multiple panels so that each panel is the same size as the default figure. This is in contrast to matplotlib's default behavior which is to keep the figure size fixed. The behavior of the FigureManager is fully configurable -- see the docstring and the example notebook in the test folder for details.
A more useful regplot
The seaborn function regplot allows overlaying a fit line and confidence interval on a scatter plot. Unfortunately, it does not either a) provide a mechanism to access the fitting results, or b) allow plotting a user-provided fit line. This package provides a reimplementation [*] of sns.regplot that returns the RegressionResults structure from a statsmodels linear fit. The implementation also provides functions scatter, fitplot, and polyfit, that are used by regplot to generate the scatter part of the plot, the fit line and confidence interval, and to obtain the fitting results, respectively.
[*] Some features of sns.regplot are not currently implemented. Others may behave slightly differently.
The regplot function provided here should function as a drop-in replacement for sns.regplot in most cases. The main disadvantage is that the styling options are slightly different, and so the results might not always match perfectly. In some cases this is by design (because I didn't like seaborn's choices), but in other cases it's because I haven't yet implemented all the hacks that seaborn employs to yield good-looking plots.
There are some things that this regplot function does better than sns.regplot:
-
consistency: all the fits are calculated using
statsmodels, even the polynomial ones. -
speed: confidence intervals are calculated directly using
statsmodels, removing the need for bootstrapping. -
flexibility: polynomial fits in
log(x)are not allowed insns.regplotbut work here. -
configurability:
- the number of points used for the fit line and confidence interval is configurable;
- separate keyword options for confidence intervals are supported.
The basic usage is identical to seaborn, e.g.:
import matplotlib.pyplot as plt
import pydove as dv
import numpy as np

# generate some data
rng = np.random.default_rng(0)
x = np.linspace(0, 1, 100)
y = 3.0 * x - 0.15 + rng.normal(size=len(x))

# plot it
fig, ax = plt.subplots()
res = dv.regplot(x, y, order=2, ax=ax)
will make a scatter plot of y vs. x, fitting a second-order polynomial through the data:
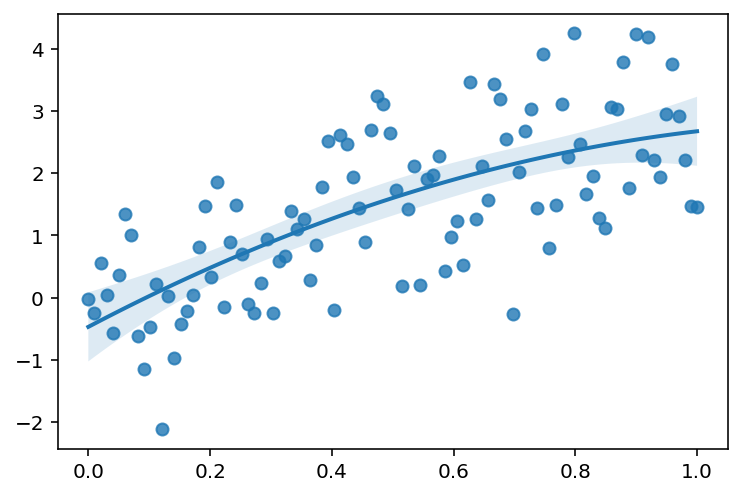
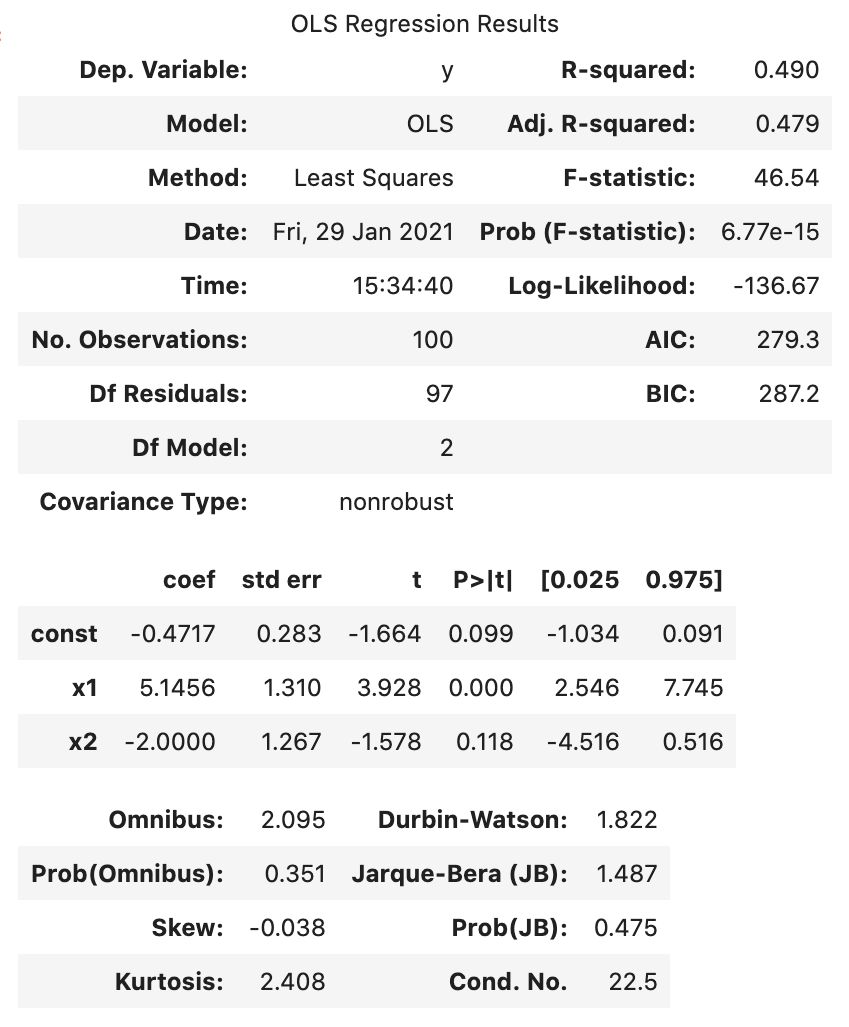
The statsmodels results structure contains a wealth of information:
res.summary()
More examples can be found in the notebooks in the test folder.
Colorbar and colormap functions
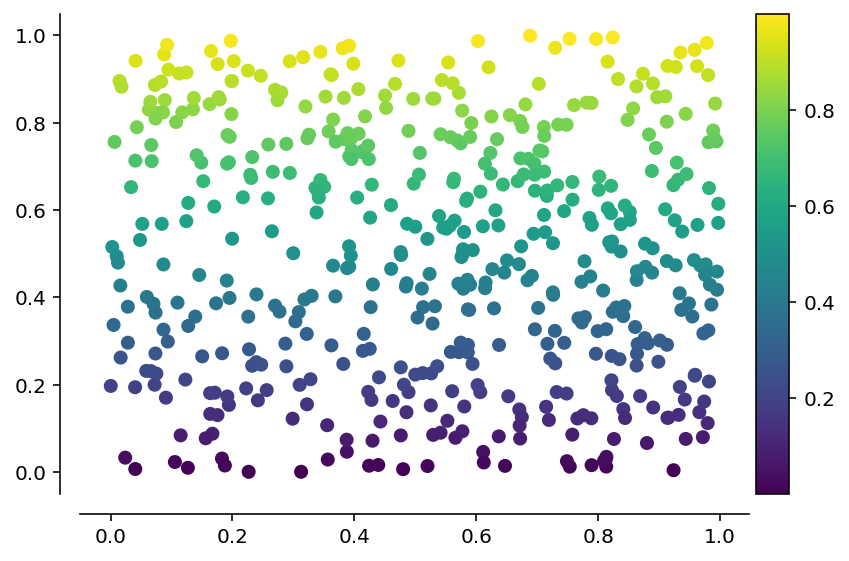
The default colorbar function in matplotlib is not always easy to use and often leads to a colorbar whose height is not matched to the figure. The colorbar function in pydove makes this easy (using code inspired from Stackoverflow). Additionaly, plt.colorbar does not work with scatter, whereas dv.colorbar does:
import numpy as np
import pydove as dv

rng = np.random.default_rng(0)
with dv.FigureManager() as (_, ax):
    n = 500
    x = rng.uniform(size=n)
    y = rng.uniform(size=n)
    h = ax.scatter(x, y, c=y)
    dv.colorbar(h)
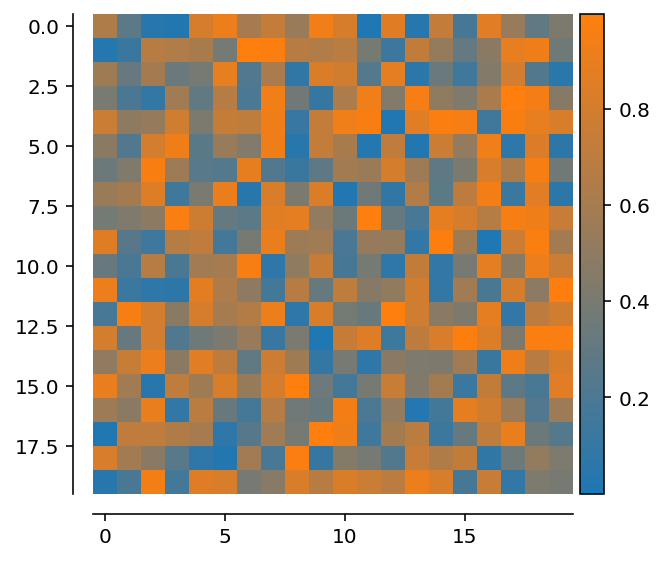
Sometimes it is useful to define a color map that interpolates between two given colors. Matplotlib's LinearSegmentedColormap does this, but in a format that is awkward to use. The function dv.gradient_cmap makes it easy:
import numpy as np
import pydove as dv

rng = np.random.default_rng(0)
with dv.FigureManager() as (_, ax):
    h = ax.imshow(
        rng.uniform(size=(20, 20)), cmap=dv.gradient_cmap("C0_to_C1", "C0", "C1")
    )
    dv.colorbar(h)
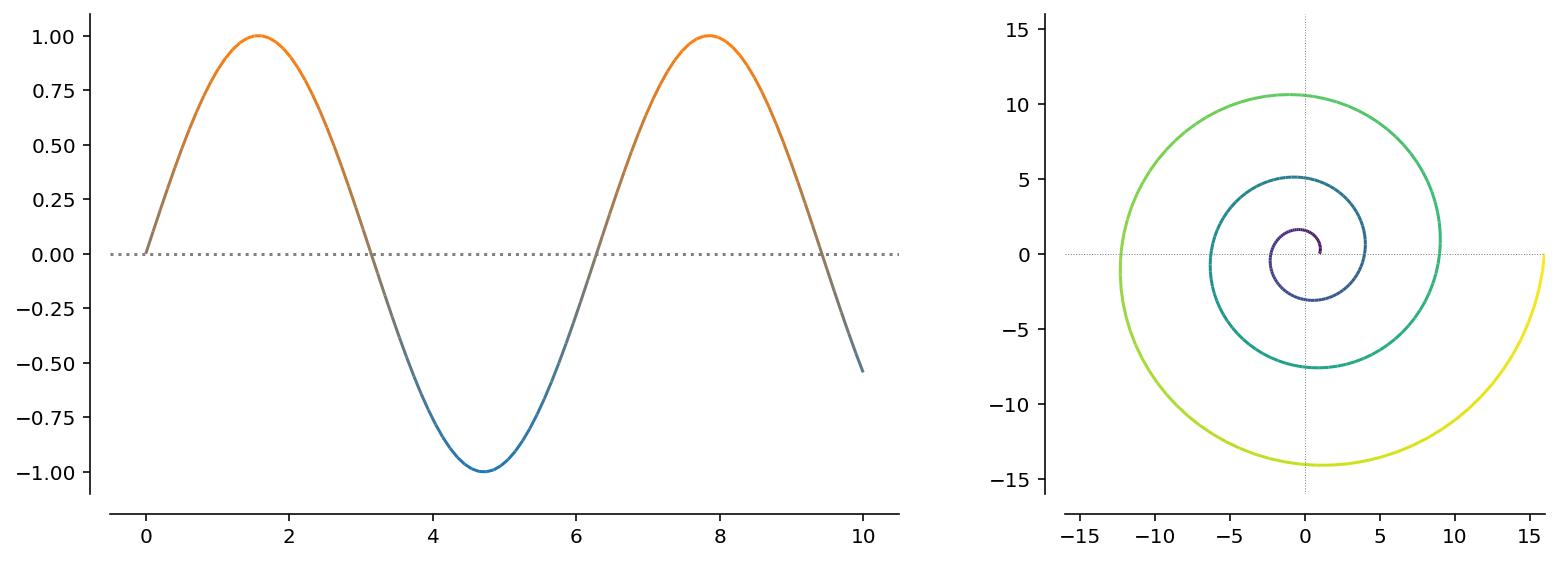
Plotting
Sometimes it is useful to generate a line plot with varying colors. This can be done like this:
import numpy as np
import pydove as dv

custom_cmap = dv.gradient_cmap("custom_cmap", "C0", "C1")
with dv.FigureManager(1, 2) as (_, (ax1, ax2)):
    x = np.linspace(0, 10, 100)
    y = np.sin(x)
    c = y
    ax1.axhline(0, color="gray", ls=":")
    dv.color_plot(x, y, c, cmap=custom_cmap, ax=ax1)
    ax1.autoscale()

    c = np.linspace(0, 6 * np.pi, 250)
    r = np.linspace(1, 4, len(c)) ** 2
    x = r * np.cos(c)
    y = r * np.sin(c)
    ax2.axhline(0, color="gray", ls=":", lw=0.5)
    ax2.axvline(0, color="gray", ls=":", lw=0.5)
    dv.color_plot(x, y, c, ax=ax2)

    max_r = np.max(r)
    ax2.set_xlim(-max_r, max_r)
    ax2.set_ylim(-max_r, max_r)

    ax2.set_aspect(1)
Installation
From PyPI
The package is now available on PyPI, so you can simply run
pip install pydove
From source
After cloning the repository or downloading and decompressing, run the following command in the folder containing setup.py:
pip install .
Release history Release notifications | RSS feed


Download files
Download the file for your platform. If you're not sure which to choose, learn more about installing packages.
Source Distribution
Built Distribution
Filter files by name, interpreter, ABI, and platform.
If you're not sure about the file name format, learn more about wheel file names.
Copy a direct link to the current filters
File details
Details for the file pydove-0.3.5.tar.gz.
File metadata
- Download URL: pydove-0.3.5.tar.gz
- Upload date:
- Size: 457.2 kB
- Tags: Source
- Uploaded using Trusted Publishing? No
- Uploaded via: twine/3.4.1 importlib_metadata/3.10.0 pkginfo/1.7.0 requests/2.25.1 requests-toolbelt/0.9.1 tqdm/4.59.0 CPython/3.8.2
File hashes
| Algorithm | Hash digest | |
|---|---|---|
| SHA256 |
2e5ffc393a0ffb053c25dc2850e028f7ef2c298c5e6c6c21e18054792ef08f9e
|
|
| MD5 |
0122b3a842a0a679bd76e21079a034e7
|
|
| BLAKE2b-256 |
cc5db6215d692867de4b49dc1416bc1c050a9871afadb822364a7aa883db41ec
|
File details
Details for the file pydove-0.3.5-py3-none-any.whl.
File metadata
- Download URL: pydove-0.3.5-py3-none-any.whl
- Upload date:
- Size: 13.0 kB
- Tags: Python 3
- Uploaded using Trusted Publishing? No
- Uploaded via: twine/3.4.1 importlib_metadata/3.10.0 pkginfo/1.7.0 requests/2.25.1 requests-toolbelt/0.9.1 tqdm/4.59.0 CPython/3.8.2
File hashes
| Algorithm | Hash digest | |
|---|---|---|
| SHA256 |
1d0d8603f81173c4b6dcd3de10f6c257dc666096de179e0e3b6b2f0a20985cca
|
|
| MD5 |
4684f6f0819f7da22322c6b5f2c52e4a
|
|
| BLAKE2b-256 |
9cbb2623363e458bf0154ff20d28a1f666771776a3ba5e137b86dca87c77c1c3
|


