A Python connector for Druid.


Project description
pydruid
pydruid exposes a simple API to create, execute, and analyze Druid queries. pydruid can parse query results into Pandas DataFrame objects for subsequent data analysis -- this offers a tight integration between Druid, the SciPy stack (for scientific computing) and scikit-learn (for machine learning). pydruid can export query results into TSV or JSON for further processing with your favorite tool, e.g., R, Julia, Matlab, Excel. It provides both synchronous and asynchronous clients.
Additionally, pydruid implements the Python DB API 2.0, a SQLAlchemy dialect, and a provides a command line interface to interact with Druid.
To install:
pip install pydruid
# or, if you intend to use asynchronous client
pip install pydruid[async]
# or, if you intend to export query results into pandas
pip install pydruid[pandas]
# or, if you intend to do both
pip install pydruid[async, pandas]
# or, if you want to use the SQLAlchemy engine
pip install pydruid[sqlalchemy]
# or, if you want to use the CLI
pip install pydruid[cli]
Documentation: https://pythonhosted.org/pydruid/.
examples
The following exampes show how to execute and analyze the results of three types of queries: timeseries, topN, and groupby. We will use these queries to ask simple questions about twitter's public data set.
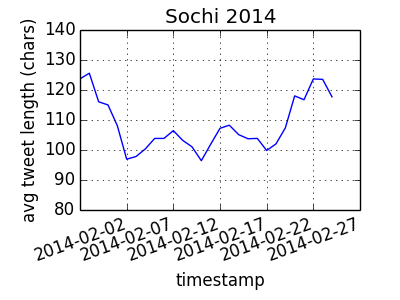
timeseries
What was the average tweet length, per day, surrounding the 2014 Sochi olympics?
from pydruid.client import *
from pylab import plt

query = PyDruid(druid_url_goes_here, 'druid/v2')

ts = query.timeseries(
    datasource='twitterstream',
    granularity='day',
    intervals='2014-02-02/p4w',
    aggregations={'length': doublesum('tweet_length'), 'count': doublesum('count')},
    post_aggregations={'avg_tweet_length': (Field('length') / Field('count'))},
    filter=Dimension('first_hashtag') == 'sochi2014'
)
df = query.export_pandas()
df['timestamp'] = df['timestamp'].map(lambda x: x.split('T')[0])
df.plot(x='timestamp', y='avg_tweet_length', ylim=(80, 140), rot=20,
        title='Sochi 2014')
plt.ylabel('avg tweet length (chars)')
plt.show()
topN
Who were the top ten mentions (@user_name) during the 2014 Oscars?
top = query.topn(
    datasource='twitterstream',
    granularity='all',
    intervals='2014-03-03/p1d',  # utc time of 2014 oscars
    aggregations={'count': doublesum('count')},
    dimension='user_mention_name',
    filter=(Dimension('user_lang') == 'en') & (Dimension('first_hashtag') == 'oscars') &
           (Dimension('user_time_zone') == 'Pacific Time (US & Canada)') &
           ~(Dimension('user_mention_name') == 'No Mention'),
    metric='count',
    threshold=10
)

df = query.export_pandas()
print df

   count                 timestamp user_mention_name
0   1303  2014-03-03T00:00:00.000Z      TheEllenShow
1     44  2014-03-03T00:00:00.000Z        TheAcademy
2     21  2014-03-03T00:00:00.000Z               MTV
3     21  2014-03-03T00:00:00.000Z         peoplemag
4     17  2014-03-03T00:00:00.000Z               THR
5     16  2014-03-03T00:00:00.000Z      ItsQueenElsa
6     16  2014-03-03T00:00:00.000Z           eonline
7     15  2014-03-03T00:00:00.000Z       PerezHilton
8     14  2014-03-03T00:00:00.000Z     realjohngreen
9     12  2014-03-03T00:00:00.000Z       KevinSpacey
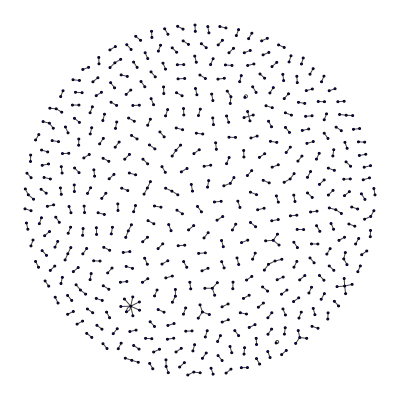
groupby
What does the social network of users replying to other users look like?
from igraph import *
from cairo import *
from pandas import concat

group = query.groupby(
    datasource='twitterstream',
    granularity='hour',
    intervals='2013-10-04/pt12h',
    dimensions=["user_name", "reply_to_name"],
    filter=(~(Dimension("reply_to_name") == "Not A Reply")) &
           (Dimension("user_location") == "California"),
    aggregations={"count": doublesum("count")}
)

df = query.export_pandas()

# map names to categorical variables with a lookup table
names = concat([df['user_name'], df['reply_to_name']]).unique()
nameLookup = dict([pair[::-1] for pair in enumerate(names)])
df['user_name_lookup'] = df['user_name'].map(nameLookup.get)
df['reply_to_name_lookup'] = df['reply_to_name'].map(nameLookup.get)

# create the graph with igraph
g = Graph(len(names), directed=False)
vertices = zip(df['user_name_lookup'], df['reply_to_name_lookup'])
g.vs["name"] = names
g.add_edges(vertices)
layout = g.layout_fruchterman_reingold()
plot(g, "tweets.png", layout=layout, vertex_size=2, bbox=(400, 400), margin=25, edge_width=1, vertex_color="blue")
asynchronous client
pydruid.async_client.AsyncPyDruid implements an asynchronous client. To achieve that, it utilizes an asynchronous
HTTP client from Tornado framework. The asynchronous client is suitable for use with async frameworks such as Tornado
and provides much better performance at scale. It lets you serve multiple requests at the same time, without blocking on
Druid executing your queries.
example
from tornado import gen
from pydruid.async_client import AsyncPyDruid
from pydruid.utils.aggregators import longsum
from pydruid.utils.filters import Dimension

client = AsyncPyDruid(url_to_druid_broker, 'druid/v2')

@gen.coroutine
def your_asynchronous_method_serving_top10_mentions_for_day(day
    top_mentions = yield client.topn(
        datasource='twitterstream',
        granularity='all',
        intervals="%s/p1d" % (day, ),
        aggregations={'count': doublesum('count')},
        dimension='user_mention_name',
        filter=(Dimension('user_lang') == 'en') & (Dimension('first_hashtag') == 'oscars') &
               (Dimension('user_time_zone') == 'Pacific Time (US & Canada)') &
               ~(Dimension('user_mention_name') == 'No Mention'),
        metric='count',
        threshold=10)

    # asynchronously return results
    # can be simply ```return top_mentions``` in python 3.x
    raise gen.Return(top_mentions)
thetaSketches
Theta sketch Post aggregators are built slightly differently to normal Post Aggregators, as they have different operators.
Note: you must have the druid-datasketches extension loaded into your Druid cluster in order to use these.
See the Druid datasketches documentation for details.
from pydruid.client import *
from pydruid.utils import aggregators
from pydruid.utils import filters
from pydruid.utils import postaggregator

query = PyDruid(url_to_druid_broker, 'druid/v2')
ts = query.groupby(
    datasource='test_datasource',
    granularity='all',
    intervals='2016-09-01/P1M',
    filter = ( filters.Dimension('product').in_(['product_A', 'product_B'])),
    aggregations={
        'product_A_users': aggregators.filtered(
            filters.Dimension('product') == 'product_A',
            aggregators.thetasketch('user_id')
            ),
        'product_B_users': aggregators.filtered(
            filters.Dimension('product') == 'product_B',
            aggregators.thetasketch('user_id')
            )
    },
    post_aggregations={
        'both_A_and_B': postaggregator.ThetaSketchEstimate(
            postaggregator.ThetaSketch('product_A_users') & postaggregator.ThetaSketch('product_B_users')
            )
    }
)
DB API
from pydruid.db import connect

conn = connect(host='localhost', port=8082, path='/druid/v2/sql/', scheme='http')
curs = conn.cursor()
curs.execute("""
    SELECT place,
           CAST(REGEXP_EXTRACT(place, '(.*),', 1) AS FLOAT) AS lat,
           CAST(REGEXP_EXTRACT(place, ',(.*)', 1) AS FLOAT) AS lon
      FROM places
     LIMIT 10
""")
for row in curs:
    print(row)
SQLAlchemy
from sqlalchemy import *
from sqlalchemy.engine import create_engine
from sqlalchemy.schema import *

engine = create_engine('druid://localhost:8082/druid/v2/sql/')  # uses HTTP by default :(
# engine = create_engine('druid+http://localhost:8082/druid/v2/sql/')
# engine = create_engine('druid+https://localhost:8082/druid/v2/sql/')

places = Table('places', MetaData(bind=engine), autoload=True)
print(select([func.count('*')], from_obj=places).scalar())
Column headers
In version 0.13.0 Druid SQL added support for including the column names in the response which can be requested via the "header" field in the request. This helps to ensure that the cursor description is defined (which is a requirement for SQLAlchemy query statements) regardless on whether the result set contains any rows. Historically this was problematic for result sets which contained no rows at one could not infer the expected column names.
Enabling the header can be configured via the SQLAlchemy URI by using the query parameter, i.e.,
engine = create_engine('druid://localhost:8082/druid/v2/sql?header=true')
Note the current default is false to ensure backwards compatibility but should
be set to true for Druid versions >= 0.13.0.
Command line
$ pydruid http://localhost:8082/druid/v2/sql/
> SELECT COUNT(*) AS cnt FROM places
  cnt
-----
12345
> SELECT TABLE_NAME FROM INFORMATION_SCHEMA.TABLES;
TABLE_NAME
----------
test_table
COLUMNS
SCHEMATA
TABLES
> BYE;
GoodBye!
Contributing
Contributions are welcomed of course. We like to use black and flake8.
pip install -r requirements-dev.txt  # installs useful dev deps
pre-commit install  # installs useful commit hooks
Release history Release notifications | RSS feed


Download files
Download the file for your platform. If you're not sure which to choose, learn more about installing packages.
Source Distribution
File details
Details for the file pydruid-0.6.9.tar.gz.
File metadata
- Download URL: pydruid-0.6.9.tar.gz
- Upload date:
- Size: 135.5 kB
- Tags: Source
- Uploaded using Trusted Publishing? No
- Uploaded via: twine/4.0.1 CPython/3.8.9
File hashes
| Algorithm | Hash digest | |
|---|---|---|
| SHA256 |
63c41b33ab47fbb71cc25d3f3316cad78f18bfe947fa108862dd841d1f44fe49
|
|
| MD5 |
b3929bea4d4871eb1db5e3bb00f0369f
|
|
| BLAKE2b-256 |
e9452f64d8c14b487274e825d793dc634f9f1040537aa6cb93d1ea8fc4498d65
|


