Plotting tool for evolutionary population dynamics. Creates a Fish (Muller) plot.


Project description
PyFish


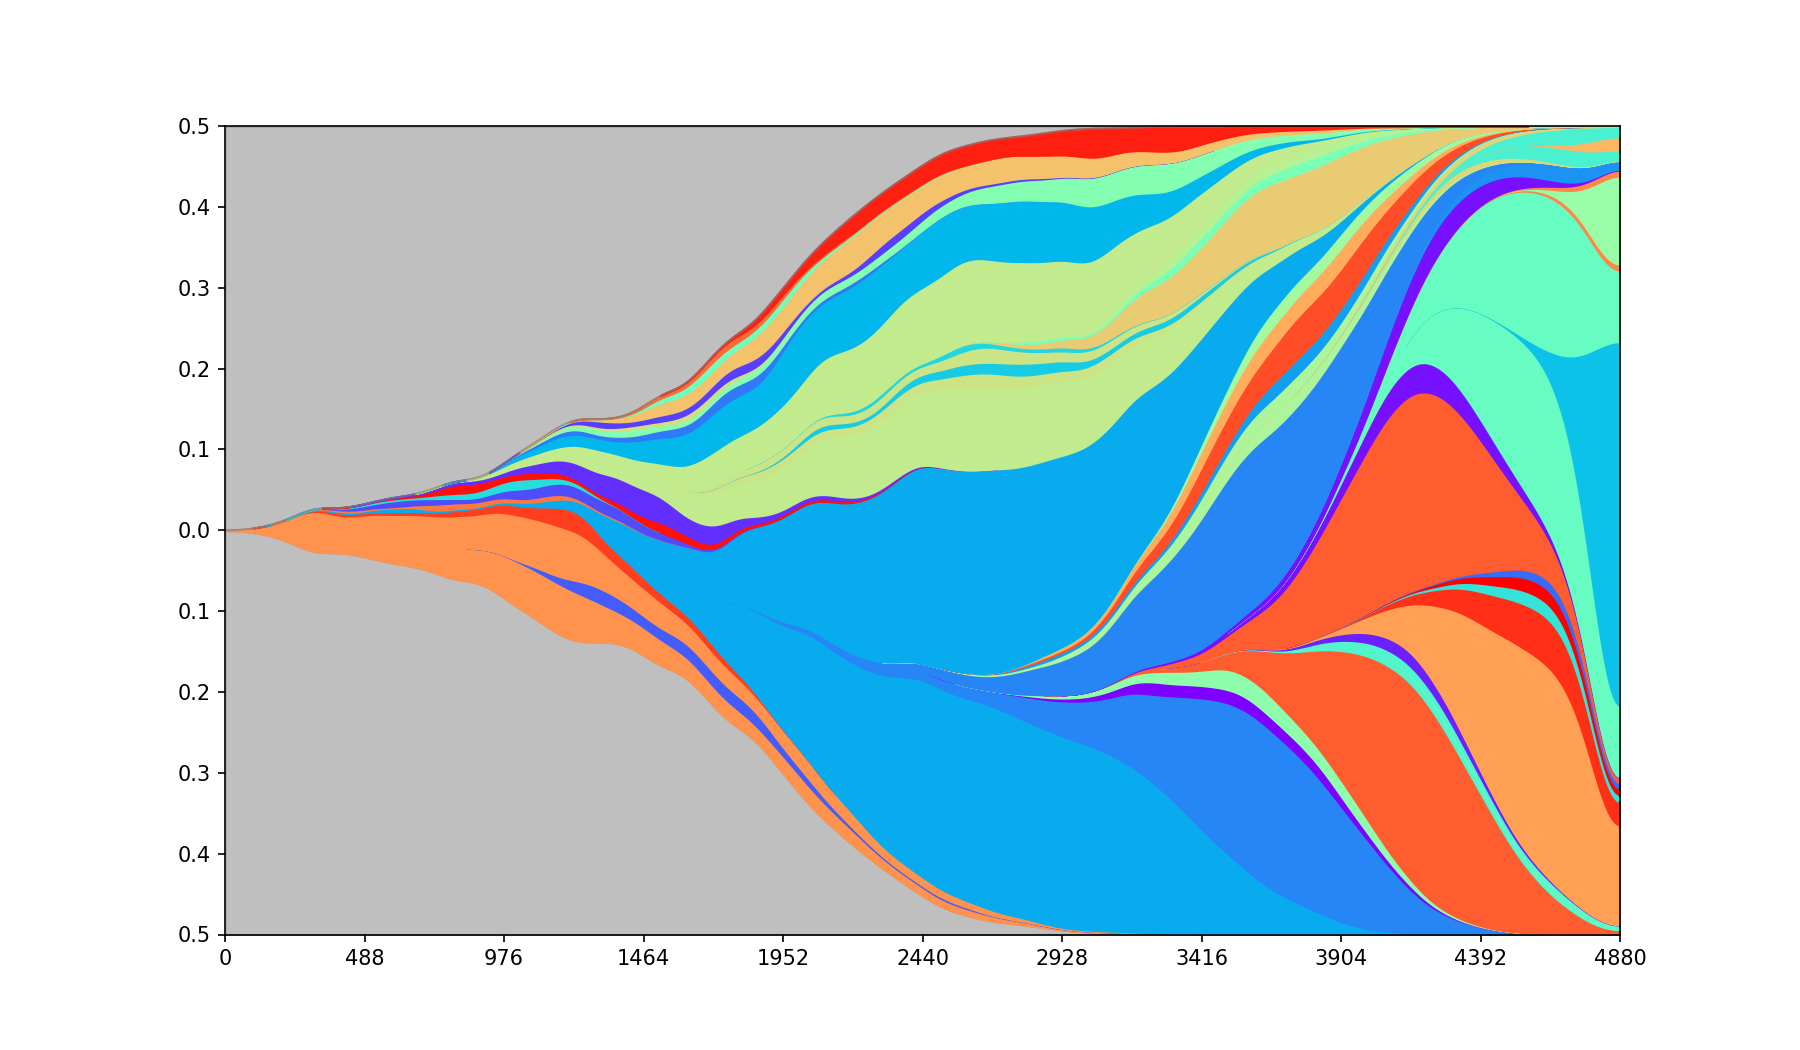
PyFish is a Python 3 package for creation of Fish (Muller) plots like the one below.
Primary features
- polynomial interpolation
- curve smoothing
- high performance
- works with low and high density data
PyFish can be used either as a stand-alone tool or as a plotting library.
Installation
PyFish requires Python >= 3.8
The package can be installed using Conda (from the bioconda channel)
conda install -c bioconda pyfish
or Pip
pip install pyfish.
Input
The program takes two tables:
- one describing the size of individual subgroups at given points in time, referred to as populations,
- one describing the parent-child relationships between the subgroups, referred to as parent tree.
Populations
Populations table has the schema (Id: +int, Step: +int, Pop: +int), where:
Idis a numerical identifier of a subgroup,Stepis a natural ordinal describing the logical time when the population is measured,Popis the size of the population of the subgroup at the given step.
An example populations table:
| Id | Step | Pop |
|---|---|---|
| 0 | 0 | 100 |
| 0 | 1 | 40 |
| 0 | 2 | 20 |
| 0 | 3 | 0 |
| 1 | 0 | 10 |
| 1 | 3 | 50 |
| 1 | 5 | 100 |
| 2 | 4 | 20 |
| 2 | 5 | 50 |
| 3 | 0 | 10 |
| 3 | 1 | 20 |
| 3 | 5 | 10 |
Parent Tree
Parent tree has the schema (ParentId: +int, ChildId: +int), where:
ParentIdis an id matching the population table,ChildIdis an id matching the population table describing the direct progeny of the parent.
An example parent tree:
| ParentId | ChildId |
|---|---|
| 0 | 1 |
| 1 | 2 |
| 0 | 3 |
Note: If multiple nodes have no parent, or if population IDs are not listed in the parent tree, a synthetic root with zero population is automatically created to parent them all.
A synthetic root is always centered and has a width zero, even when using curved or separate modes.
Tool
We provide example data. From the root folder of the project call:
pyfish tests/populations.csv tests/parent_tree.csv out.png
This will create a plot called out.png in the folder.
Additional execution parameters are described below.
Library
The populations and parent_tree tables can be constructed directly as dataframes.
A worked API example covering common options (raw, curved, separated, interpolated, and colormap comparison) is provided in example.ipynb.
The library contains three public functions:
process_dataTakes the input data and parameters and creates data suitable for plotting. Additional arguments match the parameters as described below.setup_figureResizes the figure and adds labels for axes.fish_plotCalls the plotting function on the input parameters.
Example:
import matplotlib.pyplot as plt
import numpy as np
import pandas as pd
from pyfish import fish_plot, process_data, setup_figure

populations = np.array([[0, 0, 100], [0, 1, 40], [0, 2, 20], [0, 3, 0], [1, 0, 10], [1, 3, 50],
    [1, 5, 100], [2, 4, 20], [2, 5, 50], [3, 0, 10], [3, 1, 20], [3, 5, 10]])
parent_tree = np.array([[0, 1], [1, 2], [0, 3]])
populations_df = pd.DataFrame(populations, columns=["Id", "Step", "Pop"])
parent_tree_df = pd.DataFrame(parent_tree, columns=["ParentId", "ChildId"])
data = process_data(populations_df, parent_tree_df)
setup_figure()
fish_plot(*data)
plt.show()
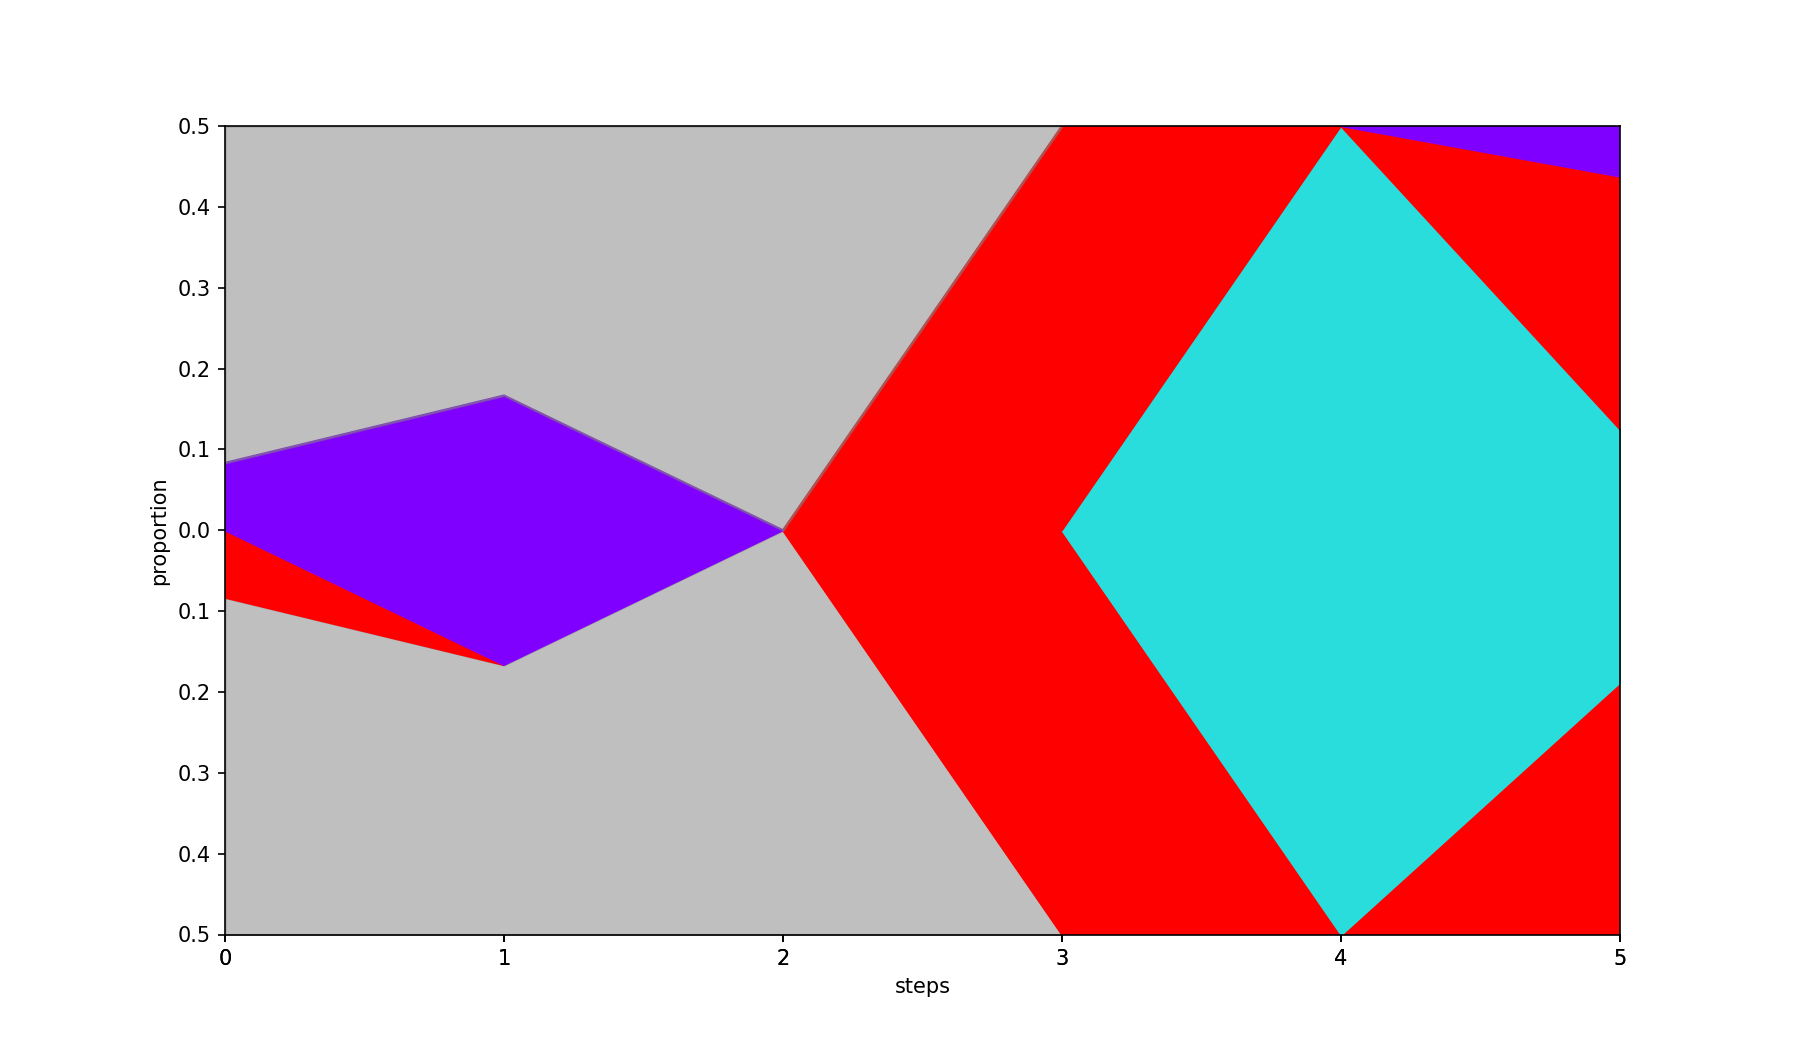
Calling the above code displays the following image:
Parameters
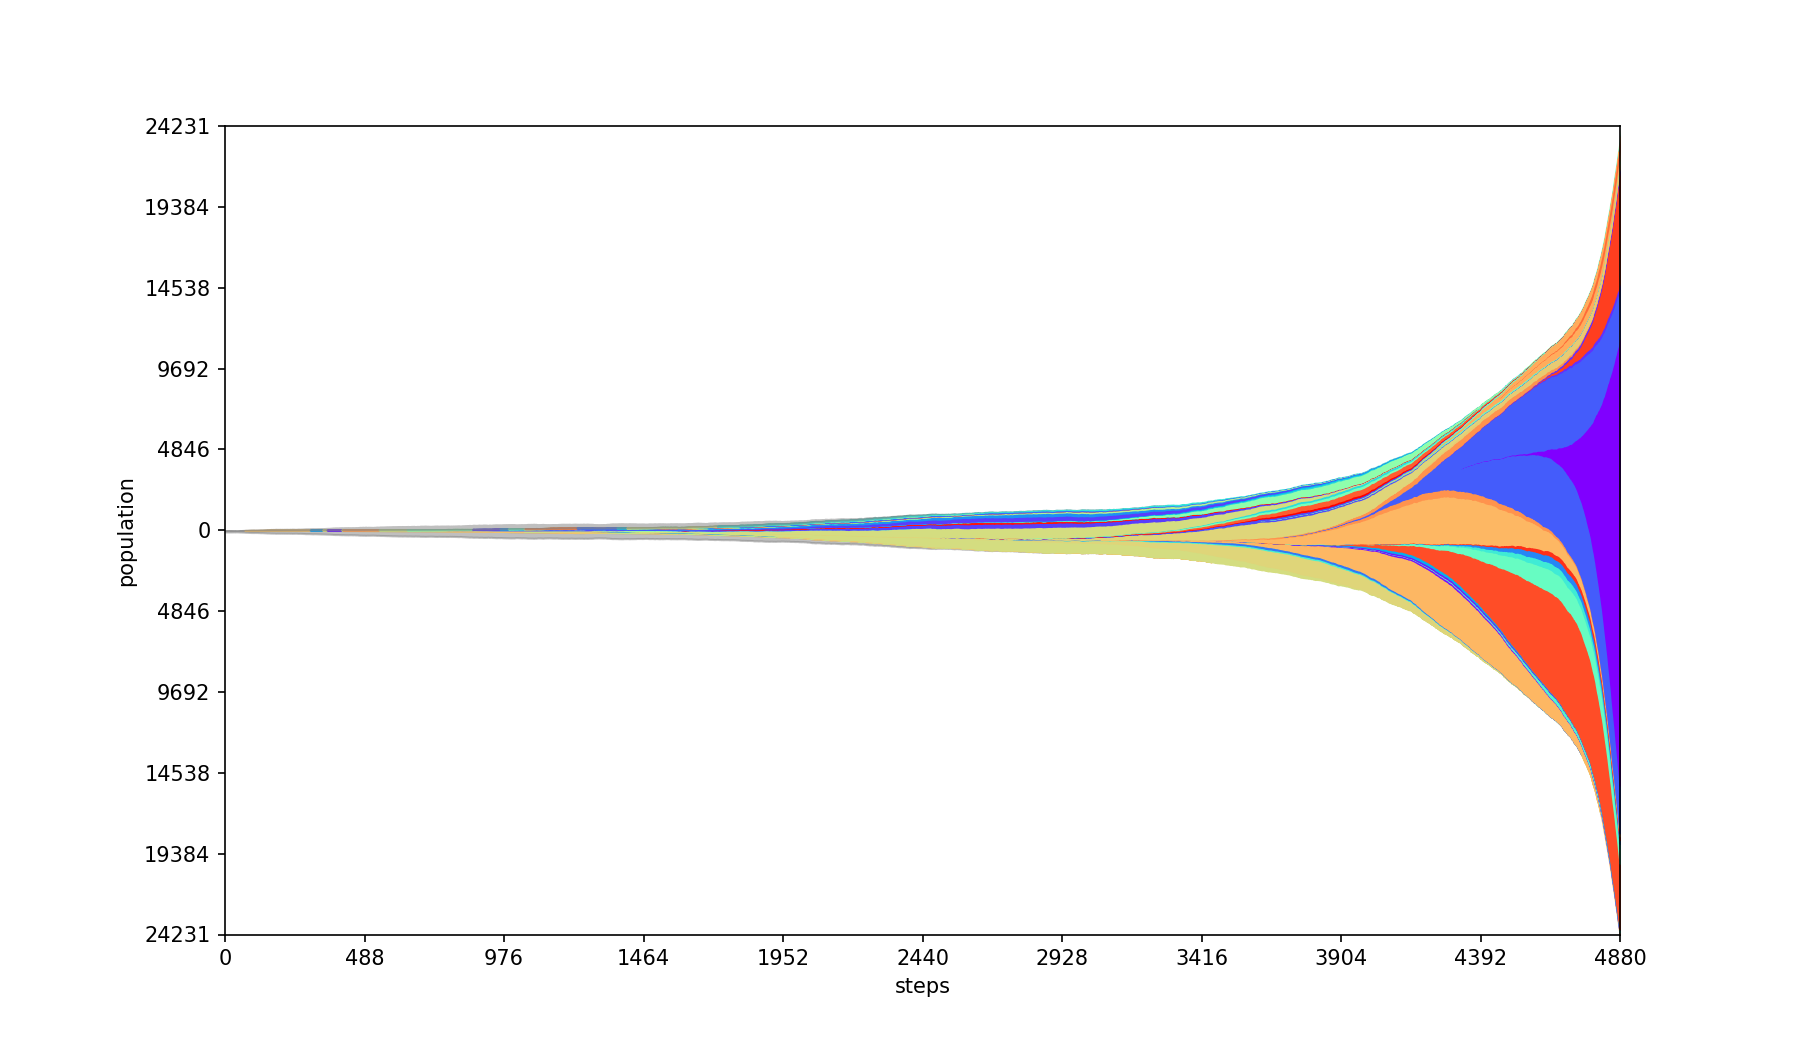
-a, --absolute
Plots absolute population counts at each step.
| Base | --absolute |
|---|---|
 |
 |
-I, --interpolate int
Fills in missing values by interpolation.
- A negative value (default) fills missing values with 0.
0uses linear interpolation between known data points.- A positive value uses polynomial (spline) interpolation of the given degree.
| Base | --interpolate 2 |
|---|---|
|
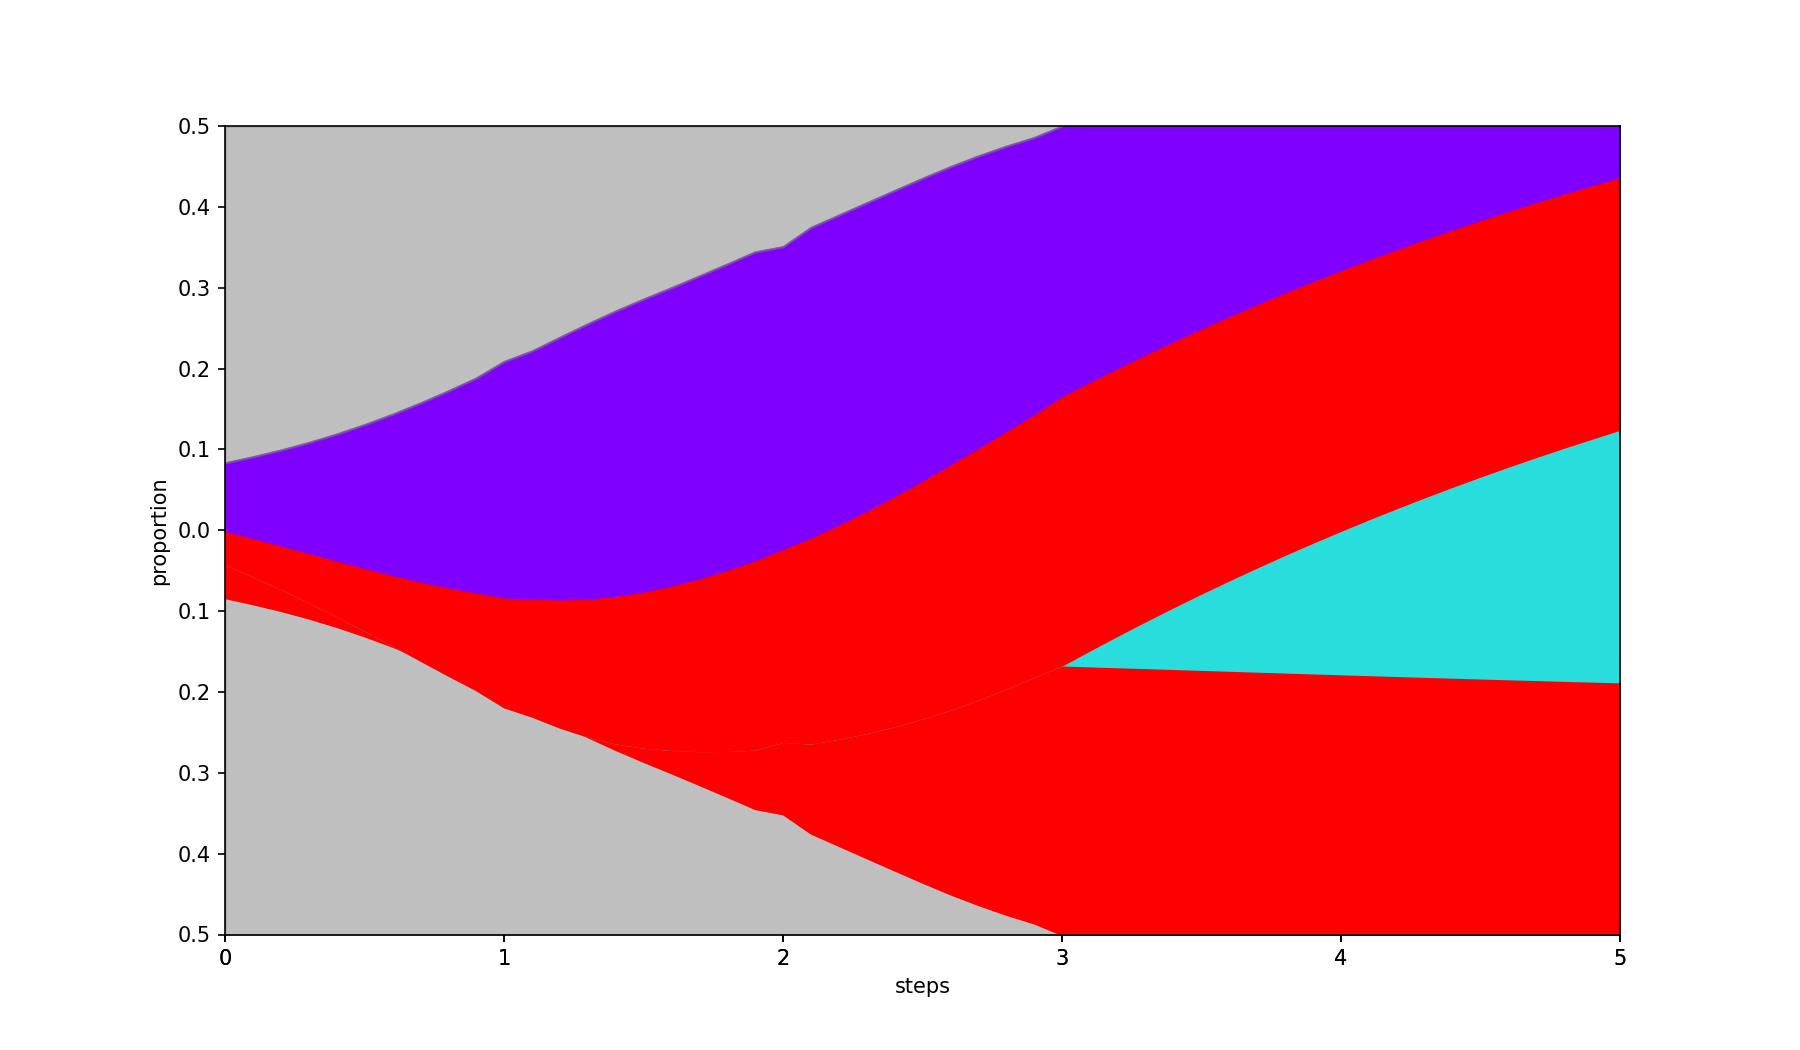 |
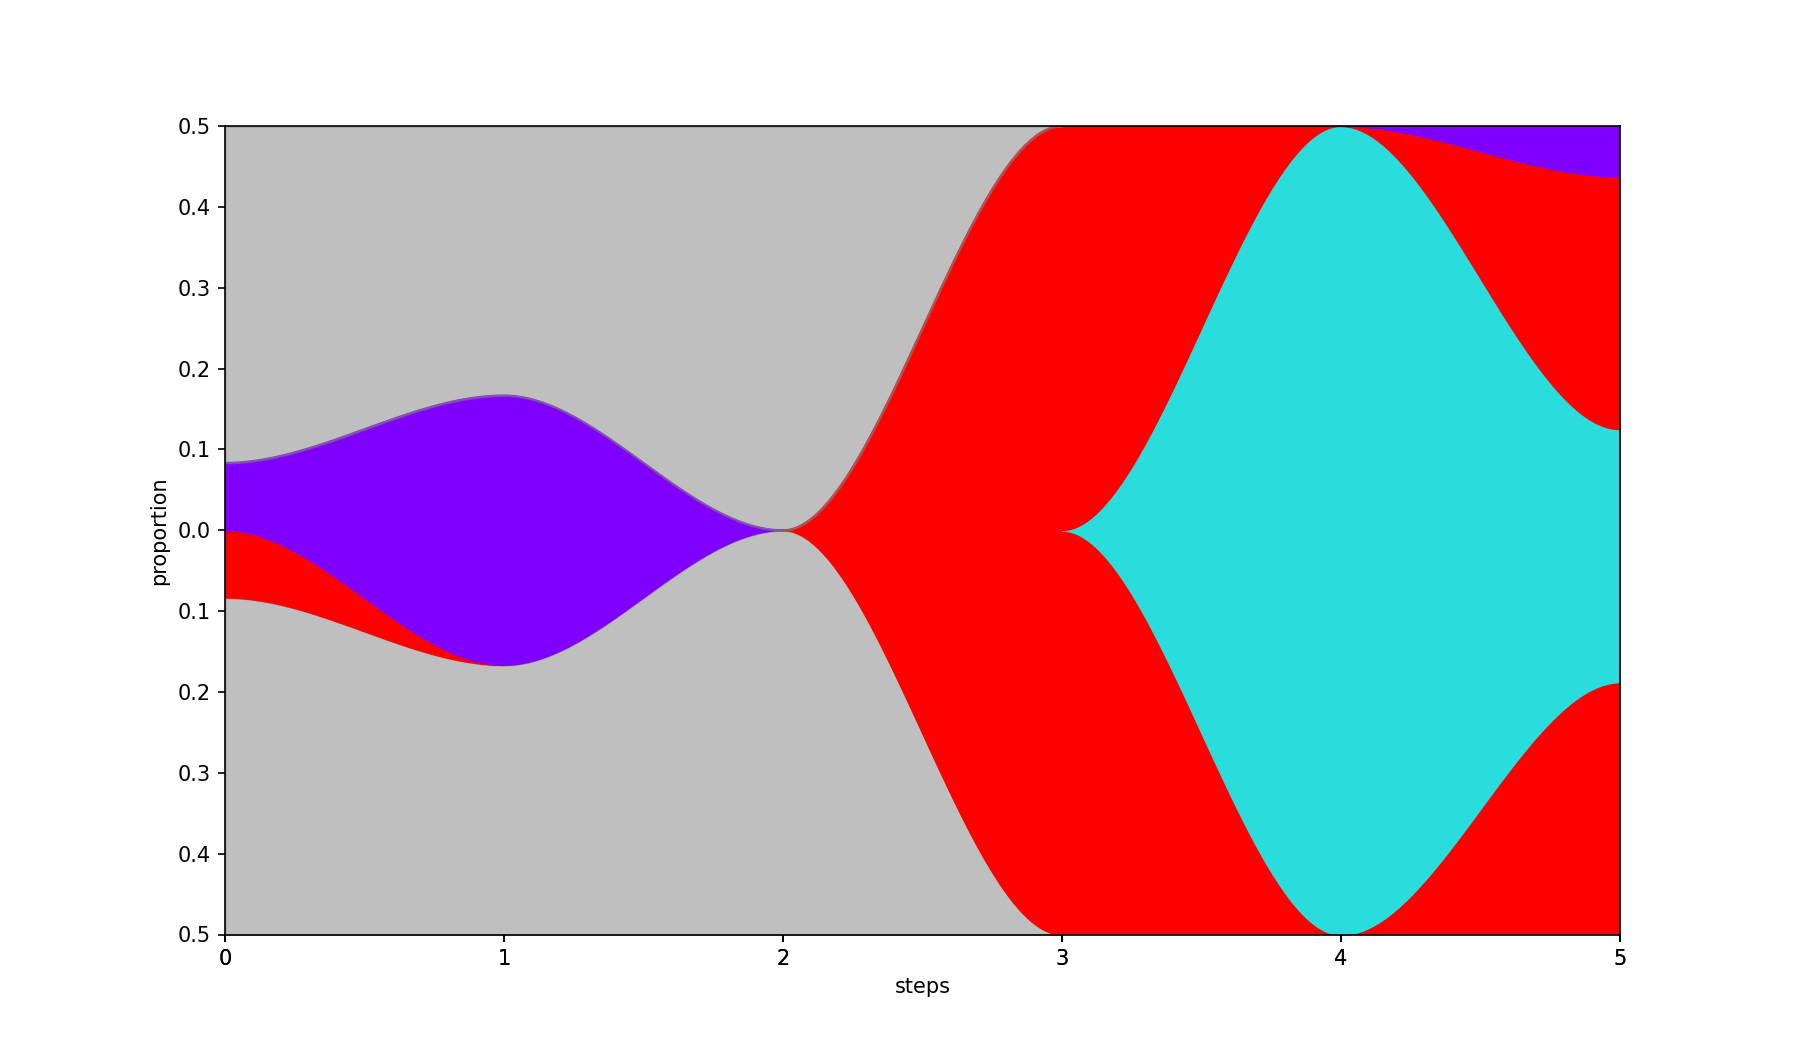
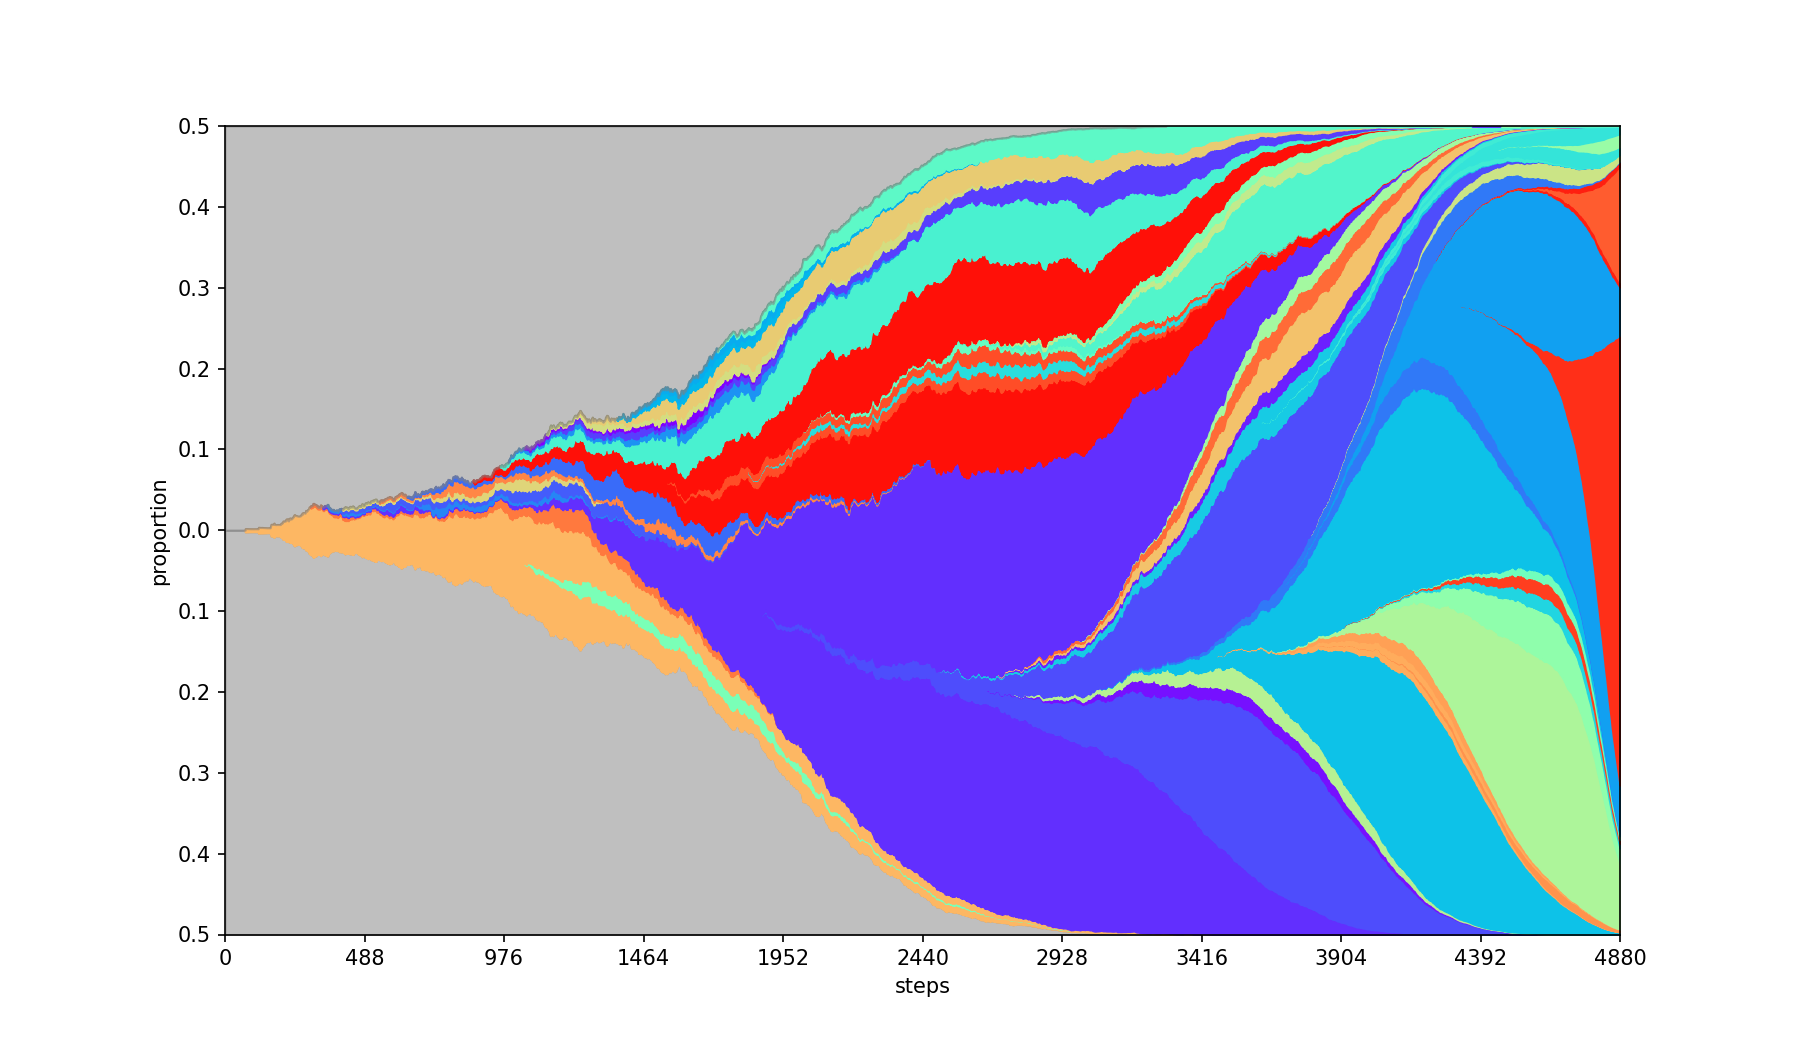
-V, --curved
Smooths the filled areas using piecewise Hermite interpolation, producing gentle S-curve transitions between steps. Also adds a gray background and centers the plot when the population is empty at the first step.
| Base | --curved |
|---|---|
|
 |
-S, --smooth float
Smoothing of the graph using Gaussian filter. The parameter value is the standard deviation of the kernel. The bigger the population the bigger the value should be.
NOTE: If the population values are sparse, using smoothing without interpolation might lead to misleading population sizes.
| Base | --smooth 50 |
|---|---|
|
 |
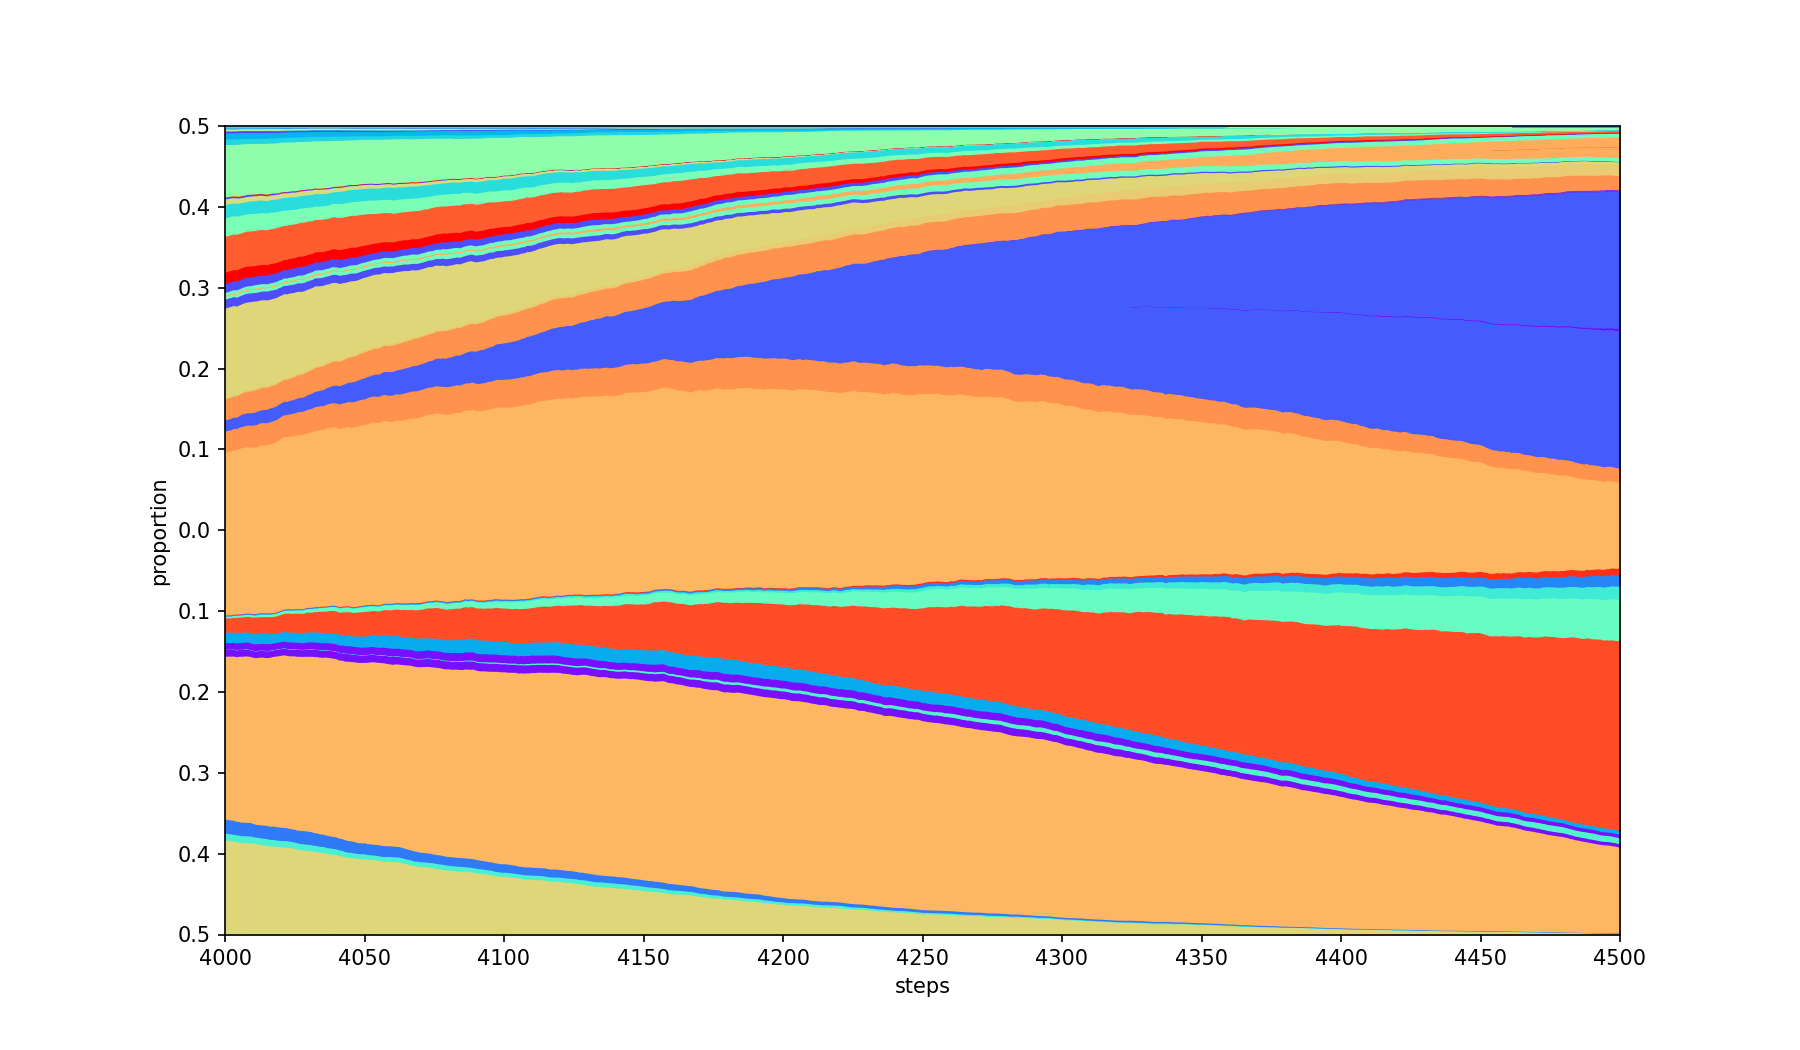
-F, --first int+, -L, --last int+
Only limits the steps to the range [first, last] inclusive.
| Base | --first 4000 --last 4500 |
|---|---|
|
 |
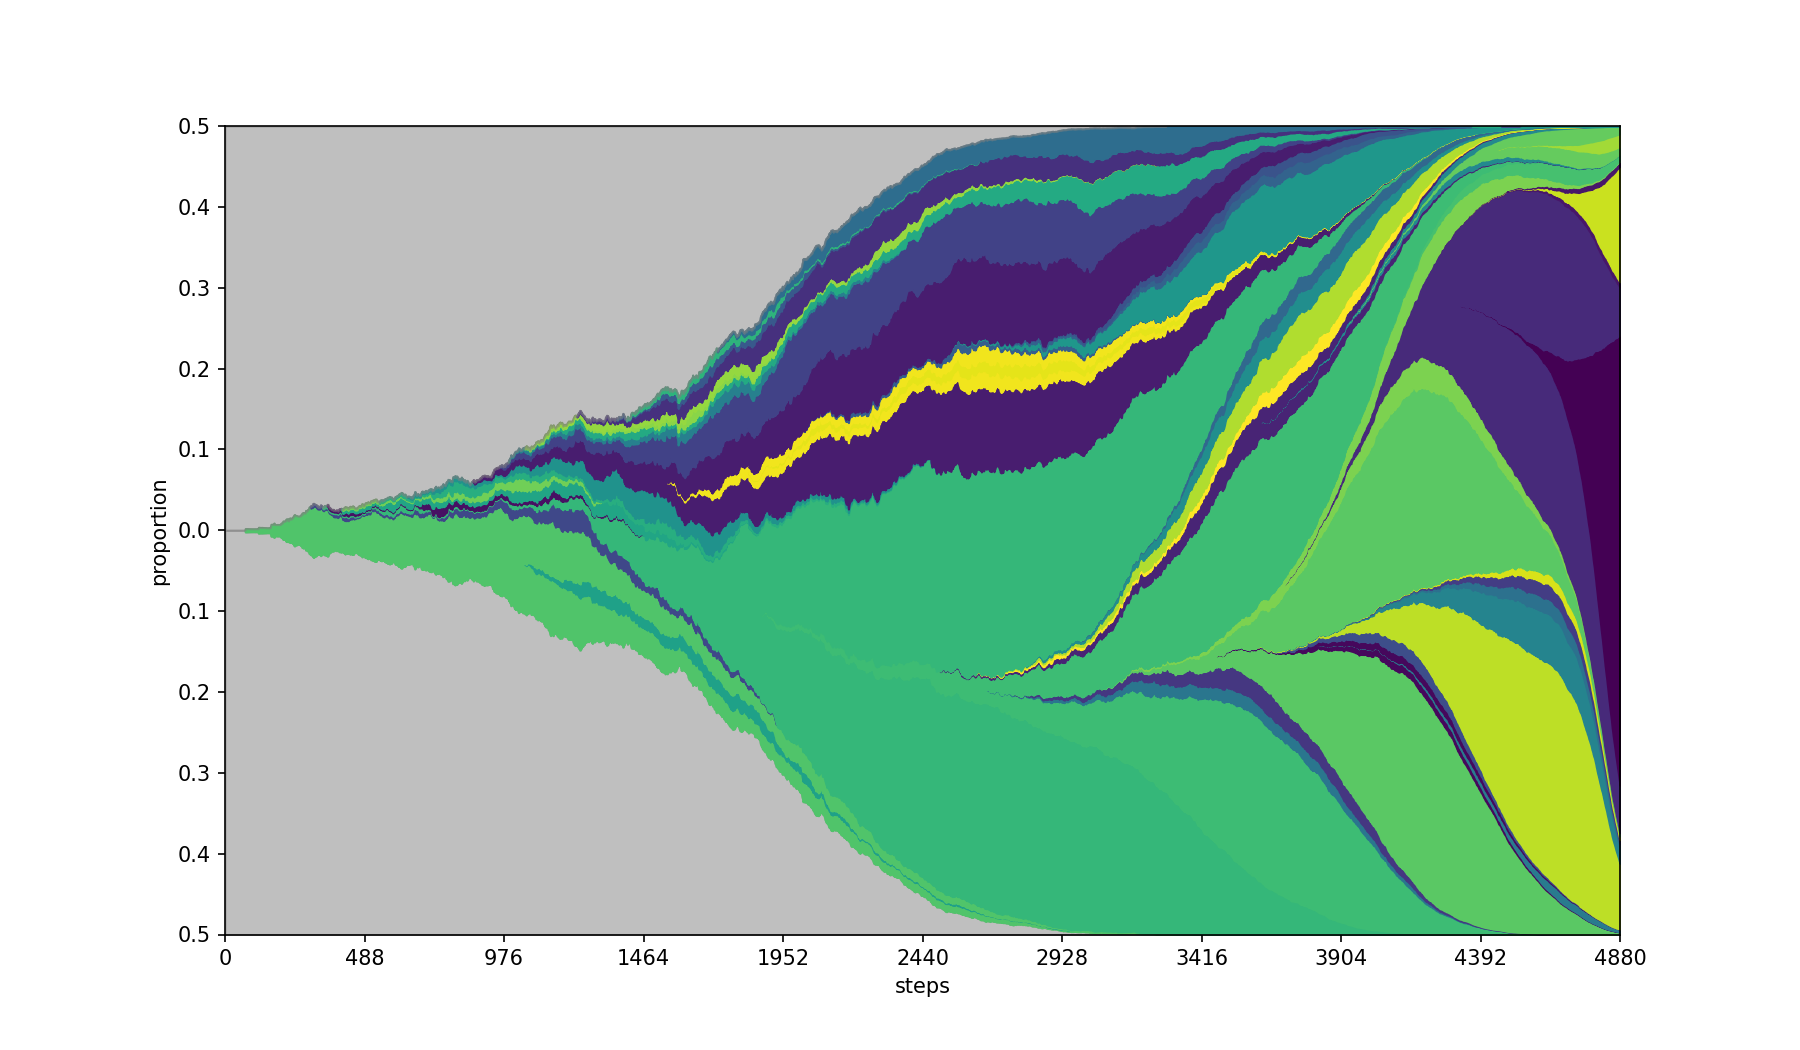
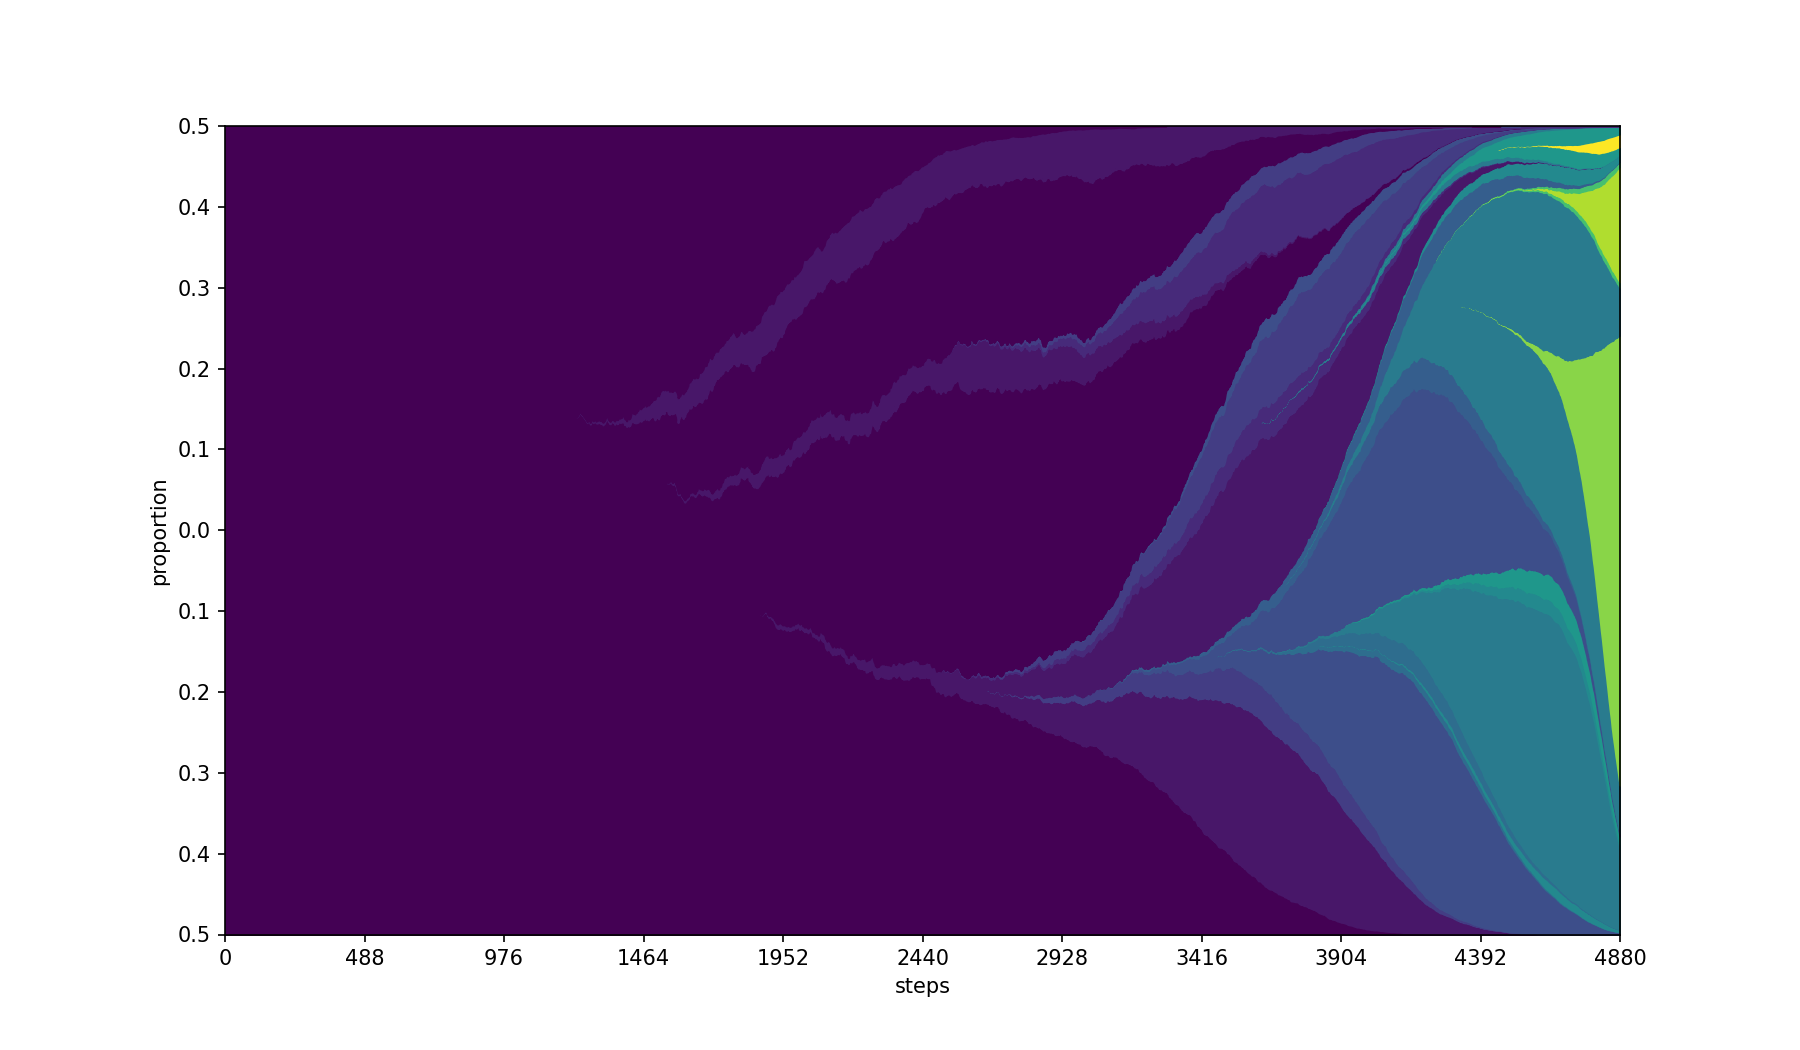
-M, --cmap string
Use the specified matplotlib colormap.
Default colormap is rainbow.
| Base | --cmap viridis |
|---|---|
|
 |
-C, --color-by string
Color the ids based on a separate column in the populations.csv file. It will select the first value of the column per id, so the value should be constant for all entries with the same id.
Best combined with a sequential colormap using --cmap
| Base | --color-by Feature --cmap viridis |
|---|---|
|
 |
-R, --seed int+
Specifies the seed for the randomization of colors.
| Base | --seed 2022 |
|---|---|
|
 |
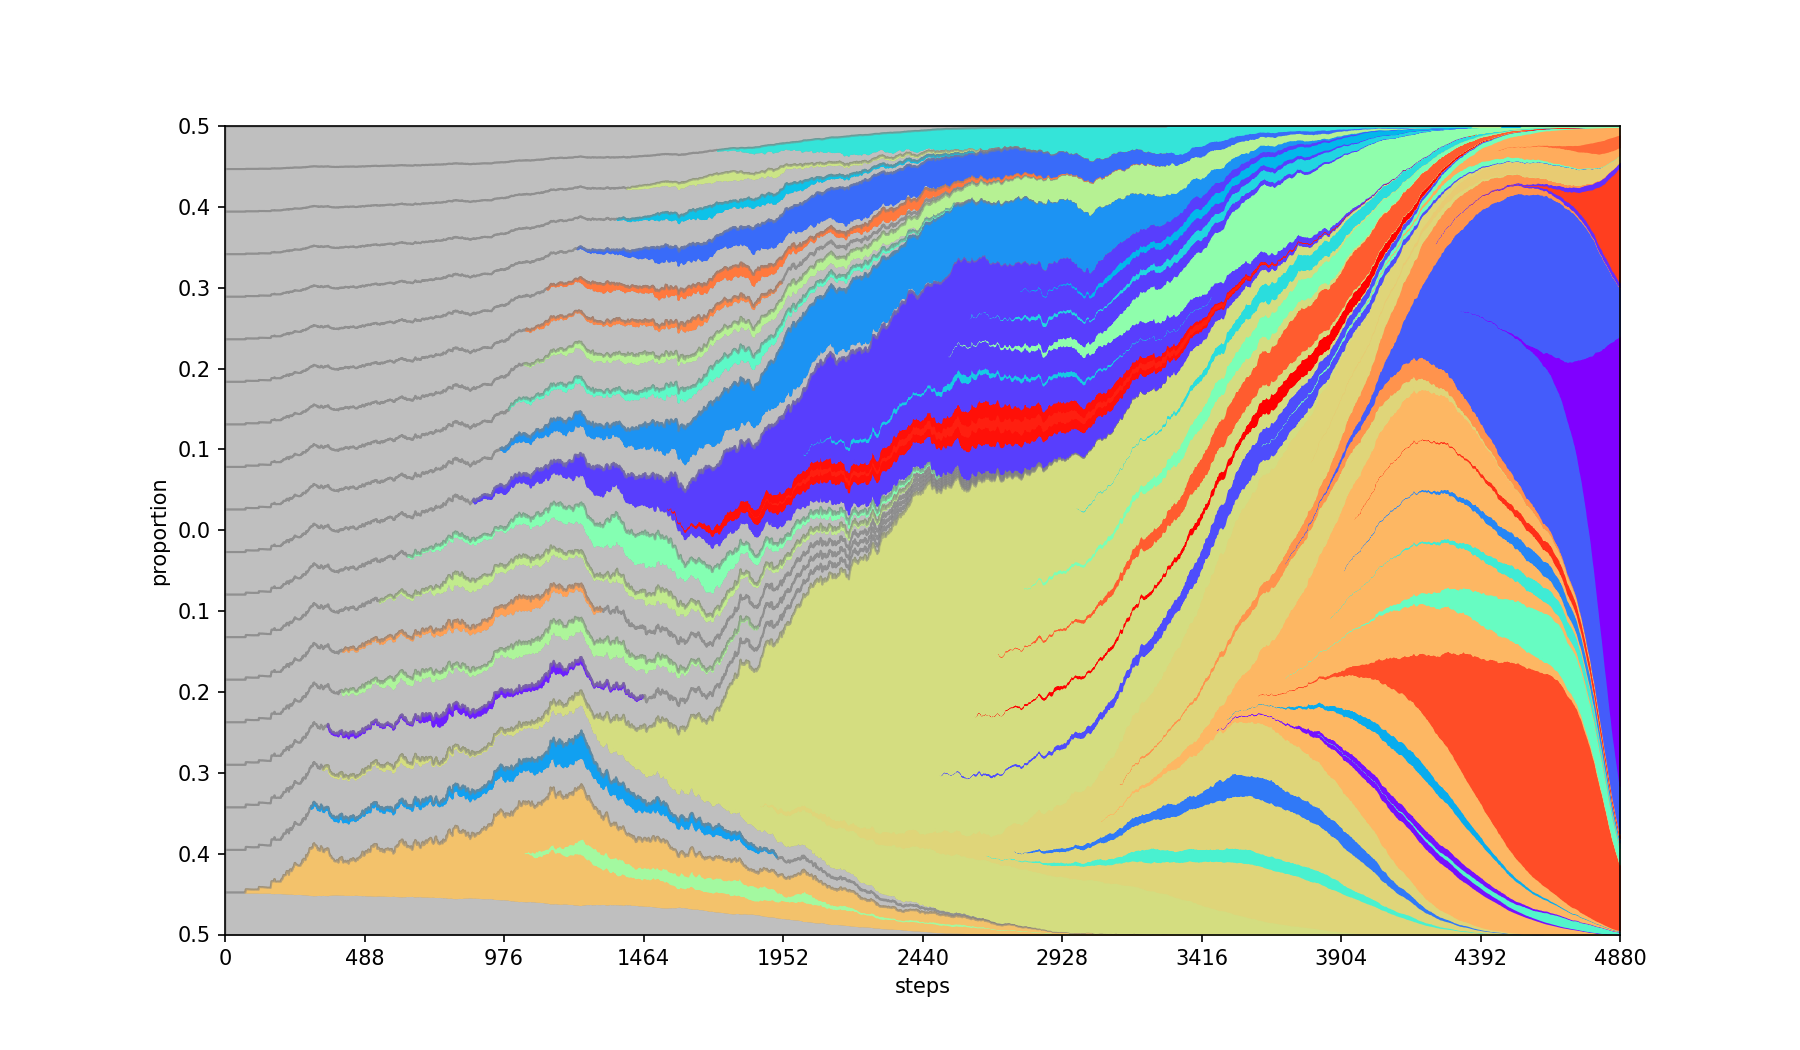
-E, --separate
Places children equidistant from each other within their parent band. By default, children emerge from the center of the parent.
| Base | --separate |
|---|---|
|
 |
-W, --width int+, -H, --height int+
Specifies the dimensions for the output image. The size is including the axes' labels.
Citation
Please cite as: Adam Streck, Tom L Kaufmann, Roland F Schwarz, SMITH: Spatially Constrained Stochastic Model for Simulation of Intra-Tumour Heterogeneity, Bioinformatics, 2023; https://doi.org/10.1093/bioinformatics/btad102
Credits
Authors: Adam Streck, Tom L. Kaufmann
Current contact: Adam Streck
Supervised by: Roland F. Schwarz
License
PyFish is available under the MIT License.
Development
To actively develop the package, we recommend to install pyfish in development mode using pip pip install -e . --user.
In order to run the main routine from the command line without installing it first, run python -m pyfish.main -- tests/populations.csv tests/parent_tree.csv out.png.
Tests
To trigger testing, run pytest -v .
Docs
To generate the docs, run python ./tests/generate_doc_images.py


Download files
Download the file for your platform. If you're not sure which to choose, learn more about installing packages.
Source Distribution
Built Distribution
Filter files by name, interpreter, ABI, and platform.
If you're not sure about the file name format, learn more about wheel file names.
Copy a direct link to the current filters
File details
Details for the file pyfish-1.1.1.tar.gz.
File metadata
- Download URL: pyfish-1.1.1.tar.gz
- Upload date:
- Size: 15.7 kB
- Tags: Source
- Uploaded using Trusted Publishing? No
- Uploaded via: twine/6.2.0 CPython/3.11.7
File hashes
| Algorithm | Hash digest | |
|---|---|---|
| SHA256 |
9c5b1da5e3c17f722c4b98356d0e9bf8b8725dfbfc1ee2d83344781a21b90096
|
|
| MD5 |
5ed35300871a6ae79f5307083a07b251
|
|
| BLAKE2b-256 |
4f959b7aa6df5ea7581f4b16973853d5ad78a7ae6ad3f3fc1f5856ec044babe9
|
File details
Details for the file pyfish-1.1.1-py3-none-any.whl.
File metadata
- Download URL: pyfish-1.1.1-py3-none-any.whl
- Upload date:
- Size: 11.1 kB
- Tags: Python 3
- Uploaded using Trusted Publishing? No
- Uploaded via: twine/6.2.0 CPython/3.11.7
File hashes
| Algorithm | Hash digest | |
|---|---|---|
| SHA256 |
7ef6fe5666c836d82951c70be38bb167383d86fa3e0b2250d3682ad71b15d970
|
|
| MD5 |
ec66f6b5803ae96b8ba09e9d8a7f11f2
|
|
| BLAKE2b-256 |
8ad44ea93732cfbc32c44c97a067b7d048e327a1320e6b69231b42a161eca932
|


