
pygameChart
Introduction
Welcome to pygameChart! This package provides a simple and flexible way to create charts and plots within a pygame application. With pygameChart, you can easily visualize data and display in your applications in an appealing way. Its structure to define figure parameters and charts is similar to matplotlib for ease of use.
- Support for line plots, bar charts, and scatter plots (more on the way)
- Customization options for chart appearanve and behavior
- Easy integration within pygame event loop, therefore ability to change content during the game and/or app I hope pygameChart will be useful addition to your pyhame projects. Continue reading for installation and use of the package
Installation
Please consider project page on Github, https://github.com/enessafak/pygameChart. The module requires python>=3.9.10 and pygame>=2.1.2
Quickstart
pygameChart provides a simple use (similar to matplotlib) to create figure, set properties (like title, label names, chart limits etc.) and add several charts. In this phase it supports line plot, scatter plot and bar charts. Also in this phase, it accepts x and y axis data as two separate lists. I will add support for accepting different datatypes like dictionary numpy arrays or pandas series and dataframes.
Basic use of the package creates following result.
Basic figure with line chart
import pygame, sys
import pygame_chart as pyc

# pygame app for figure to run
pygame.init()
screen = pygame.display.set_mode((800,600))

# Figure instance on screen with position and size
figure = pyc.Figure(screen, 50, 50, 700, 500)

while True:
    events = pygame.event.get()
    for event in events:
        if event.type == pygame.QUIT:
            pygame.quit()
            sys.exit()

    # add a line chart. First argument "name" should be unique for every chart
    figure.line('Chart1', [1,2,3,4,6,20,24],[3,5,7,2,7,9,1])
    # draw figure with specified properties
    figure.draw()
    pygame.display.update()
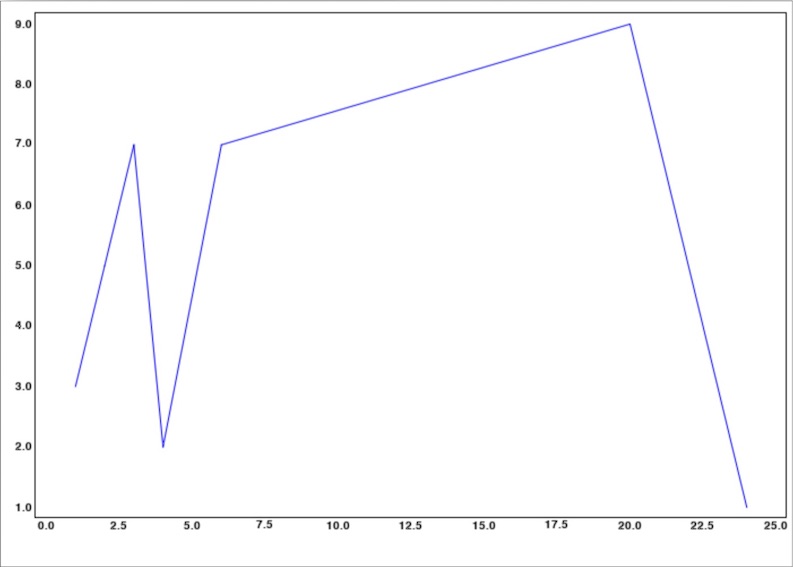
Figure with several charts and properties
import pygame, sys
import pygame_chart as pyc

# pygame app for figure to run
pygame.init()
screen = pygame.display.set_mode((800,600))

# Figure instance on screen with position and size
figure = pyc.Figure(screen, 50, 50, 700, 500)

while True:
    events = pygame.event.get()
    for event in events:
        if event.type == pygame.QUIT:
            pygame.quit()
            sys.exit()

    # Add chart title with a title
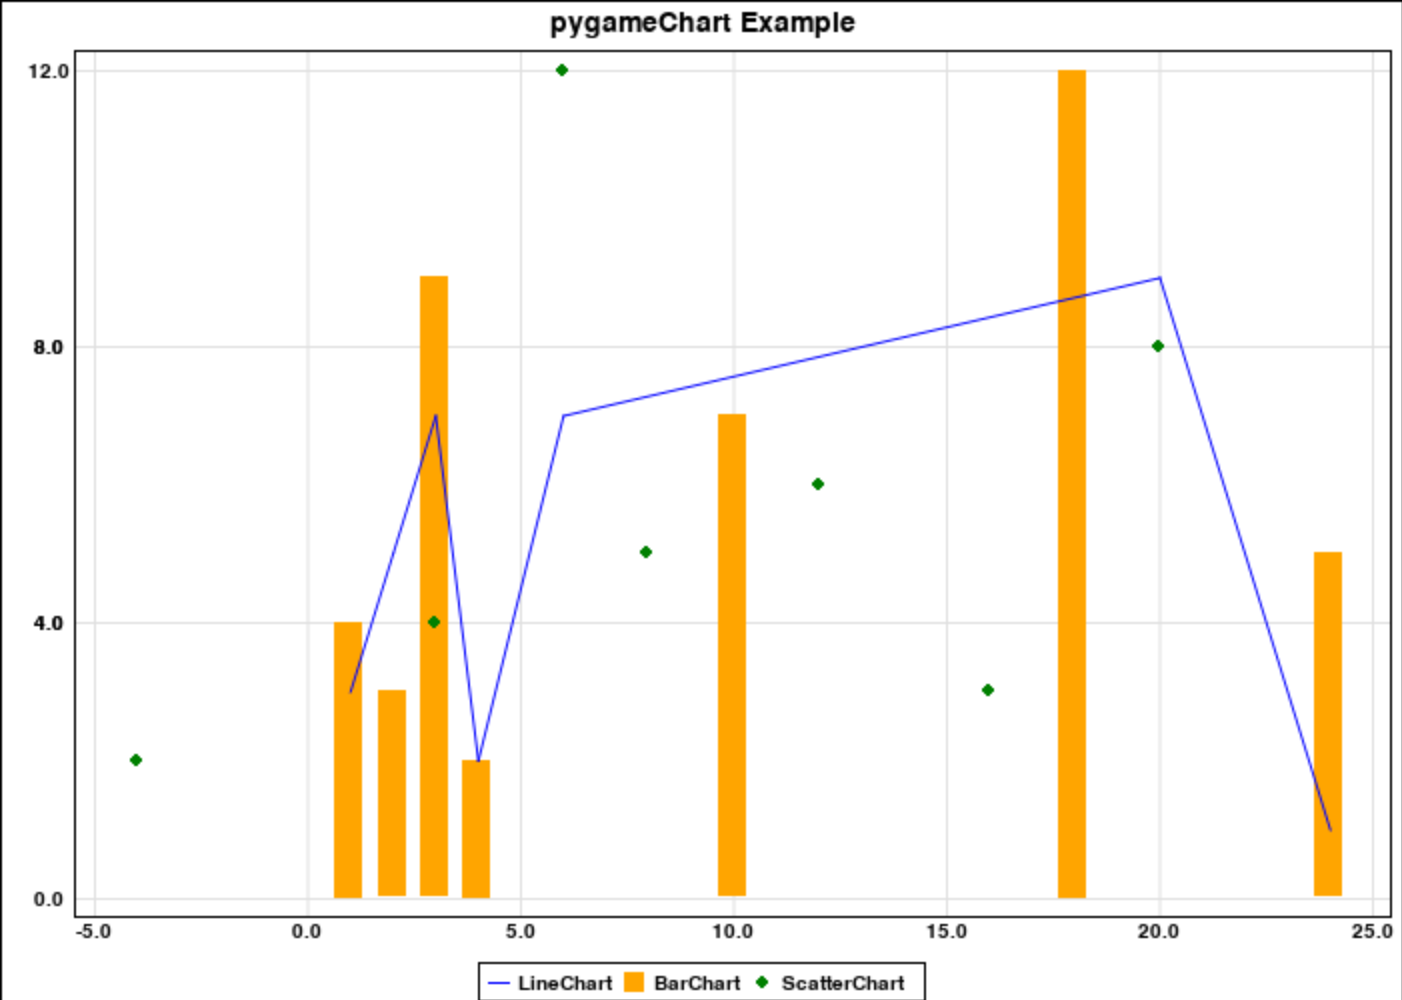
    figure.add_title('pygameChart Example')
    # Add legend and gridlimes
    figure.add_legend()
    figure.add_gridlines()
    # add a line chart. First argument "name" should be unique for every chart
    figure.line('LineChart', [1,2,3,4,6,20,24],[3,5,7,2,7,9,1])
    figure.bar('BarChart', [1,2,3,4,10,18,24],[4,3,9,2,7,12,5])
    figure.scatter('ScatterChart', [-4,3,6,8,12,16,20],[2,4,12,5,6,3,8])
    # draw figure with specified properties
    figure.draw()
    pygame.display.update()
Documentation
This documentation provides classes in pygameChart with relative methods and attributes. Default values for initiations are given as global variables and can be modified in settings.py. Only class the end user should use is Figure class. For the rest, only relevant method or attributes will be mentioned.
Figure class
pygameChart.Figure(screen, x, y, width, height, bg_color=BG_COLOR)
Parameters
| Parameter | Type | Explanation |
|---|---|---|
| screen | pygame.display | Main display for figure to be drawn |
| x | number | Position of figure at x axis |
| y | number | Position of figure at y axis |
| width | number | Width of the figure |
| height | number | Height of the figure |
| bg_color | RGB tuple (r,g,b) | Background color of the figure |
Methods
- set_xlim(xlim) : Sets xmin and xmax for all charts. Drawings out of these limits are unvisible
- xlim : tuple : (xmin, xmax)
- set_ylim(ylim) : Sets ymin and ymax for all charts. Drawings out of these limits are unvisible \
- ylim : tuple : (ymin, ymax)
- add_title(title) : Adds chart title to the top of the figure
- title : string : chart title
- add_legend() : Adds legend to the bottom of the figure
- add_yaxis_label(label) : Adds label for y-axis
- label : string : y-axis label
- add_xaxis_label(label) : Adds label for x-axis
- label : string : x-axis label
- add_gridlines() : Adds gridlines to the figure
- line(name, xdata, ydata, color=None, line_width=2) : Adds line chart to the figure
- name : string : Name of the chart. Name of each chart should be unique to be drawn. Otherwise, former chart data is updated with the latter
- xdata : list : x-axis data. List must be all numbers or all strings
- ydata : list : y-axis data. List must be all numbers
- color : tuple : RGB tuple (r,g,b). Default value chooses the next unused color from settings.py
- line_width : int : Width of the line
- bar(name, xdata, ydata, color=None, bar_width=None) : Adds bar chart to the figure
- name : string : Name of the chart. Name of each chart should be unique to be drawn. Otherwise, former chart data is updated with the latter
- xdata : list : x-axis data. List must be all numbers or all strings
- ydata : list : y-axis data. List must be all numbers
- color : tuple : RGB tuple (r,g,b). Default value chooses the next unused color from settings.py
- bar_width : int : Width of the bar. If none, bar width is calculated according to figure size and x data range
- scatter(name, xdata, ydata, color=None, radius=3): Adds scatter chart to the figure
- name : string : Name of the chart. Name of each chart should be unique to be drawn. Otherwise, former chart data is updated with the latter
- xdata : list : x-axis data. List must be all numbers or all strings
- ydata : list : y-axis data. List must be all numbers
- color : tuple : RGB tuple (r,g,b). Default value chooses the next unused color from settings.py
- radius : int : Radius of the circle
- draw() : Draws the figure with set properties and charts. Final method to draw and show the figure on screen
Area class
Base object for figure areas: title, legend, x-y axis labels, x-y axis ticks and chart area
pygameChart.Area(figure)
Attributes
| Attribute | Type | Explanation |
|---|---|---|
| figure | pygame.Chart.Figure | Main Figure object |
| x | number | Position of area at x axis (rel. to figure) |
| y | number | Position of area at y axis (rel. to figure) |
| width | number | Width of the area |
| height | number | Height of the area |
| innerx | number | Inner x position for padding |
| innery | number | Inner x position for padding |
| innerwidth | number | Inner width for padding |
| innerheight | number | Inner height for padding |
| show | boolean | draw condition for the area |
Methods
- draw_area() : Draws the area on figure background, with figure.bg_color fill
- draw_area_border(): Draws the area on figure background, with border, without fill
Title(Area) Class
Class for adding and writing chart title
Legend(Area) Class
Class for calculating legend position, content and writing
yAxisLabel(Area) Class
Class for adding and writing y-axis label
xAxisLabel(Area) Class
Class for adding and writing x-axis label
yAxisTick(Area) Class
Class for calculating x-tick position, content and writing
Attributes
| Attribute | Type | Explanation |
|---|---|---|
| ymin | number | Min value for y-ticks. Might be different than chart data. Overwritten by Figure.ylim |
| ymax | number | Min value for y-ticks. Might be different than chart data. Overwritten by Figure.ylim |
xAxisTick(Area) Class
Class for calculating y-tick position, content and writing
Attributes
| Attribute | Type | Explanation |
|---|---|---|
| xmin | number | Min value for xx-ticks. Might be different than chart data. Overwritten by Figure.xlim |
| xmax | number | Min value for x-ticks. Might be different than chart data. Overwritten by Figure.xlim |
ChartArea(Area) Class
Class for calculating chart positioning and drawing
Attributes
| Attribute | Type | Explanation |
|---|---|---|
| charts | list | List of chart objects added to the figure |
| chart_names | list | List of chart names added to the figure |
| chart_margin | int | Padding for left and right border |
| xdata_type | str | Indicates the type of xdata (number or string). If figure.xlim is set, it becomes number. Otherwise, it is determined by the first chart to be added. Charts with other type of xdata cannot be added later |
| gridlines | boolean | If gridlines will be added to the figure |
ChartType Class
Base class for all chart types
LineChart(ChartType) Class
Class for keeping properties of line chart. Drawing is done within Figure.ChartArea
Parameters
| Parameter | Type | Explanation |
|---|---|---|
| name | string | Name of the chart |
| xdata | list | x-axis data. List must be all numbers or all strings |
| ydata | list | y-axis data. List must be all numbers |
| color | tuple | RGB tuple (r,g,b). Default value chooses the next unused color from settings.py |
| line_width | int | Width of the line |
BarChart(ChartType) Class
Class for keeping properties of bar chart. Drawing is done within Figure.ChartArea
Parameters
| Parameter | Type | Explanation |
|---|---|---|
| name | string | Name of the chart |
| xdata | list | x-axis data. List must be all numbers or all strings |
| ydata | list | y-axis data. List must be all numbers |
| color | tuple | RGB tuple (r,g,b). Default value chooses the next unused color from settings.py |
| bar_width | int | Width of the bar. If none, bar width is calculated according to figure size and x data range |
ScatterChart(ChartType) Class
Class for keeping properties of scatter chart. Drawing is done within Figure.ChartArea
Parameters
| Parameter | Type | Explanation |
|---|---|---|
| name | string | Name of the chart |
| xdata | list | x-axis data. List must be all numbers or all strings |
| ydata | list | y-axis data. List must be all numbers |
| color | tuple | RGB tuple (r,g,b). Default value chooses the next unused color from settings.py |
| radius | int | Radius of the circle |
License
The MIT License (MIT)
Copyright (c) 2023
Permission is hereby granted, free of charge, to any person obtaining a copy of this software and associated documentation files (the "Software"), to deal in the Software without restriction, including without limitation the rights to use, copy, modify, merge, publish, distribute, sublicense, and/or sell copies of the Software, and to permit persons to whom the Software is furnished to do so, subject to the following conditions:
The above copyright notice and this permission notice shall be included in all copies or substantial portions of the Software.
THE SOFTWARE IS PROVIDED "AS IS", WITHOUT WARRANTY OF ANY KIND, EXPRESS OR IMPLIED, INCLUDING BUT NOT LIMITED TO THE WARRANTIES OF MERCHANTABILITY, FITNESS FOR A PARTICULAR PURPOSE AND NONINFRINGEMENT. IN NO EVENT SHALL THE AUTHORS OR COPYRIGHT HOLDERS BE LIABLE FOR ANY CLAIM, DAMAGES OR OTHER LIABILITY, WHETHER IN AN ACTION OF CONTRACT, TORT OR OTHERWISE, ARISING FROM, OUT OF OR IN CONNECTION WITH THE SOFTWARE OR THE USE OR OTHER DEALINGS IN THE SOFTWARE.
1 maintainer

Release files for pygame-chart 1.0.0
For a detailed explanation of source distributions (sdists) and built distributions (wheels), please see the package formats documentation.
Source distribution (sdist)
| File | Size | Uploaded | |
|---|---|---|---|
| pygame_chart-1.0.0.tar.gz | 16.5 kB | Details |
Built distribution (wheel)
| File | Interpreter | ABI | Platform | Reset |
|---|---|---|---|---|
| pygame_chart-1.0.0-py3-none-any.whl | Python 3 | none | any | Details |
Total release size: 30.6 kB
Release files / pygame_chart-1.0.0.tar.gz
| Download URL | pygame_chart-1.0.0.tar.gz |
|---|---|
| Size | 16.5 kB |
| Tags | Source |
|
SHA-256 checksum How to use checksums |
714db86556ced592cdfc2b5c5255faf5c1c8c6a761bbd785d5428cdfd94d392b
|
|
BLAKE2b-256 checksum How to use checksums |
d194006a4e6e3a6a1005ca0048a777485b88547fbba0d5292a3abaf548db9c33
|
| Upload date | |
|
Uploaded using Trusted Publishing? What is trusted publishing? |
No |
| Uploaded via |
twine/4.0.2 CPython/3.9.10
|
Release files / pygame_chart-1.0.0-py3-none-any.whl
| Download URL | pygame_chart-1.0.0-py3-none-any.whl |
|---|---|
| Size | 14.1 kB |
| Tags | Python 3 |
|
SHA-256 checksum How to use checksums |
24feef89f7eb820288d3c9c81b1c8359a829a9ed1f6be0711a96cf4be065d1bb
|
|
BLAKE2b-256 checksum How to use checksums |
e7dfbf27d1c24322e4c1744e56bca7064ac44aae34cd16b976029a5a2da9091f
|
| Upload date | |
|
Uploaded using Trusted Publishing? What is trusted publishing? |
No |
| Uploaded via |
twine/4.0.2 CPython/3.9.10
|













