

PyL7Plot
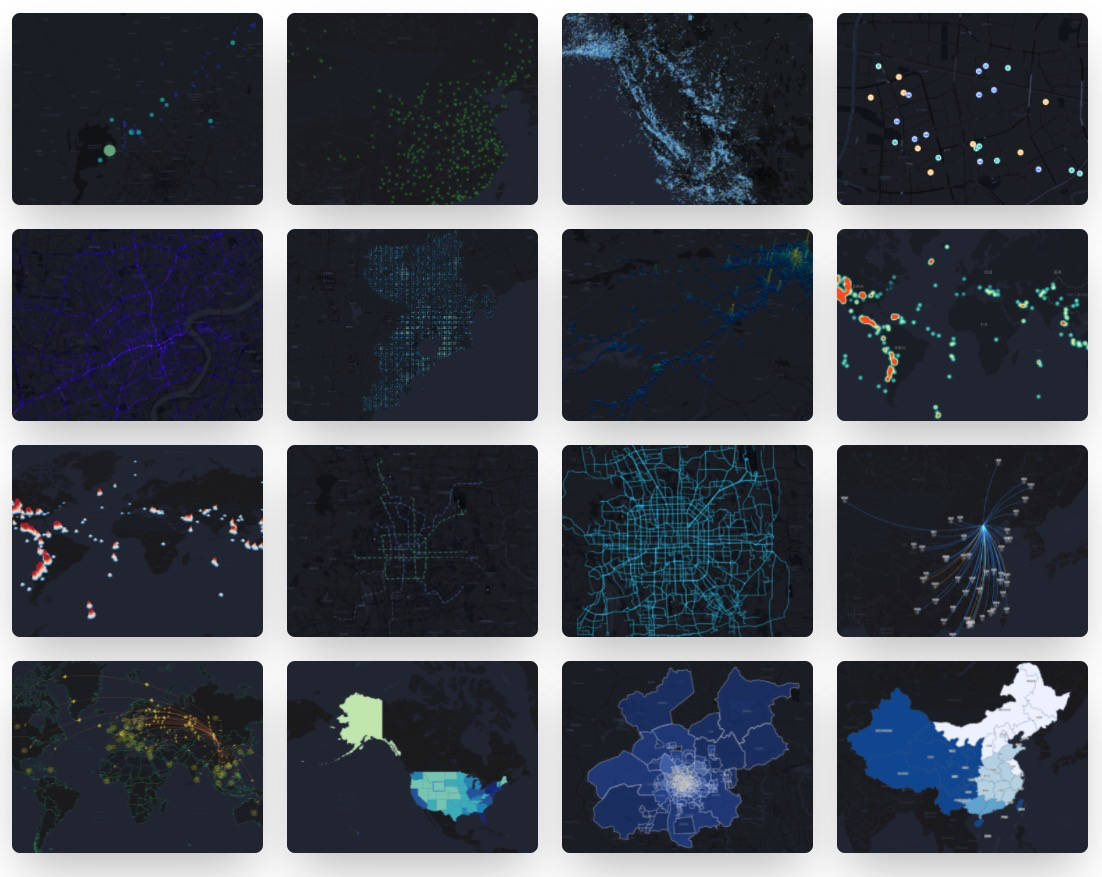
🌍 Python3 binding for @AntV/L7Plot Plotting Library. Geospatial Visualization Chart Library Based on @AntV/L7. Inspired by PyG2Plot.



Installation
$ pip install pyl7plot
Usage
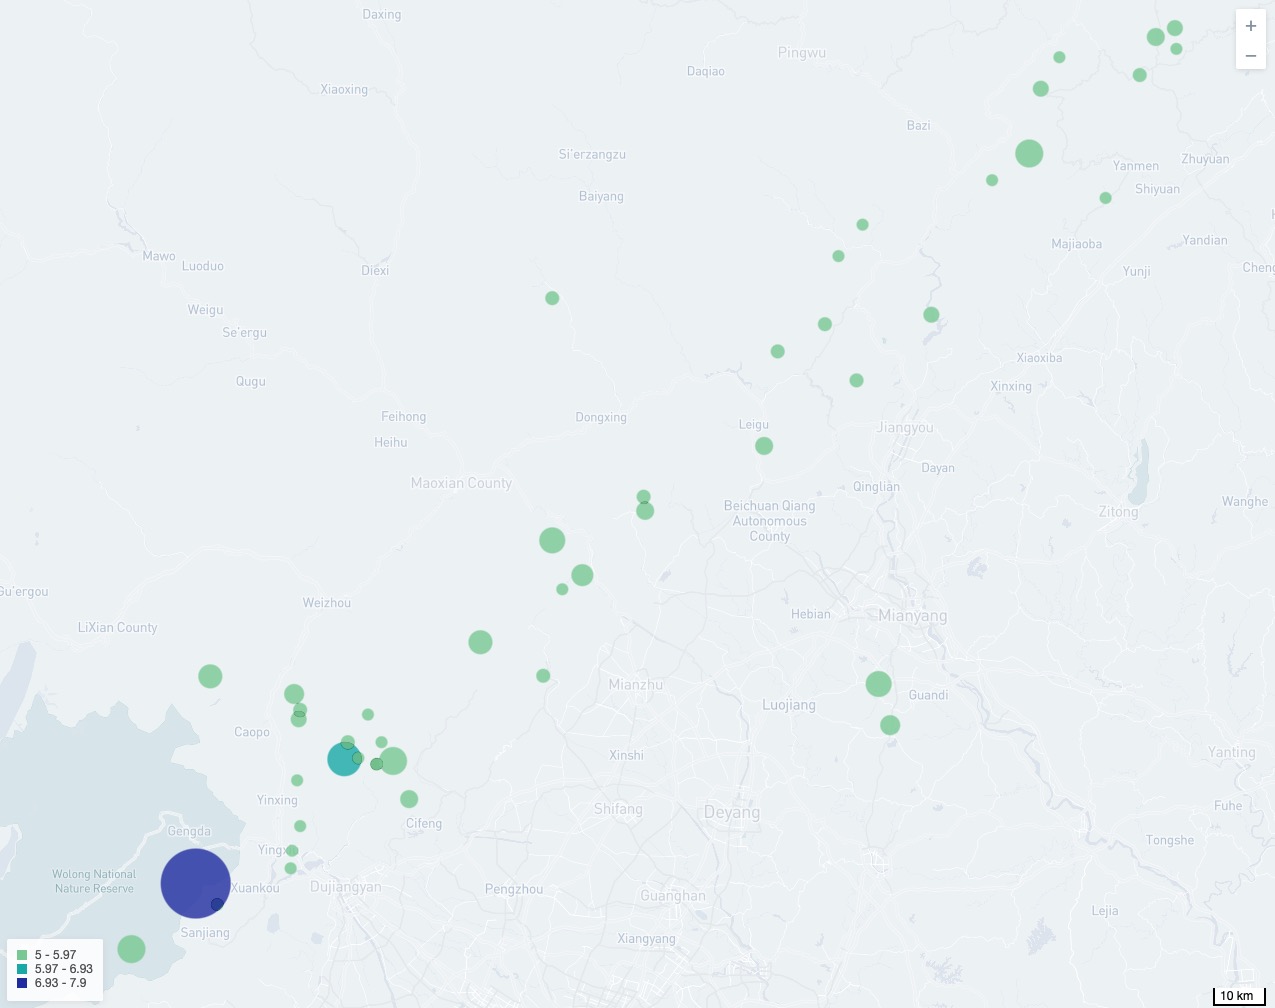
Render to HTML
from pyl7plot import Plot

dot = Plot("Dot")

dot.set_options({
  "map": {
    "type": "mapbox",
    "style": "light",
    "center": [103.447303, 31.753574],
    "zoom": 7,
  },
  "autoFit": True,
  "source": {
    "data": [
       { "lng": 103.715, "lat": 31.211, "depth": 10, "mag": 5.8, "title": "M 5.8 - eastern Sichuan, China" },
       { "lng": 104.682, "lat": 31.342, "depth": 10, "mag": 5.7, "title": "M 5.7 - eastern Sichuan, China" },
       # ...
    ],
    "parser": { "type": "json", "x": "lng", "y": "lat" },
  },
  "color": {
    "field": "mag",
    "value": ["#82cf9c", "#10b3b0", "#2033ab"],
    "scale": { "type": "quantize" },
  },
  "size": {
    "field": "mag",
  },
  "state": { "active": True },
  "scale": { "position": "bottomright" },
  "legend": { "position": "bottomleft" },
  "tooltip": {
    "items": ["title", "mag", "depth"],
  },
})

# Render html file
dot.render("dot.html")

# Or render html string
# dot.render_html()
Render in Jupyter
from pyl7plot import Plot, JS

dot = Plot("Dot")

dot.set_options({
  "map": {
    "type": "mapbox",
    "style": "light",
    "center": [103.447303, 31.753574],
    "zoom": 7,
  },
  "autoFit": True,
  "height": 400, # set a default height in jupyter preview
  "source": {
    "data": [
       { "lng": 103.715, "lat": 31.211, "depth": 10, "mag": 5.8, "title": "M 5.8 - eastern Sichuan, China" },
       { "lng": 104.682, "lat": 31.342, "depth": 10, "mag": 5.7, "title": "M 5.7 - eastern Sichuan, China" },
       # ...
    ],
    "parser": { "type": "json", "x": "lng", "y": "lat" },
  },
  "color": {
    "field": "mag",
    "value": ["#82cf9c", "#10b3b0", "#2033ab"],
    "scale": { "type": "quantize" },
  },
  "size": {
    "field": "mag",
    # Use JS API, you can use JavaScript syntax for callback.
    "value": JS('''function({ mag }) {
        return (mag - 4.3) * 10;
      }''')
  },
  "state": { "active": True },
  "scale": { "position": "bottomright" },
  "legend": { "position": "bottomleft" },
  "tooltip": {
    "items": ["title", "mag", "depth"],
  },
})

# Render in notebook
dot.render_notebook()

# Or render in jupyter lab
# dot.render_jupyter_lab()
More Online Examples PyL7plot in Jupyter Lab.
API
- Plot
-
Plot(plot_type: str): get an instance of
Plotclass. -
plot.set_options(options: object): set the options of L7Plot into instance.
-
plot.render(path, env, **kwargs): render out html file by setting the path, jinja2 env and kwargs.
-
plot.render_notebook(env, **kwargs): render plot on jupyter preview.
-
plot.render_jupyter_lab(env, **kwargs): render plot on jupyter lab preview.
-
plot.render_html(env, **kwargs): render out html string by setting jinja2 env and kwargs.
协议
1 maintainer

Metadata
1 maintainer
Release files for pyl7plot 0.0.5
For a detailed explanation of source distributions (sdists) and built distributions (wheels), please see the package formats documentation.
Built distribution (wheel)
| File | Interpreter | ABI | Platform | Reset |
|---|---|---|---|---|
| pyl7plot-0.0.5-py3-none-any.whl | Python 3 | none | any | Details |
Release files / pyl7plot-0.0.5-py3-none-any.whl
| Download URL | pyl7plot-0.0.5-py3-none-any.whl |
|---|---|
| Size | 8.4 kB |
| Tags | Python 3 |
|
SHA-256 checksum How to use checksums |
549c3ddc019ce2e90c8decada3b4c02ec8d62af478a98e44edd5a1d59ea0a0a0
|
|
BLAKE2b-256 checksum How to use checksums |
5058d8b5f209499631cc4f1078e8058942edc7ae79b84a3b0cd4b5806bc669dc
|
| Upload date | |
|
Uploaded using Trusted Publishing? What is trusted publishing? |
No |
| Uploaded via |
twine/3.8.0 pkginfo/1.8.2 readme-renderer/34.0 requests/2.27.1 requests-toolbelt/0.9.1 urllib3/1.26.9 tqdm/4.63.1 importlib-metadata/4.8.3 keyring/23.4.1 rfc3986/1.5.0 colorama/0.4.4 CPython/3.6.13
|














