`pylabeladjust` is a port of Gephi's Label-Adjust algorithm to python.

Project description
pylabeladjust
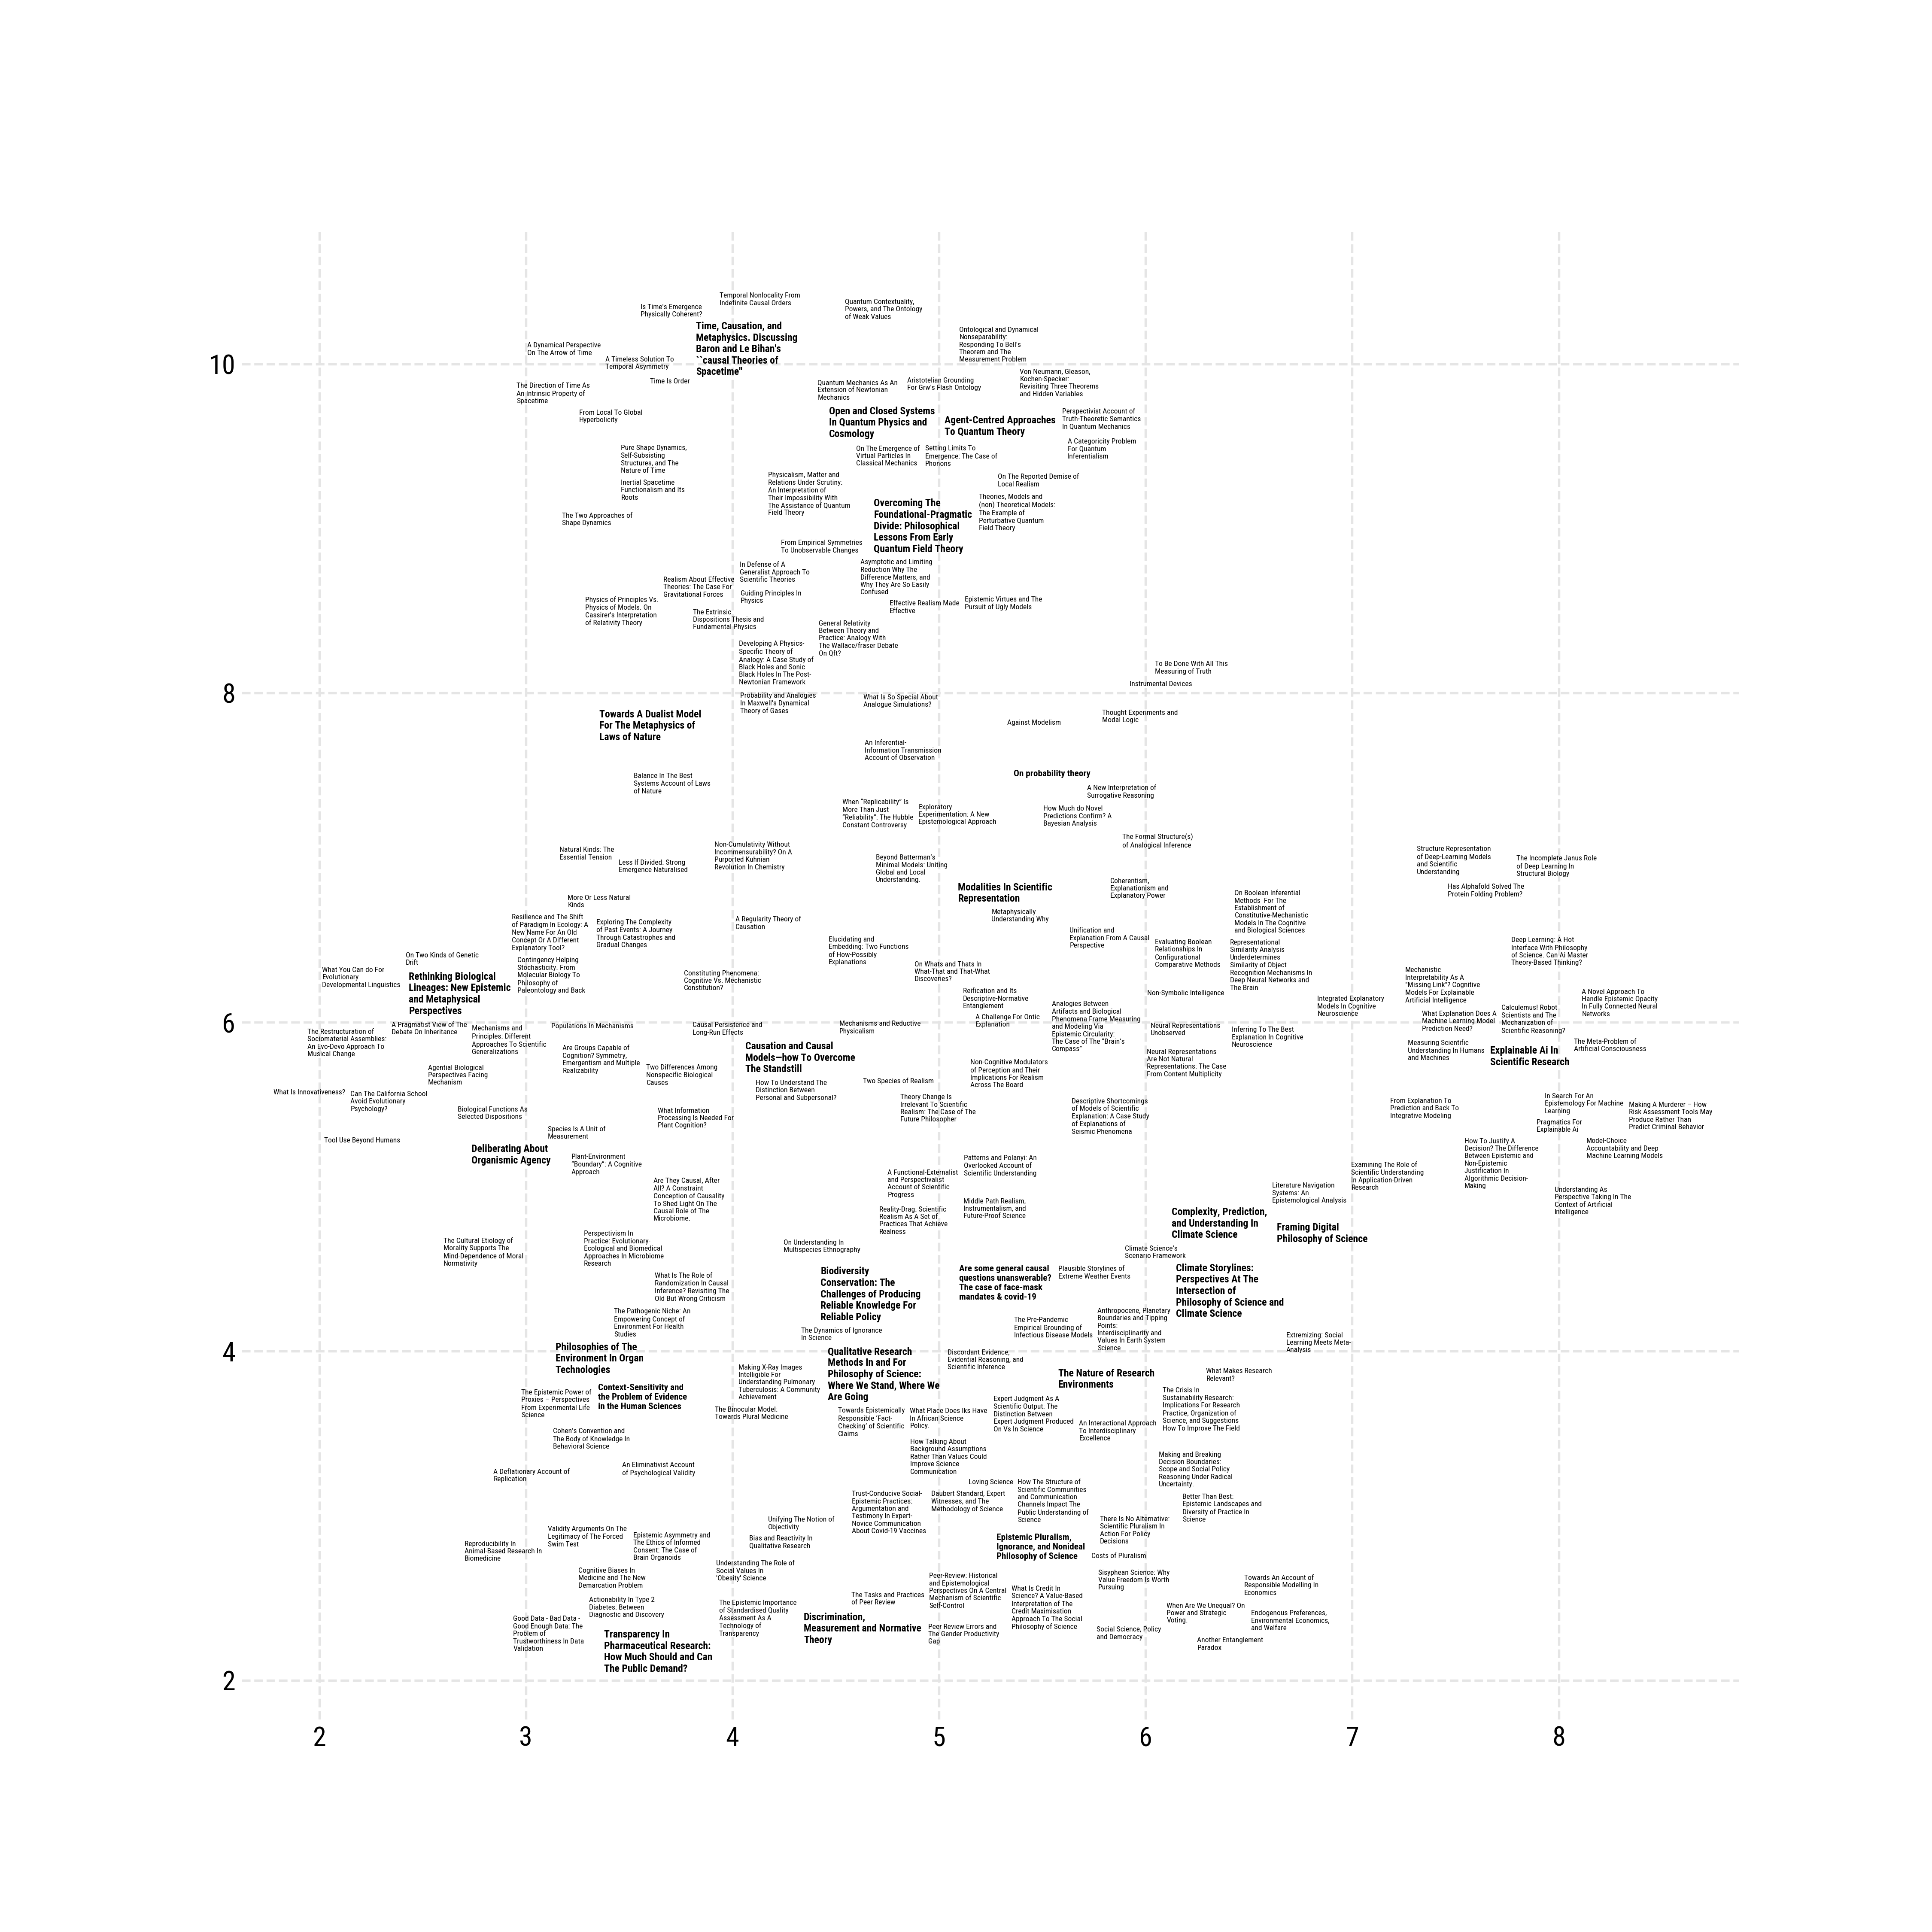
pylabeladjust is a port of Gephi's really good Label-Adjust algorithm by Mathieu Jacomy to python. It makes labels in matplotlib-plots not overlap by carefully pushing them apart, as illustrated by this video:
Pylabeladjust uses pyqtree, by Karim Bahgat, in the background for efficient overlap-querying. The setup of the pylabeladjust-plotting code takes inspiration from adjust_text, by Ilya Flyamer.
When to use pylabeladjust
pylabeladjust currently is meant for cases in which it is fine for your labels to move around little bit as in network-graphics or UMAP/t-SNE-plots, without any additional constraints. It should be able to handle cases where you have large numbers (1000+) of labels with a lot of overlap in reasonably small amounts of time. This makes it an alternative to adjust_text for this specific use-case. If you need your labels to conform to more complicated constraints, like not overlapping particular points you might want to look into adjust_text or textalloc , which both can be very useful!
Installation
Installation should be straightforward using:
pip install pylabeladjust
Usage
The full usage of the package is demonstrated in the examples.ipynb notebook. Basic usage might look like this:
fig, ax = plt.subplots(figsize=(15, 15))
ax.scatter(data['x'], data['y'], s=20, alpha=.0, c='#a7510f') # plot a transparant scatterplot, to make the labels show up.
texts = []
for i, row in data.iterrows():
    texts.append(ax.text(row['x'], row['y'], textwrap.fill(row['title'],25) , fontsize=row['fontsize'],ma='left',fontweight=row['fontweight'],zorder=10))
fig.canvas.draw()


rectangles_adjusted = adjust_texts(texts, speed=.03, max_iterations=250, margin_percentage=6, radius_scale=1.03)
plt.show()
Result:
Here's what the parameters mean:
texts(List[matplotlib.text.Text]): A list of text objects to be adjusted.speed(float, optional): The speed of the adjustment process (movement, measured on the scale of the data). If left blank, speed is set to halve the size of the mean text-width. If your labels end up all over the place, you might want to decrease this value. If it looks like the adjustment didn't change much, although the algorithm spent dozens of seconds optimizing, the value might need to be increased.adjust_by_size(bool, optional): Whether to adjust the texts based on their sizes. Defaults to True. This makes the positions of large text-blocks more robust, and shuffles smaller ones around more, which can result in a structurally more convincing layout, and speeds up the algorithms. You should check that small stuff didn't get shuffled away too far though.radius_scale(float, optional): The scale factor for the radius used in the adjustment process. Defaults to 1.1.max_iterations(int, optional): The maximum number of iterations for the adjustment process. Defaults to 200. Increase if your layout still has overlaps after running the adjustment. This can usually be increased liberally because once there is little overlap anymore, the remaining iterations are very fast.plot_progress(bool, optional): Whether to print out plots of the progress of the adjustment process. Defaults to False, and is mostly useful for debugging.margin(int, optional): The the size of the margin to add around the rectangles. Either a percentage, or an absolute value. Defaults to 0.margin_type(str, optional): How to add margins. Options are 'percentage' and 'absolute'. 'percentage' sets the margin as a percentage (given inmargin) of the rectangles size. 'absolute`sets all margins to the same absolute value.return_optimization_process(bool, optional): Whether to return the optimization process, a list of dataframes of all the positions the texts went through in the optimization process. Defaults to False.
The function edits your texts object in place, so you can just resume plotting. Note that it will set your alignment (ha, va) It also will return a dataframe of the new positions, and if return_optimization_process is set to true, a list of dataframes of the intermediate steps.
We can also adjust rectangles which are not labels directly. In that case, the function expects a pandas-dataframe, with the columns x,y,height,width.
The syntax will look very similar to above:
rectangles_adjusted, optimization_process = adjust_labels(data, adjust_by_size=True, radius_scale=1.1, max_iterations=250, margin_percentage=5, return_optimization_process=True)
The parameters of this function are:
rectangle_data(DataFrame): Apandas-dataframe, with the columnsx,y,height,width.speed(float, optional): The speed of the adjustment process (movement, measured on the scale of the data). If left blank, speed is set to halve the size of the mean text-width. If your labels end up all over the place, you might want to decrease this value. If it looks like the adjustment didn't change much, although the algorithm spent dozens of seconds optimizing, the value might need to be increased.adjust_by_size(bool, optional): Whether to adjust the texts based on their sizes. Defaults to True. This makes the positions of large text-blocks more robust, and shuffles smaller ones around more, which can result in a structurally more convincing layout, and speeds up the algorithms. You should check that small stuff didn't get shuffled away too far though.radius_scale(float, optional): The scale factor for the radius used in the adjustment process. Defaults to 1.1.max_iterations(int, optional): The maximum number of iterations for the adjustment process. Defaults to 200. Increase if your layout still has overlaps after running the adjustment. This can usually be increased liberally because once there is little overlap anymore, the remaining iterations are very fast.plot_progress(bool, optional): Whether to print out plots of the progress of the adjustment process. Defaults to False, and is mostly useful for debugging.margin(int, optional): The the size of the margin to add around the rectangles. Either a percentage, or an absolute value. Defaults to 10.margin_type(str, optional): How to add margins. Options are 'percentage' and 'absolute'. 'percentage' sets the margin as a percentage (given inmargin) of the rectangles size. 'absolutesets all margins to the same absolute value.*return_optimization_process` (bool, optional): Whether to return the optimization process, a list of dataframes of all the positions the texts went through in the optimization process. Defaults to False.
To-Do
- Early stopping
- Speed decay (?)
Release history Release notifications | RSS feed


Download files
Download the file for your platform. If you're not sure which to choose, learn more about installing packages.
Source Distribution
Built Distribution
Filter files by name, interpreter, ABI, and platform.
If you're not sure about the file name format, learn more about wheel file names.
Copy a direct link to the current filters
File details
Details for the file pylabeladjust-0.1.13.tar.gz.
File metadata
- Download URL: pylabeladjust-0.1.13.tar.gz
- Upload date:
- Size: 18.3 kB
- Tags: Source
- Uploaded using Trusted Publishing? No
- Uploaded via: poetry/1.8.2 CPython/3.11.5 Darwin/23.3.0
File hashes
| Algorithm | Hash digest | |
|---|---|---|
| SHA256 |
23c1f9f8096c5c7de9fa79678ce729ca3730b88d979997fa24e99c037a48f59b
|
|
| MD5 |
6d24fd3dcb117a9b4bfc4bc7d23bf65d
|
|
| BLAKE2b-256 |
1dece60af07f4aae3706d2e9592b462065b2757557aa23300f21edda7b5a6921
|
File details
Details for the file pylabeladjust-0.1.13-py3-none-any.whl.
File metadata
- Download URL: pylabeladjust-0.1.13-py3-none-any.whl
- Upload date:
- Size: 19.2 kB
- Tags: Python 3
- Uploaded using Trusted Publishing? No
- Uploaded via: poetry/1.8.2 CPython/3.11.5 Darwin/23.3.0
File hashes
| Algorithm | Hash digest | |
|---|---|---|
| SHA256 |
75f031f9296369dcf72a997076160cce6a504ee7cb23b9ab0b111a286644d495
|
|
| MD5 |
464f2221dabd277697dced8084afaaf8
|
|
| BLAKE2b-256 |
3acdb706a538a53b5033a86ebfd85621ab0ba78ba3d8a09fd4060e346e0cfb20
|


