A toolbox for analyzing hydrological drought

Project description
What is pydat?
The Python Drought Analysis Tool (pydat) is a python package that automatically derives multi-year streamflow deficit Severity-Duration-Frequency (SDF) curves from streamflow data and empowers users to effortlessly create SDF curves. Also, it synthesizes daily-scale streamflow time series called streamflow analogs representing those SDFs. Alongside its core function, pydat offers several other useful commands, including:
- Presenting a comprehensive list of the stations in each state or watershed.
- Displaying the streamflow time series of each USGS station.
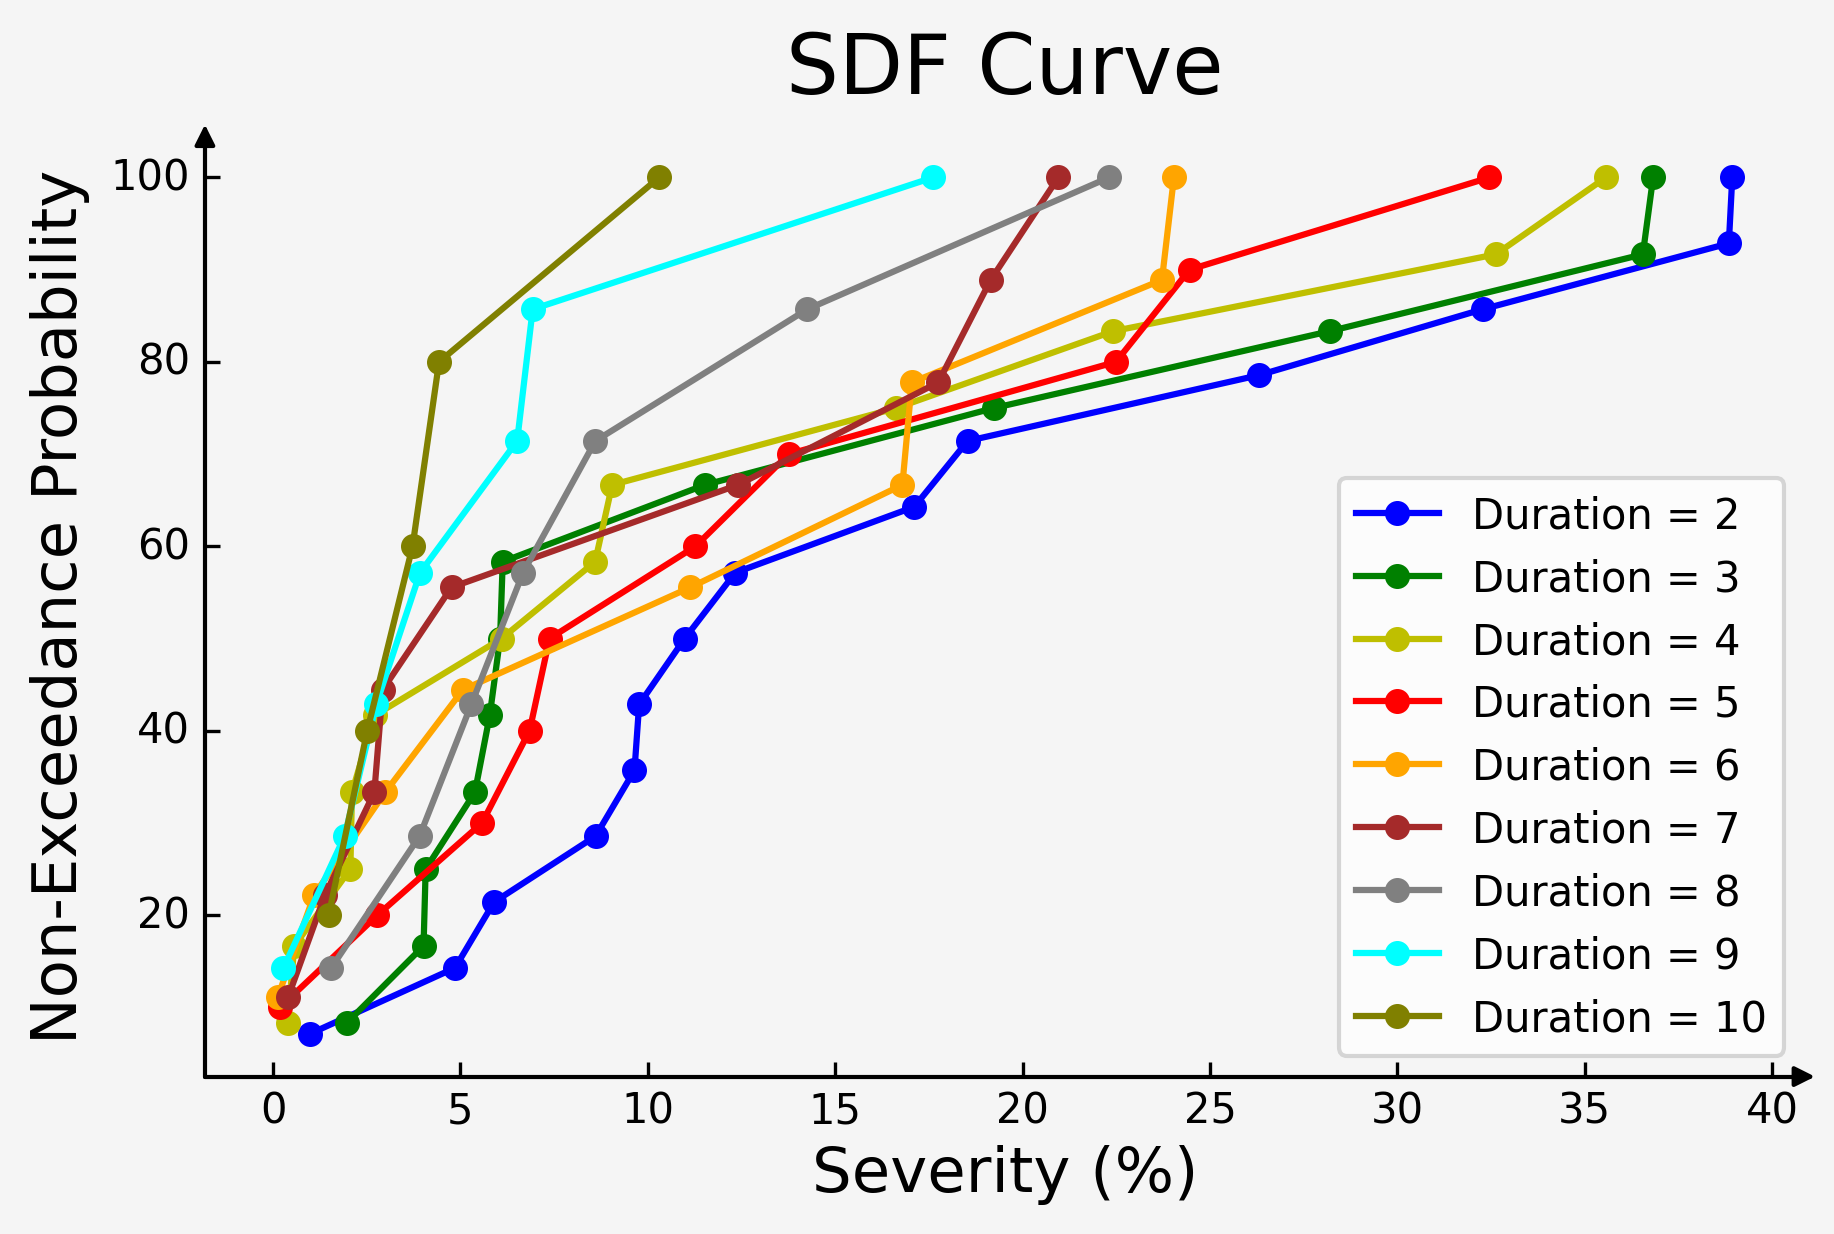
The package has been designed to address the need for streamflow deficit SDFs information and their usage in operational water management amid persistent streamflow drought conditions nationally in the United States (US). The picture below shows a sample of the SDF curves for station 03098600 in the Ohio state.
Rainfall and flood frequency analysis methods are well established and widely used in analysis and design studies, including but not limited to stormwater management and design studies and hydraulic structures designs, etc. In contrast, no standard method(s) exist for persistent streamflow drought analysis and guidelines for water planners and managers to use in water supply planning and management studies. Although indices related to streamflow deficits are available in the literature, their limitation in usage in planning and operational way hinders their adaptation and useability among water planning and management agencies and utilities. Pydat has been developed to bridge this research and operations gap.
Methodology
The first step in using the pydat package is to obtain the daily streamflow time series for a given region of interest. By utilizing a service called the National Water Information System (NWIS) it obtains the daily mean stream values of U.S. Geological Survey (USGS) stream gauge data as its default source. The user can specify the state of interest by providing different inputs such as its two-letter abbreviation, after which all relevant USGS station information and their IDs will be displayed. The pydat package builds upon the python USGS dataretrieval package for data retrieval from the USGS website. Furthermore, it should be noted that pydat can also work with other data sources (such as CSV files) with just a few simple tips about the data table and heading columns, as explained in the upcoming sections.
Once a station is selected, pydat develops multi-year streamflow deficit SDFs for that station, allowing the user to specify the SDF duration. The SDFs are then displayed in both tabular and visual forms for the selected duration. It is important to note that the durations are calculated based on the moving average, and the deficit severity is calculated as a departure from the long-term average flow for each duration.
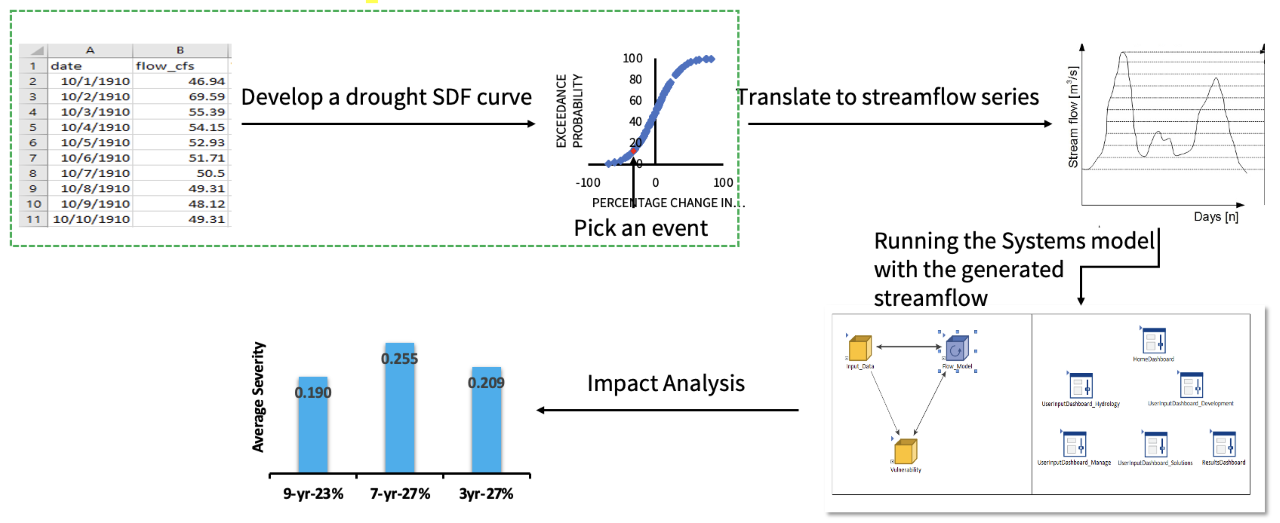
The final step in using pydat is calculating the daily streamflow time series for the points of the developed streamflow deficit SDFs. Since each point on the SDFs represents a specific event of a deficit level, the duration of the deficit, and the return period, a corresponding daily streamflow time series exists for that point. By linking the SDFs with daily resolution streamflow time series, the SDFs can be operationalized, providing water planners and managers with information about the duration, deficit level, and return periods of selected daily streamflow time series. This allows them to test their water supply system’s response to a range of plausible persistent streamflow deficit scenarios. Overall, pydat provides a valuable tool for water planning and management agencies and water researchers in the face of persistent streamflow drought conditions. The figure below shows the steps of the pydat package.
Installation
To use the package first it is required to clone the repository and install the required packages.
The code needed for doing this part in Google Colab is written in the below cells.
Some basic Git commands are:
!git clone https://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@github.com/savalann/pydat.git

%cd pydat/pydat/

!pip3 install -r requirements.txt
Release history Release notifications | RSS feed


Download files
Download the file for your platform. If you're not sure which to choose, learn more about installing packages.
Source Distribution
Built Distribution
Filter files by name, interpreter, ABI, and platform.
If you're not sure about the file name format, learn more about wheel file names.
Copy a direct link to the current filters
File details
Details for the file pyndat-0.0.1.tar.gz.
File metadata
- Download URL: pyndat-0.0.1.tar.gz
- Upload date:
- Size: 12.8 kB
- Tags: Source
- Uploaded using Trusted Publishing? No
- Uploaded via: twine/5.0.0 CPython/3.9.18
File hashes
| Algorithm | Hash digest | |
|---|---|---|
| SHA256 |
a52b61afc25eb85bd959b072b58e9d46d9d5b79c31e782362df999b1e424ef0c
|
|
| MD5 |
0a776411e93caaafb21ab8fc7c348ffe
|
|
| BLAKE2b-256 |
61ee5aad6c4ae5c0b95d71d542bea4759ae974e4198f778eeaca17f114d6f735
|
File details
Details for the file pyndat-0.0.1-py3-none-any.whl.
File metadata
- Download URL: pyndat-0.0.1-py3-none-any.whl
- Upload date:
- Size: 17.4 kB
- Tags: Python 3
- Uploaded using Trusted Publishing? No
- Uploaded via: twine/5.0.0 CPython/3.9.18
File hashes
| Algorithm | Hash digest | |
|---|---|---|
| SHA256 |
4a6a6617445a3ae54463cb35bb96b11f8cfd32e1140865f8e21736399d65eb7a
|
|
| MD5 |
cce7b79429d43e59124c913c66ce911c
|
|
| BLAKE2b-256 |
df610a28f813657ada875829e2ea466de2fe5605a5d79f7b1f207080e9c4dd05
|


