
PyNutil
[!WARNING]
PyNutil is still under development and the API is subject to change.
PyNutil is a Python library for brain-wide quantification and spatial analysis of features in serial section images from the brain. It aims to replicate the Quantifier feature of the Nutil software (RRID: SCR_017183).
PyNutil is able to integrate outputs from atlas registration software and image segmentation software in order to produce atlas based quantifications, 3D point clouds, and 3D heatmaps of brain derived data.

For more information about the QUINT workflow: https://quint-workflow.readthedocs.io/en/latest/
Available Atlases
PyNutil can be run using a custom atlas in .nrrd format (e.g. tests/test_data/Allen_mouse_2017_atlas)
PyNutil can also be used with the atlases available in the BrainGlobe_Atlas API.
Installation
Python package
pip install PyNutil
Running demos
The scripts in demos/ assume PyNutil is importable as an installed package.
For development, install in editable mode from the repository root:
pip install -e .
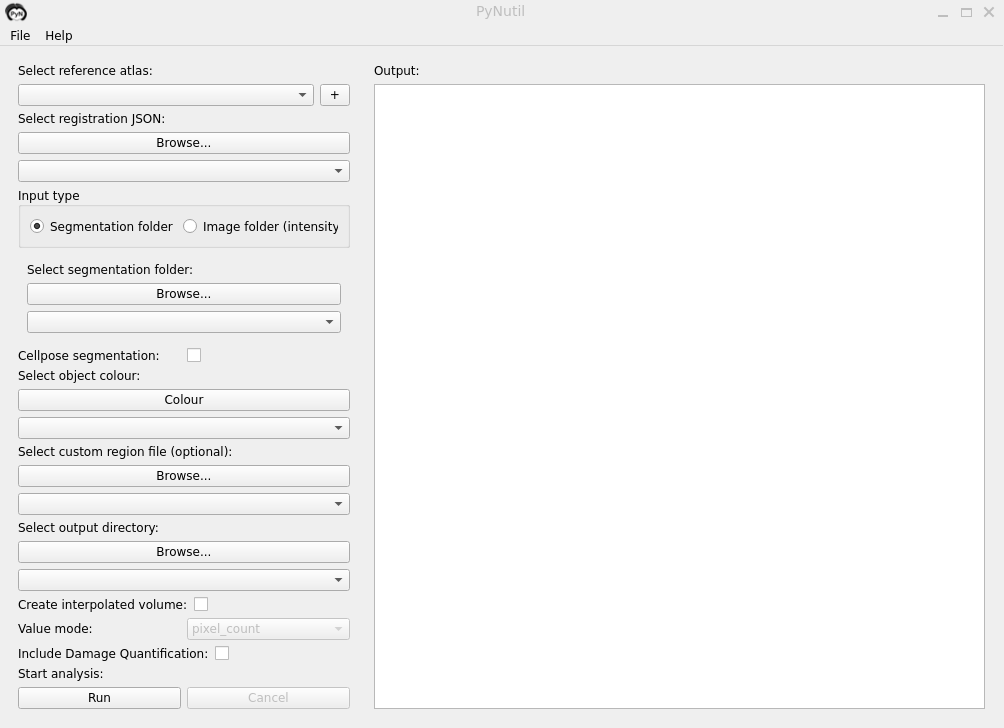
GUI
download the executable for Windows and macOS via the GitHub releases tab
Usage
PyNutil requires Python 3.8 or above.
As input, PyNutil requires:
- An atlas
- A corresponding alignment JSON created with the QuickNII or VisuAlign software.
- A segmentation file for each brain section with the features to be quantified displayed with a unique RGB colour code (it currently accepts many image formats: png, jpg, jpeg, etc).
from brainglobe_atlasapi import BrainGlobeAtlas
import PyNutil as pnt

# Load an atlas (BrainGlobe) and alignment
atlas = BrainGlobeAtlas("allen_mouse_25um")
alignment = pnt.read_alignment("path/to/alignment.json")

# Extract coordinates from segmentations
coords = pnt.seg_to_coords(
    "path/to/segmentations/",
    alignment,
    atlas,
    pixel_id=[0, 0, 0],
    # For cellpose segmentations: segmentation_format="cellpose"
)

# Quantify by atlas region
label_df = pnt.quantify_coords(coords, atlas)

# Save results
pnt.save_analysis("path/to/output", coords, atlas, label_df=label_df)
For custom atlases (not from BrainGlobe), use pnt.load_custom_atlas() instead.
See demos/basic_example.py and demos/basic_example_custom_atlas.py for complete examples.
PyNutil generates a series of reports in the folder which you specify.
Per-Hemisphere Quantification
If you use an atlas which has a hemisphere map (All brainglobe atlases have this, it is a volume in the shape of the atlas with 1 in the left hemisphere and 2 in the right) PyNutil will generate per-hemisphere quantifications in addition to total numbers. In addition, PyNutil will also genearte additional per-hemisphere point cloud files for viewing in meshview.
Damage Quantification
The QCAlign tool allows you to mark damaged areas on your section. This means that these damaged areas are excluded from your point clouds. In addition, PyNutil will separately quantify damaged and undamaged areas. Note the undamaged and damaged column names.
Meshview json files
PyNutil will produce meshview json files. These can be opened in MeshView for the Allen Mouse or for the Waxholm Rat
https://github.com/user-attachments/assets/d3a43ca9-133e-40d1-a1b9-9a359deabf2d
Siibra explorer compatible NifTI files
If you have interpolated your volume you will find an interpolated NifTI volume in your output directory. This can be dragged and dropped directly into siibra explorer. If you share your data you can also include a shareable link to your data in the Siibra viewer. These files are also viewable in ITK-SNAP.
https://github.com/user-attachments/assets/30ca7f7f-92f5-4d83-a92a-b29603181b8f
Interpreting the Results
Each column name has the following definition
| Column | Definition |
|---|---|
| idx | The atlas ID of the region. |
| name | The name of atlas region. |
| r | The amount of red in the RGB value for the region colour. |
| g | The amount of green in the RGB value for the region colour. |
| b | The amount of blue in the RGB value for the region colour. |
| Region area | Area representing the region on the segmentation in pixel values. |
| Object count | Number of objects located in the region. An object is a disconnected group of pixels |
| Object pixels | Number of pixels representing objects in this region. |
| Object area | Area representing objects in this region (object pixels x pixel scale). |
| Area fraction | Ratio of Object pixels to Region pixels (Object pixels / Region pixels). |
| Left hemi | For each of the other columns, what is that value for the left hemisphere alone |
| Right hemi | For each of the other columns, what is that value for the right hemisphere alone |
| Damaged | For each of the other columns, what is that value for the areas marked damaged alone |
| Undamaged | For each of the other columns, what is that value for the areas marked undamaged alone |
If you choose to measure the intensity of images rather than segmentations you will not get object counts. Instead you will get
| Column | Definition |
|---|---|
| Sum intensity | The sum of all image pixels in a region. |
| Mean inensity | The mean of all image pixels in a region. |
Feature Requests
We are open to feature requests 😊 Simply open an issue in the GitHub describing the feature you would like to see.
Acknowledgements
PyNutil is developed at the Neural Systems Laboratory at the Institute of Basic Medical Sciences, University of Oslo, Norway with support from the EBRAINS infrastructure, and funding support from the European Union’s Horizon 2020 Framework Programme for Research and Innovation under the Framework Partnership Agreement No. 650003 (HBP FPA).
Contributors
Harry Carey, Sharon C Yates, Gergely Csucs, Arda Balkir, Ingvild Bjerke, Rembrandt Bakker, Nicolaas Groeneboom, Maja A Puchades, Jan G Bjaalie.
Related articles
Yates SC, Groeneboom NE, Coello C, et al. & Bjaalie JG (2019) QUINT: Workflow for Quantification and Spatial Analysis of Features in Histological Images From Rodent Brain. Front. Neuroinform. 13:75. https://doi.org/10.3389/fninf.2019.00075
Groeneboom NE, Yates SC, Puchades MA and Bjaalie JG. Nutil: A Pre- and Post-processing Toolbox for Histological Rodent Brain Section Images. Front. Neuroinform. 2020,14:37. https://doi.org/10.3389/fninf.2020.00037
Puchades MA, Csucs G, Lederberger D, Leergaard TB and Bjaalie JG. Spatial registration of serial microscopic brain images to three-dimensional reference atlases with the QuickNII tool. PLosONE, 2019, 14(5): e0216796. https://doi.org/10.1371/journal.pone.0216796
Carey H, Pegios M, Martin L, Saleeba C, Turner A, Everett N, Puchades M, Bjaalie J, McMullan S. DeepSlice: rapid fully automatic registration of mouse brain imaging to a volumetric atlas. BioRxiv. https://doi.org/10.1101/2022.04.28.489953
Berg S., Kutra D., Kroeger T., Straehle C.N., Kausler B.X., Haubold C., et al. (2019) ilastik:interactive machine learning for (bio) image analysis. Nat Methods. 16, 1226–1232. https://doi.org/10.1038/s41592-019-0582-9
Contact us
Report issues here on GitHub or email: support@ebrains.eu
1 maintainer

Metadata
1 maintainer
Release files for PyNutil 0.6.2
For a detailed explanation of source distributions (sdists) and built distributions (wheels), please see the package formats documentation.
Source distribution (sdist)
| File | Size | Uploaded | |
|---|---|---|---|
| pynutil-0.6.2.tar.gz | 18.9 MB | Details |
Built distribution (wheel)
| File | Interpreter | ABI | Platform | Reset |
|---|---|---|---|---|
| pynutil-0.6.2-py3-none-any.whl | Python 3 | none | any | Details |
Total release size: 19.0 MB
Release files / pynutil-0.6.2.tar.gz
| Download URL | pynutil-0.6.2.tar.gz |
|---|---|
| Size | 18.9 MB |
| Tags | Source |
|
SHA-256 checksum How to use checksums |
40af0155c8471948fc61b381599a346ff02a7e4d9186f259da1d33584f45ab1b
|
|
BLAKE2b-256 checksum How to use checksums |
67c860f5eab33f46233a6edb906248b5619531d47428593d1e327af318ee9837
|
| Upload date | |
|
Uploaded using Trusted Publishing? What is trusted publishing? |
Yes |
| Uploaded via |
twine/6.1.0 CPython/3.13.12
|
Provenance
Provenance describes where a file came from. On PyPI, provenance is shared via attestations, which provide a verifiable record of the build or publishing details. View details, limitations and caveats.


PyPI Publish Attestation
PyPI verified that this artifact, at this checksum, originated from the publisher listed below.
Signed by GitHub Actions, verified by PyPI on Jun 19, 2026.
Transparency logRelease files / pynutil-0.6.2-py3-none-any.whl
| Download URL | pynutil-0.6.2-py3-none-any.whl |
|---|---|
| Size | 84.4 kB |
| Tags | Python 3 |
|
SHA-256 checksum How to use checksums |
1eec36cadf69f4ba3e142c7141644e831924bf4a0d3026ef1d42143302a85f40
|
|
BLAKE2b-256 checksum How to use checksums |
0f428cc3d9b198e060dd0361ae7b35db66beffffeb9a8682564b5634f5889d18
|
| Upload date | |
|
Uploaded using Trusted Publishing? What is trusted publishing? |
Yes |
| Uploaded via |
twine/6.1.0 CPython/3.13.12
|
Provenance
Provenance describes where a file came from. On PyPI, provenance is shared via attestations, which provide a verifiable record of the build or publishing details. View details, limitations and caveats.
PyPI Publish Attestation
PyPI verified that this artifact, at this checksum, originated from the publisher listed below.
Signed by GitHub Actions, verified by PyPI on Jun 19, 2026.
Transparency log













