
pyobsplot





pyobsplot allows to use Observable Plot to create charts in Jupyter or Marimo notebooks and Quarto documents. Plots are created from Python code with a syntax as close as possible to the JavaScript one.
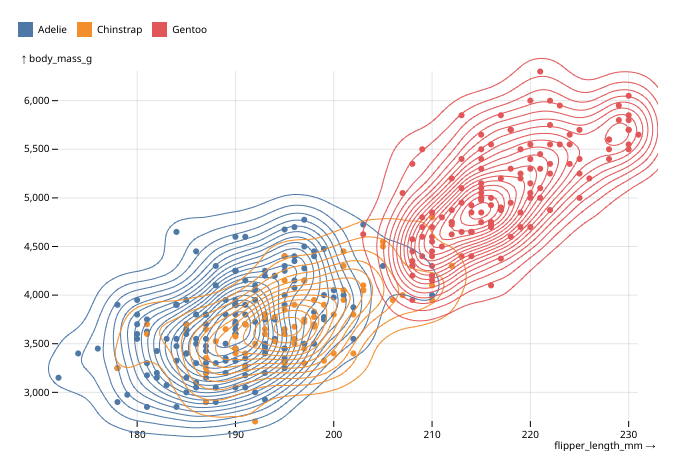
It allows to do things like :
import polars as pl
from pyobsplot import Plot

penguins = pl.read_csv("https://github.com/juba/pyobsplot/raw/main/doc/data/penguins.csv")

Plot.plot({
    "grid": True,
    "color": {"legend": True},
    "marks": [
        Plot.dot(
            penguins,
            {"x": "flipper_length_mm", "y": "body_mass_g", "fill": "species"}
        ),
        Plot.density(
            penguins,
            {"x": "flipper_length_mm", "y": "body_mass_g", "stroke": "species"}
        )
    ]
})
Installation and usage
pyobsplot can be installed with pip:
pip install pyobsplot[typst]
To use pyobsplot in JupyterLite or marimo you must install it without the typst dependency, which is not yet compatible with pyodide:
pip install pyobsplot
For usage instructions, see the documentation website:
- See getting started for a quick usage overview.
- See usage for more detailed usage instructions.
If you just want to try this package without installing it on your computer, you can open an introduction notebook in Google Colab:
Features and limitations
Features:
- Syntax as close as possible to the JavaScript one
- Plots can be generated as Jupyter widgets, or as SVG, HTML or PNG outputs (via typst)
- Plots can be saved to Widget HTML, static HTML, SVG, PNG or PDF files
- Pandas and polars DataFrame and Series objects are serialized using Arrow IPC format for improved speed and better data type conversions
- Works with Jupyter, JupyterLite and Marimo notebooks as well as in Quarto documents
- Works offline, no iframe or dependency to Observable runtime
- Caching mechanism of data objects if they are used several times in the same plot
- Custom JavaScript code can be passed as strings with the
jsmethod - Python
dateanddatetimeobjects are automatically converted to JavaScriptDateobjects
Limitations:
- Plot interactions (tooltips, crosshair...) are only available with the "widget" format (https://github.com/juba/pyobsplot/issues/16).
- Very limited integration with IDE (documentation and autocompletion) for Plot methods. (https://github.com/juba/pyobsplot/issues/13)
Credits
- Observable Plot, developed by Mike Bostock and Philippe Rivière among others.
- The widget is developed thanks to the anywidget framework.
- typst is used to convert HTML figures to PNG, SVG or PDF.
- Some code from the
jsdomrenderer has been adapted from altair_saver. - The documentation website is generated by Quarto.
1 maintainer

Metadata
1 maintainer
Release files for pyobsplot 0.5.4
For a detailed explanation of source distributions (sdists) and built distributions (wheels), please see the package formats documentation.
Source distribution (sdist)
| File | Size | Uploaded | |
|---|---|---|---|
| pyobsplot-0.5.4.tar.gz | 485.4 kB | Details |
Built distribution (wheel)
| File | Interpreter | ABI | Platform | Reset |
|---|---|---|---|---|
| pyobsplot-0.5.4-py3-none-any.whl | Python 3 | none | any | Details |
Total release size: 799.3 kB
Release files / pyobsplot-0.5.4.tar.gz
| Download URL | pyobsplot-0.5.4.tar.gz |
|---|---|
| Size | 485.4 kB |
| Tags | Source |
|
SHA-256 checksum How to use checksums |
752ef55bc949ecfe32a4d20b9bfb95185bb7abe49b257f370fa0f3a922c6b486
|
|
BLAKE2b-256 checksum How to use checksums |
0fe1913e7f6248d3250e81c6c024775d4569094fde034e36194699262c360e94
|
| Upload date | |
|
Uploaded using Trusted Publishing? What is trusted publishing? |
No |
| Uploaded via |
uv/0.7.10
|
Release files / pyobsplot-0.5.4-py3-none-any.whl
| Download URL | pyobsplot-0.5.4-py3-none-any.whl |
|---|---|
| Size | 313.9 kB |
| Tags | Python 3 |
|
SHA-256 checksum How to use checksums |
fe3b5a0c2a0b0bec49c50448046eb73d98f19c42eb6d95206f46a27ceb95e6be
|
|
BLAKE2b-256 checksum How to use checksums |
39cdbfdb0639ec428c87f25e339a9d3cf844b5f67195bfbad1c8b4b5b17a9a22
|
| Upload date | |
|
Uploaded using Trusted Publishing? What is trusted publishing? |
No |
| Uploaded via |
uv/0.7.10
|














