The package for reading and manipulating the fispact output text file.

Project description


Pypact
Making FISPACT-II output easier to parse, with Python 3
Documentation here @ pypact.readthedocs.io
- Design goals
- Notes on accuracy
- Installation
- Usage
- Examples
- Supported outputs
- Executing unit tests
- Contact
Example - outputplotting/gammaspectrumanimation.py

Example - outputplotting/chartofnuclides.py

Example - outputplotting/periodictable.py

Design Goals
The aim of Pypact is to make the FISPACT-II output file easy to parse so that more time can be spent on analysis, and much less time on interrogating the output file. No more convoluted scripts, just one simple to use package!
Notes on accuracy
Before we get into how to install and use pypact, a small detail regarding accuracy should be noted.
It is important to realise that the precision of some values in the FISPACT-II output file can be limited and hence parsing with pypact will give the same precision. It cannot give a more accurate result than the output file.
For example nuclide heats are only given to 3/4 significant figures and if using this in your analysis it can accumulate to larger differences for complex simulations. If you require more accuracy in your results then you are advised to use the JSON output format within FISPACT-II itself (since version 4.0), where double precision is used, roughly 16 significant figures. This is illustrated below.
An example is shown for a Si 31 nuclide entry, using both JSON approaches.
Using pypact to parse the FISPACT-II standard output.
{
    "element": "Si",
    "isotope": 31,
    "state": "",
    "half_life": 9432.0,
    "grams": 3.699e-16,
    "activity": 528.5,
    "heat": 5.046e-14,
    "alpha_heat": 0.0,
    "beta_heat": 5.028e-14,
    "gamma_heat": 1.84e-16,
    "dose": 1.399e-10,
    "ingestion": 8.456e-08,
    "inhalation": 4.175e-08
}
Using FISPACT-II JSON output directly.
{
    "element": "Si",
    "isotope": 31,
    "state": "",
    "half_life": 0.9432E+4,
    "grams": 0.36990418187287751E-15,
    "activity": 0.52850009418322043E+3,
    "heat": 0.50459332881338111E-13,
    "alpha_heat": 0.0E+0,
    "beta_heat": 0.50275382281787085E-13,
    "gamma_heat": 0.18395059955102398E-15,
    "dose": 0.1398653735340394E-9,
    "ingestion": 0.84560014731430124E-7,
    "inhalation": 0.41751507961244766E-7
}
Installation
The package is hosted on PyPi and is therefore available with pip3 directly.
A note on the nature of Pypact, it is written in Python3 and does not support Python2, therefore in order to use the package, you must have a version of Python3 installed along with pip3.
To install simply do
pip3 install pypact
After this it is easy to test if the package is installed by checking the command line tool that is shipped with it.
fispactconverter.py -h
The output should give you the help menu for the converter tool.
usage: fispactconverter.py [-h] outputfile jsonoutputfile

Fispact Output Converter

positional arguments:
  outputfile      The fispact output (.out) file to be read
  jsonoutputfile  The fispact output file in JSON format to be written

optional arguments:
  -h, --help      show this help message and exit
More on this later, but fispactconverter is a command line tool to convert the FISPACT-II output to a JSON output.
Usage
As shown above you can simply run the command line tool and not use anything more from the package if you so wish. Or if you're feeling more adventurous and would like to integrate it into a current project or script you can import the package. Both ways are described below.
Command line tool
The command line tool is a python3 script uses the pypact modules to parse a FISPACT-II output file into memory, then serializes this to a more friendly and useable output JSON format.
To use the tool it requires an output file to deserialize and a JSON output file that will be created. The fispact output file must exist, otherwise the tool will fail and no JSON will be produced.
The paths should be relative to the current directory but the tool can be ran from any location, since it should be on your $PATH.
A simple example is shown below using a FISPACT-II output file 'test91.out'. This can be found on the git repository in the reference directory.
$pwd
/testdir/example
$ls
test91.out
$fispactconverter.py test91.out test91.json
$ls
test91.out test91.json
This would have equally have worked if in another directory for example.
$pwd
/testdir
$ls
example
$fispactconverter.py example/test91.out example/test91.json
$ls
/testdir
$ls /testdir
test91.out test91.json
Note that you must specify the extension for the JSON file, otherwise the file will have no extension but it will still be in JSON format. Additionally, the JSON filename does not have to match the FISPACT-II output filename, as the below example shows.
$pwd
/testdir/example
$ls
test91.out
$fispactconverter.py test91.out call_me_anything.json
$ls
test91.out call_me_anything.json
Importing the modules
A much better way to use the package is to import the modules directly into your existing python code and make new scripts using it. Note that it must be a Python3 project, not Python2!
A simple example of how to read the output into memory is given below.
import pypact as pp

filename = "fispact_ii_run_output_file.out"

with pp.Reader(filename) as output:
    # do your analysis here
...
Creating and manipulating input files
It is now possible to use pypact to manipulate and create some of the legacy input files, such as the input (*.i) FISPACT-II run file, the files file (IO paths), and the fluxes file, necessary for FISPACT-II to run.
Some examples are provided of how to use this module in the examples subdirectory.
A simple example of creating an input file is shown below:
import pypact as pp

id = pp.InputData(name='test')

# control setup
id.overwriteExisting()
id.enableJSON()
id.approxGammaSpectrum()
id.readXSData(709)
id.readDecayData()
id.enableHalflifeInOutput()
id.enableHazardsInOutput()
id.setProjectile(pp.PROJECTILE_NEUTRON)
id.enableSystemMonitor()
id.readGammaGroup()
id.enableInitialInventoryInOutput()
id.setLogLevel(pp.LOG_SEVERITY_ERROR)

# thresholds
id.setXSThreshold(1e-12)
id.setAtomsThreshold(1e5)

# set target
id.setDensity(19.5)
id.setMass(1.0)
id.addElement('Ti', percentage=80.0)
id.addElement('Fe', percentage=14.8)
id.addElement('Cr', percentage=5.2)

# irradiate and cooling times
id.addIrradiation(300.0, 1.1e15)
id.addCooling(10.0)
id.addCooling(100.0)
id.addCooling(1000.0)
id.addCooling(10000.0)
id.addCooling(100000.0)

# validate data
id.validate()
# write to file
pp.to_file(id, '{}.i'.format(id.name))
...
Reading printlib files
Typically PRINTLIB options in FISPACT-II provide the user with complementary information that is not available in conventional output files. Whilst the format is more straightforward to parse than the standard .out file, it can still be cumbersome to automate. Pypact now provides readers for various PRINTLIB options. Currently supported formats are:
- PRINTLIB 0 (redundant)
- PRINTLIB 1
- PRINTLIB 2
- PRINTLIB 3
- PRINTLIB 4 - collapsed cross section (see example/printlib4.py)
- PRINTLIB 5 - spectral lines (see example/printlib5.py)
- PRINTLIB 6
- PRINTLIB 7
- PRINTLIB 8
- PRINTLIB 9
Examples
Some basic examples are given on how to intergoate the output.
Print the run name
import pypact as pp

filename = "fispact_ii_run_output_file.out"

with pp.Reader(filename) as output:
    rd = output.run_data
    print(rd.run_name)
Loop over time steps
import pypact as pp

filename = "fispact_ii_run_output_file.out"


with pp.Reader(filename) as output:
    for t in output.inventory_data:
        print(t.irradiation_time)
        print(t.flux)
        print(t.ingestion_dose)
        ....
Number of nuclides
# Note the different way to import
from pypact.reader import Reader

filename = "fispact_ii_run_output_file.out"

with Reader(filename) as output:
    for t in output.inventory_data:
        print(len(t.nuclides))
JSON serialize
The package is written such that every data object can be JSON serialized and deserialized, as well as FISPACT-II deserialized. Whether it be the whole Output object or just a dose at a given timestep, it can be parsed and written to JSON. An example showing this for the Run Data is given below.
import pypact as pp

filename = "fispact_ii_run_output_file.out"

with pp.Reader(filename) as output:
    # print JSON format to standard output
    print(output.run_data.json_serialize())
The output would then look like
{
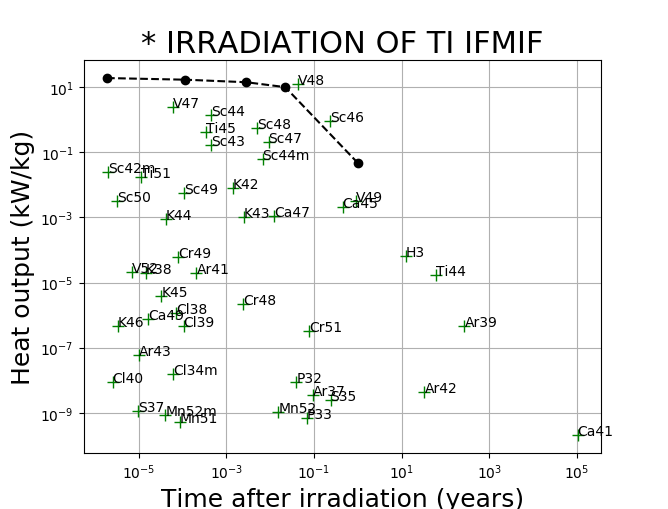
"timestamp": "10:05:38 30 August 2017",
"run_name": "* IRRADIATION OF TI IFMIF",
"flux_name": "IFMIF 40MeV d on Cu tot=8.90979E"
}
Similarly this can be done for data in the inventory data, if the timestamp is known. For example, given timestamp 2 exists in the FISPACT-II output file, we can do the following.
import pypact as pp

filename = "fispact_ii_run_output_file.out"

fr = pp.FileRecord(filename)

dr = pp.DoseRate()
dr.fispact_deserialize(fr, interval=2)

# print JSON format to standard output
print(dr.json_serialize())
Or it can be done even simpler, by:
import pypact as pp

filename = "fispact_ii_run_output_file.out"

with pp.Reader(filename) as output:
    print(output[2].dose_rate.json_serialize())
The output would then look like
{
  "type": "PLANE SOURCE",
  "distance": 0.0,
  "mass": 0.0,
  "dose": 22946.0
}
Plotting
An example script and some helper functions are included to show how some plots can be constructed using pypact.
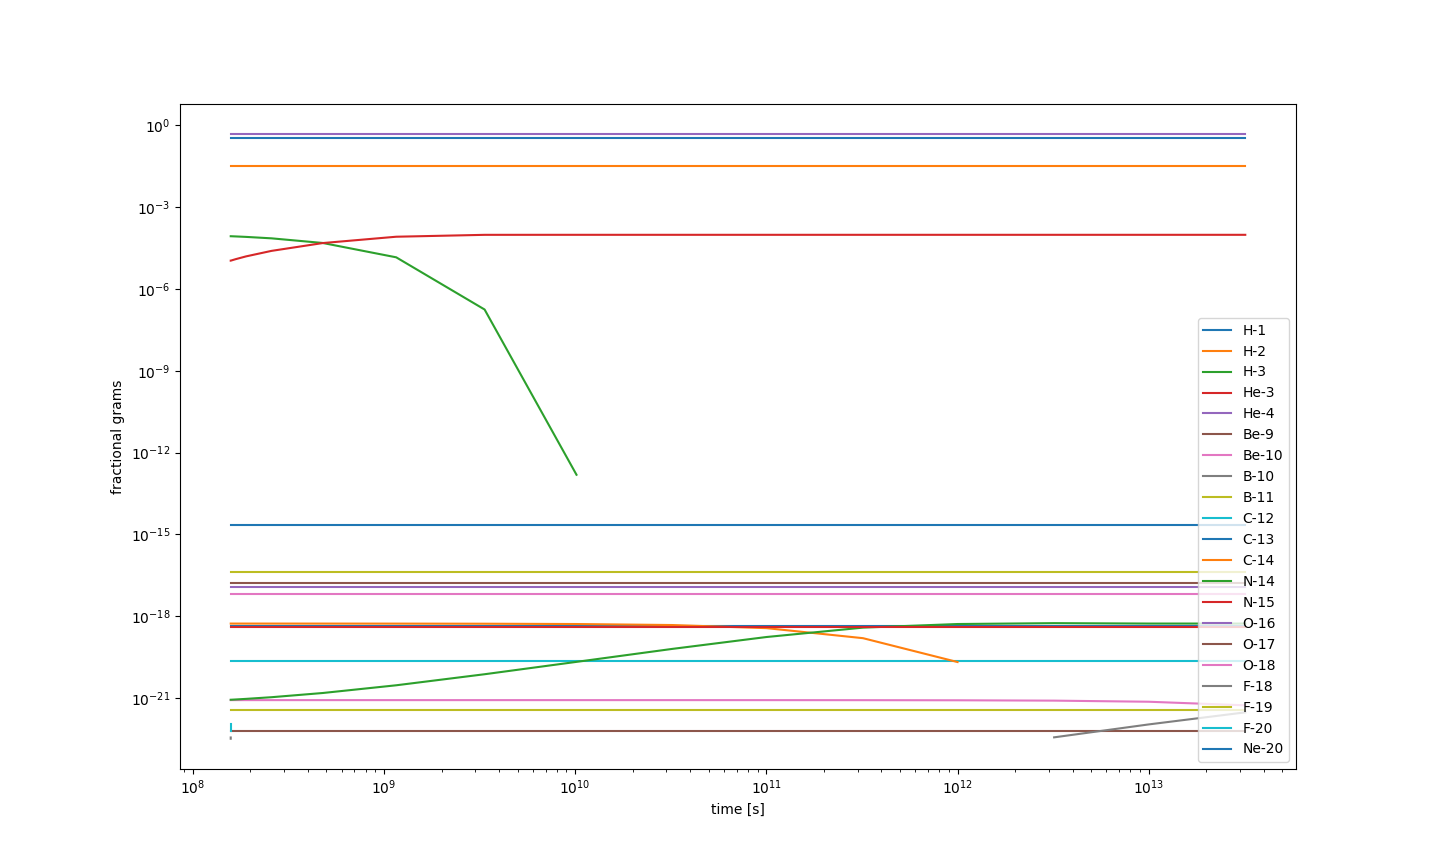
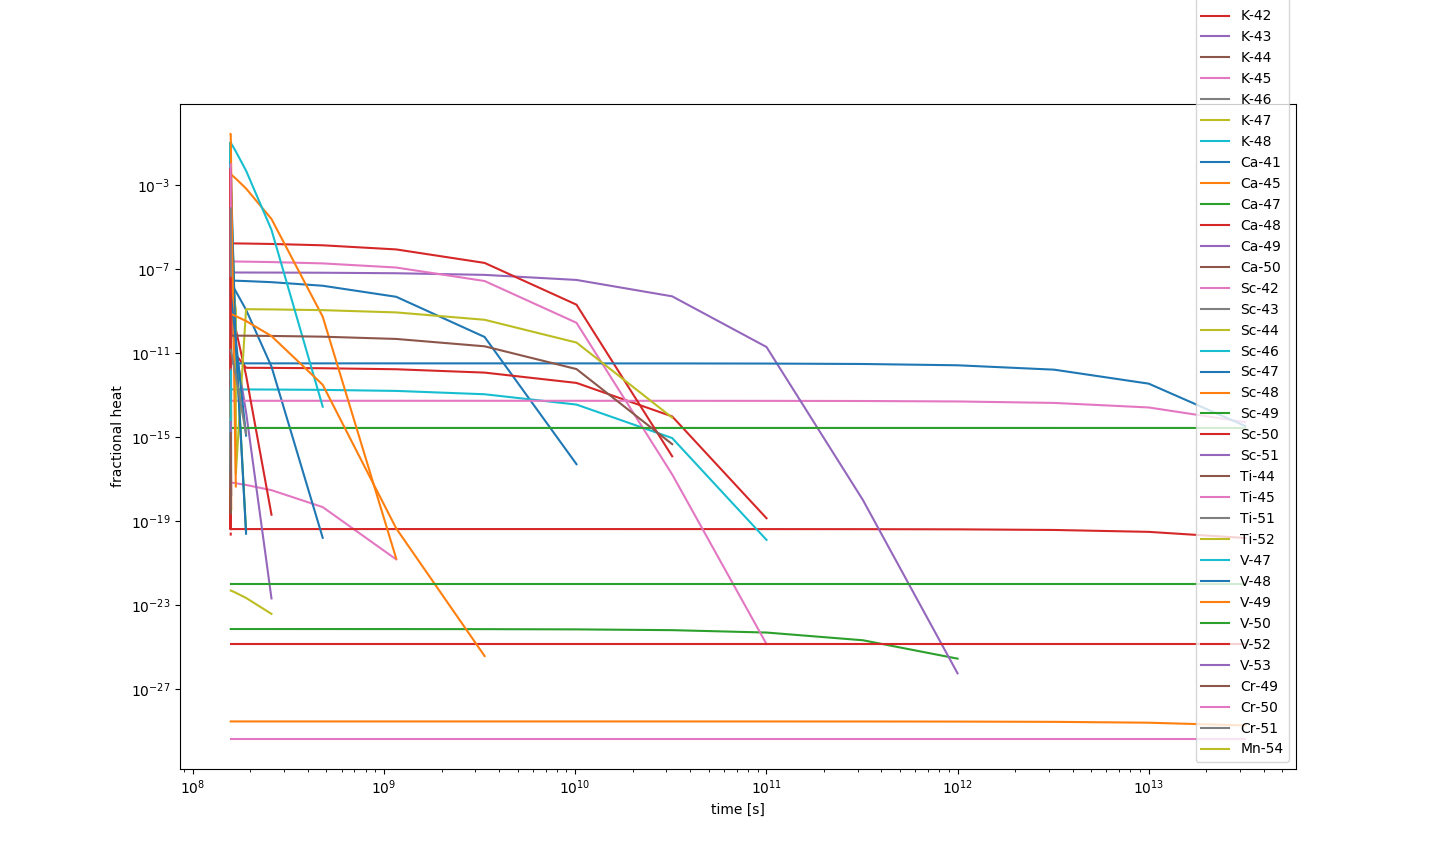
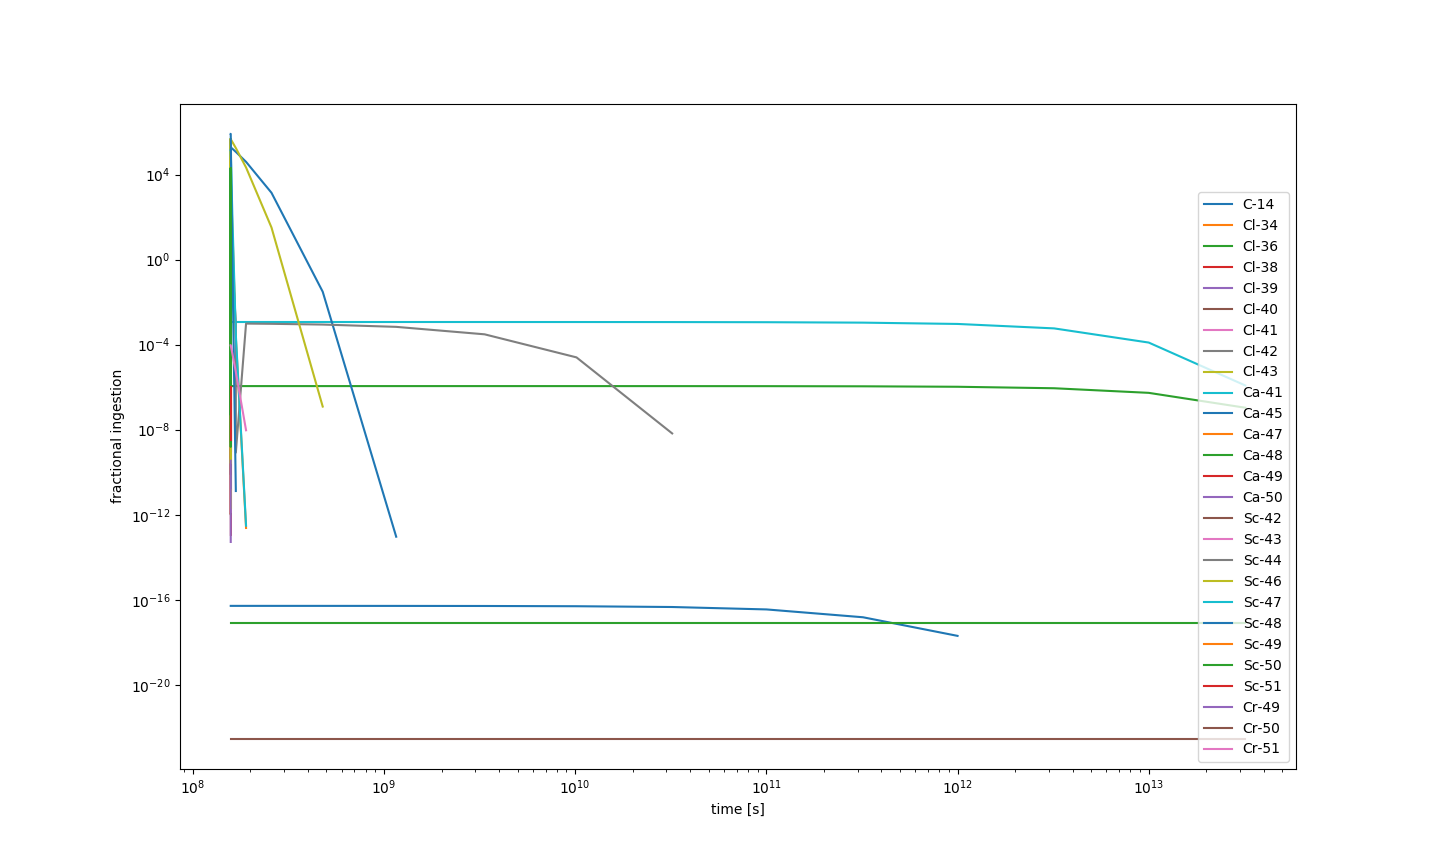
A nuclide library (in JSON format) exists containing the list of all isotopes, that is containing 118 elements from H to Og, and totaling to 3352 isotopes. These can be used in their entirety as a complete list using get_all_isotopes() or can be filtered as the example below shows. Some plotting functions are added in the 'pypact.analysis' module and are also used in the script below.
This example script is based on that in the package at 'pypact/examples/plotnuclideheat.py'. Note that this is an example only and is to show how pypact can be used to help perform certain analyses.
import re
import os

import pypact as pp
import pypact.analysis as ppa

filename = os.path.join(os.path.dirname(os.path.abspath(__file__)),
                             '..', 'reference', 'test127.out')

tz = ppa.TimeZone.COOL
properties = ['heat', 'grams', 'ingestion']
isotopes = [ ppa.NuclideDataEntry(i) for i in ppa.get_all_isotopes() if ppa.find_z(i[0]) <= 10]

plt = ppa.LinePlotAdapter()

with pp.Reader(filename) as output:
    for p in properties:
        ppa.plotproperty(output=output,
                         property=p,
                         isotopes=isotopes,
                         plotter=plt,
                         fractional=True,
                         timeperiod=tz)

plt.show()
The results of this script are shown below.
Compare .out to .json outputs
Pypact can handle the parsing of both the .out fispact file and the .json fispact file, which was added in FISPACT-II 4.0. To compare that both output parsers handle the data correctly, an example has been added to use both file formats to plot the total heat after irradiation. The example produces two identical plots to prove the parser correctness. The example, compareplots.py, can be found at 'pypact/examples/compareplots.py' and uses the reference output files test31.out and test31.json to produce the following plot.
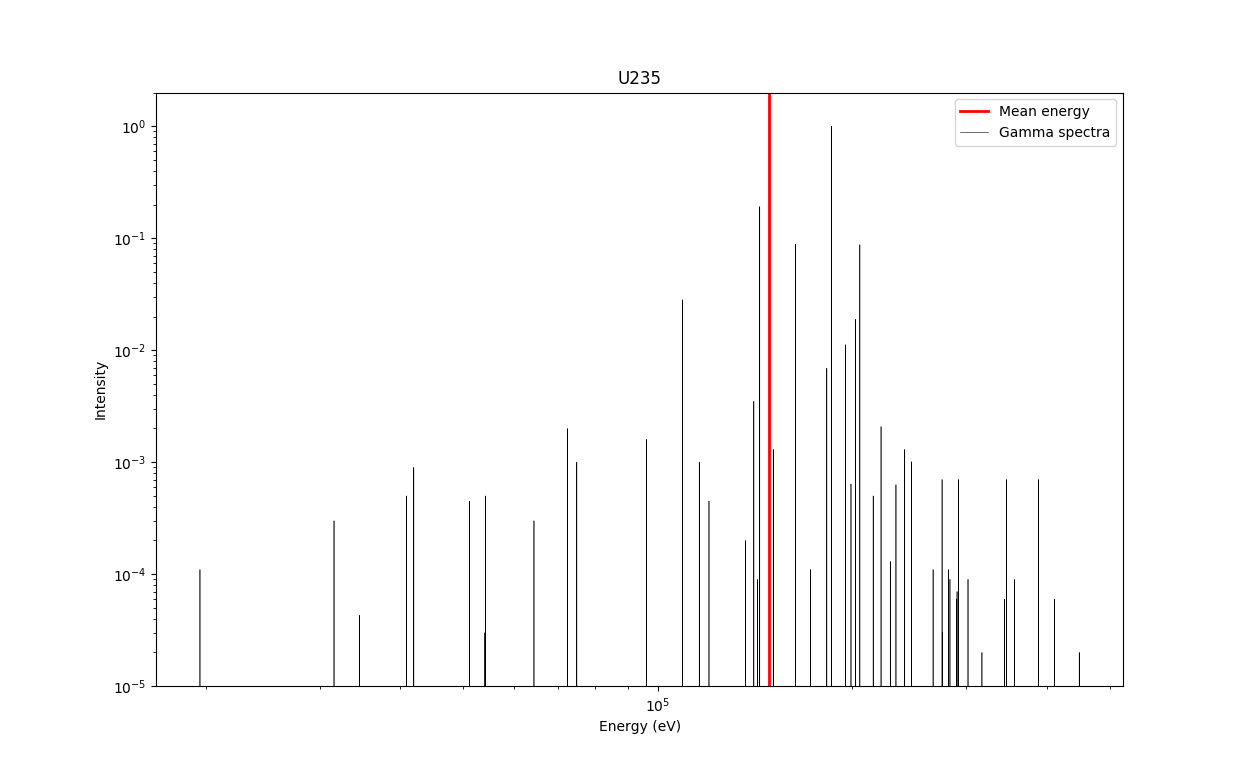
Get the spectral line data from the printlib files
Whilst Pypact is designed to handle only conventional inventory output files, recent developments can allow parsing of other files, such as printlib outputs. Currently only printlib 5 output (spectral lines) is supported.
An example of using this is given in the examples, but the API is similar to the conventional reader. Note that PrintLib5Reader must be used instead of Reader.
import pypact as pp

with pp.PrintLib5Reader('printlib5.out') as output:
    for m in output.spectral_data:
        # U235
        if m.zai == 922350:
            print(m.json_serialize())
The spectral lines can easily be plotted:
Executing tests
In order to run the unit tests to check if the package is correctly downloaded, it is required to install pytest from pip.
pip3 install pytest
Once installed and in the base directory for Pypact run
python3 setup.py test
Supported outputs
At time of writing, not all of the FISPACT-II output can be parsed and therefore some data is missing from Pypact. It is our intention to cover the whole file (or the important bits) in the future, until then the list of supported outputs is listed below.
Now contains gamma spectrum, which has the bin values of size n, and bin boundaries of size n+1. See the examples for gammaspectrum and the animation option.
- Output (returned from reader() operation)
- Run Data (output.run_data) - run name (output.run_data.run_name) - timestamp (output.run_data.timestamp) - flux name (output.run_data.flux_name)
- Inventory Data (output.inventory_data) - list of TimeStep objects, which has - irradation time (output.inventory_data[entry].irradiation_time) - cooling time (output.inventory_data[entry].cooling_time) - flux (output.inventory_data[entry].flux) - total heat (output.inventory_data[entry].total_heat) - alpha heat (output.inventory_data[entry].alpha_heat) - beta heat (output.inventory_data[entry].beta_heat) - gamma heat (output.inventory_data[entry].gamma_heat) - ingestion dose (output.inventory_data[entry].ingestion_dose) - inhalation dose (output.inventory_data[entry].inhalation_dose) - gamma_spectrum (output.inventory_data[entry].gamma_spectrum) - boundaries (output.inventory_data[entry].gamma_spectrum.boundaries) - values (output.inventory_data[entry].gamma_spectrum.values) - dose rate (output.inventory_data[entry].dose_rate) - type (output.inventory_data[entry].dose_rate.type) - distance (output.inventory_data[entry].dose_rate.distance) - mass (output.inventory_data[entry].dose_rate.mass) - dose (output.inventory_data[entry].dose_rate.dose) - nuclides (output.inventory_data[entry].nuclides) - nuclides (output.inventory_data[entry].nuclides.nuclides)
Nuclides is a list of Nuclide objects containing:
- Nuclide (output.inventorydata[entry].nuclides.nuclides[nentry] _aka nuclide)
- element (nuclide.element)
- isotope (nuclide.isotope)
- state (nuclide.state)
- half life (nuclide.half_life)
- grams (nuclide.grams)
- activity (nuclide.activity)
- heat (nuclide.heat)
- alpha heat (nuclide.alpha_heat)
- beta heat (nuclide.beta_heat)
- gamma heat (nuclide.gamma_heat)
- dose (nuclide.dose)
- ingestion (nuclide.ingestion)
- inhalation (nuclide.inhalation)
Contact
For more information or requests, contact us through https://fispact.ukaea.uk/contact
Release history Release notifications | RSS feed


Download files
Download the file for your platform. If you're not sure which to choose, learn more about installing packages.
Source Distribution
Built Distribution
Filter files by name, interpreter, ABI, and platform.
If you're not sure about the file name format, learn more about wheel file names.
Copy a direct link to the current filters
File details
Details for the file pypact-1.3.8.tar.gz.
File metadata
- Download URL: pypact-1.3.8.tar.gz
- Upload date:
- Size: 186.5 kB
- Tags: Source
- Uploaded using Trusted Publishing? No
- Uploaded via: twine/6.2.0 CPython/3.12.12
File hashes
| Algorithm | Hash digest | |
|---|---|---|
| SHA256 |
cec189a671920955ffc92f8a912cfc58149daad336f9d1c4c9393a4d54e303dd
|
|
| MD5 |
63f8dd3ddf1e6fe3d7e40cbaba0d9ea3
|
|
| BLAKE2b-256 |
82a748ab641173e8ddaa99b3a43e97bdda803a46cf80a9b3f727348854c29a9d
|
File details
Details for the file pypact-1.3.8-py3-none-any.whl.
File metadata
- Download URL: pypact-1.3.8-py3-none-any.whl
- Upload date:
- Size: 191.6 kB
- Tags: Python 3
- Uploaded using Trusted Publishing? No
- Uploaded via: twine/6.2.0 CPython/3.12.12
File hashes
| Algorithm | Hash digest | |
|---|---|---|
| SHA256 |
6867f5518918198982ee1d0da34c147be06ed2bc71ffc48a5d96b130e200e80a
|
|
| MD5 |
054ac31ee4ef19cd7bbfb93e77baa402
|
|
| BLAKE2b-256 |
5713bd208befb24f8e737883f59c2037b49aae9e7d17087f6d2a741b124165a5
|


