
Saves plots as PDF with embedded generating script

Project description
Overview
The pypdfplot package provides a backend to Matplotlib that generates a PDF file of the plot with the generating Python script embedded.
Normally, once a Matplotlib plot is saved as PNG or PDF file, the link between the plot and its generating Python script is lost. The philosophy behind pypdfplot is that there should be no distinction between the Python script that generates a plot and its output PDF file, much like there is no such distinction in an Origin or Excel file. As far as pypdfplot is concerned, the generating script is the plot.
When the pypdfplot backend is loaded and a figure is saved with plt.savefig(), the generating Python script is embedded into the output PDF file in such a way that when the PDF file is renamed from .pdf to .py, the file can be read by a Python interpreter directly without alteration. The script can be modified to implement changes in the plot, after which the script is ran again to produce the updated PDF file of the plot – including the updated embedded generating script.
The resulting file is both a valid Python file and a valid PDF file, and is conveniently call a PyPDF file. The compatibility with both Python and PDF is achieved by arranging the data blocks in the PyPDF file in a very specific order, such that the PDF-part is read as comment block in Python, and the Python-part is seen as an embedded file by a PDF reader.
To learn more about how to use pypdfplot, read the full manual [here](https://pypdfplot.readthedocs.io/), or check out the commented examples in the examples folder.
Installation
PyPI repository
Install the package from the PyPI repository opening a command prompt and enter:
pip install pypdfplotGithub or download
Alternatively, the source files can be downloaded directly from the GitHub repository. After downloading the source files, navigate to the project directory and install the package by opening a command prompt and enter:
python setup.py installAnaconda/Spyder
In order for pypdfplot to work in an Anaconda/Spyder environment, the package has to be installed from source with the “editable” option.
Download the source code following the instructions above. Open an Anaconda prompt and navigate to the directory with the source code. Now install the package by typing in the Anaconda prompt:
pip install -e .Installing the package with the “editable” option guarantees that the libraries are reloaded each time the code is ran.
This will produce a warning in the IPyhton console, which can be turned off by unchecking the “Show reloaded module list” box in the Tools > Preferences > Python interpreter menu in Spyder.
Next, navigate to the Graphics tab in the Tools > Preferences > IPython console menu and set the backend to “Automatic”.
It is further recommended to save the figure with the keyword cleanup = 'False'.
Quickstart
In this example, a plot is produced with Matplotlib and saved as PyPDF-file using the pypdfplot backend.
First, create a new python file and call it e.g. example.py.
To produce a PyPDF-file, all you have to do is import the pypdfplot backend by adding the line import pypdfplot.backend before importing Matplotlib:
import pypdfplot.backend
import matplotlib.pyplot as plt
import numpy as np

x = np.arange(-10,20,0.1)
y = x**2

plt.plot(x,y)
plt.savefig('example.pdf')
After running this script, the file example.py will have been removed and replaced by a new file example.pdf:
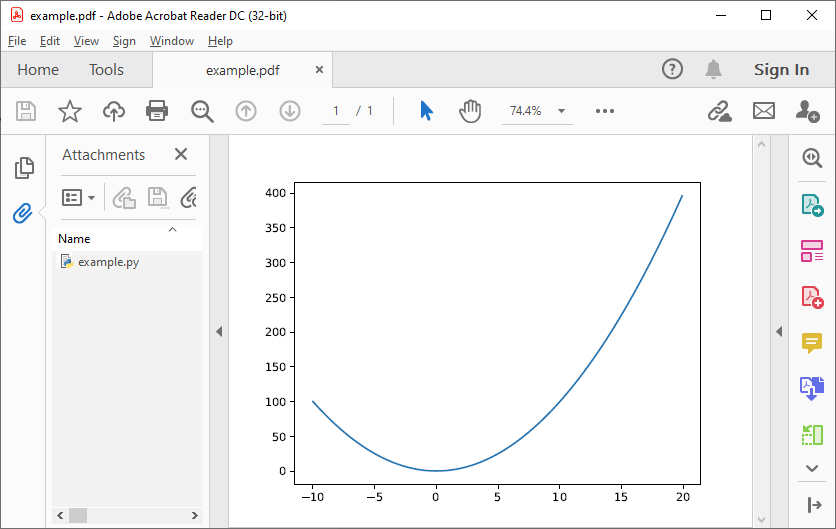
As can be seen in the “Attachments” column on the left, the orginal example.py generating script is embedded in the PDF file.
The script can be accessed by renaming example.pdf back to example.py and opening it in a text editor:
#%PDF-1.4 24 0 obj << /Type /EmbeddedFile /Length        690 >> stream
import pypdfplot.backend
import matplotlib.pyplot as plt
import numpy as np

x = np.arange(-10,20,0.1)
y = x**2

plt.plot(x,y)
plt.savefig('example.pdf')

"""
--- Do not edit below ---
endstream
endobj
1 0 obj

<< ... >>

startxref
9567
%%EOF
0000010174 LF
PyPDF-1.0
"""
It can be seen that after saving the plot with the pypdfplot backend, a commented line was added at the first line and a large comment block was appended at the end of the file. These comments contain all the necessary data for displaying the PDF and should not be altered directly by the user.
To update the plot, the user should instead modify the generating Python script and the PDF will be updated after running the script again!
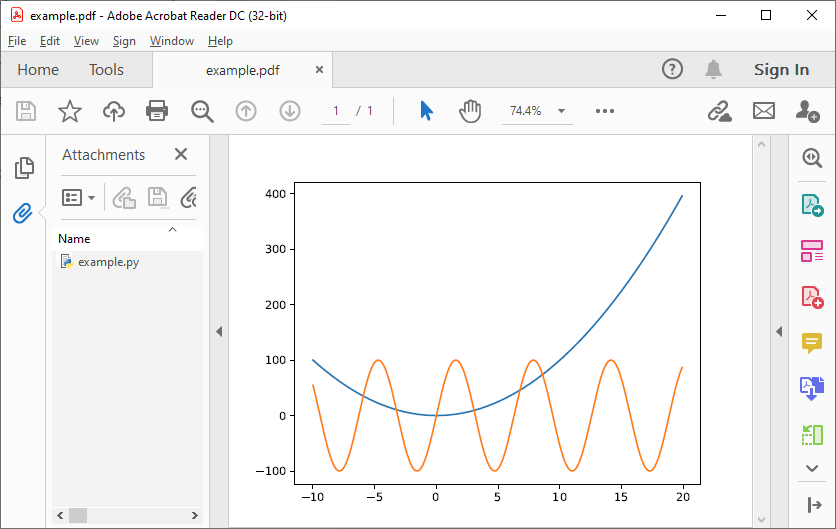
For example, let’s add another plot, e.g. a sine function:
#%PDF-1.4 24 0 obj << /Type /EmbeddedFile /Length        690 >> stream
import pypdfplot.backend
import matplotlib.pyplot as plt
import numpy as np

x = np.arange(-10,20,0.1)
y1 = x**2
y2 = 100*np.sin(x)

plt.plot(x,y1)
plt.plot(x,y2)
plt.savefig('example.pdf')

"""
--- Do not edit below ---
endstream
endobj
1 0 obj

<< ... >>

startxref
9567
%%EOF
0000010174 LF
PyPDF-1.0
"""
After running example.py, the file is again replaced by our updated example.pdf:
Changelog
v0.7.0
Switch to the new pypdf as dependency over PyPDF4.
Add backup of pyfile in the pypdf file, and read it if the original pyfile is lost.
Add tests that run with pytest
Fix issues with docs
v0.6.5
Previous patch introduced a new problem with the “Do not edit below” string. This is now solved.
v0.6.4
Prevent deletion of output when input is .pdf
Fixes additional PyPDF4 compatibility issues
v0.6.3
Fix compatibility with PyPDF4 v1.27.0
v0.6.2
Fix missing installation of backend
Fix some links in docs
v0.6.1
Documentation completely updated
Removed legacy publish() function, only works as Matplotlib backend now.
Changed auto_extract() to unpack()
Changed file_list to pack_list
Added __PYPDFVERSION__ as canonical version no.
Added pw.setPyPDFVersion() to fix_pypdf()
v0.6.0
First official release
Release history Release notifications | RSS feed


Download files
Download the file for your platform. If you're not sure which to choose, learn more about installing packages.
Source Distribution
Built Distribution
Filter files by name, interpreter, ABI, and platform.
If you're not sure about the file name format, learn more about wheel file names.
Copy a direct link to the current filters
File details
Details for the file pypdfplot-0.7.0.tar.gz.
File metadata
- Download URL: pypdfplot-0.7.0.tar.gz
- Upload date:
- Size: 28.4 kB
- Tags: Source
- Uploaded using Trusted Publishing? No
- Uploaded via: twine/6.2.0 CPython/3.12.10
File hashes
| Algorithm | Hash digest | |
|---|---|---|
| SHA256 |
ba1edd96fd6fc151b7e1b0a9cb90f17d45156c84d9e226f867a2302aea094f3b
|
|
| MD5 |
b36b45b4eea0c7378a1e1f11d4c2b2ea
|
|
| BLAKE2b-256 |
4fa9944a2c4d2db497ace4badc5e20480b8ddf5bedac3fc299a22abca44be722
|
File details
Details for the file pypdfplot-0.7.0-py3-none-any.whl.
File metadata
- Download URL: pypdfplot-0.7.0-py3-none-any.whl
- Upload date:
- Size: 27.3 kB
- Tags: Python 3
- Uploaded using Trusted Publishing? No
- Uploaded via: twine/6.2.0 CPython/3.12.10
File hashes
| Algorithm | Hash digest | |
|---|---|---|
| SHA256 |
976edc56254d3095c865747e75517503188e277144385385efe20f111afd964e
|
|
| MD5 |
0adfa6620baa229fcd62ad575b559aa7
|
|
| BLAKE2b-256 |
5611ad3d768c41b9c12a37d27b72931d8008c437f0bce20bd846a7b8ebcd7f91
|






